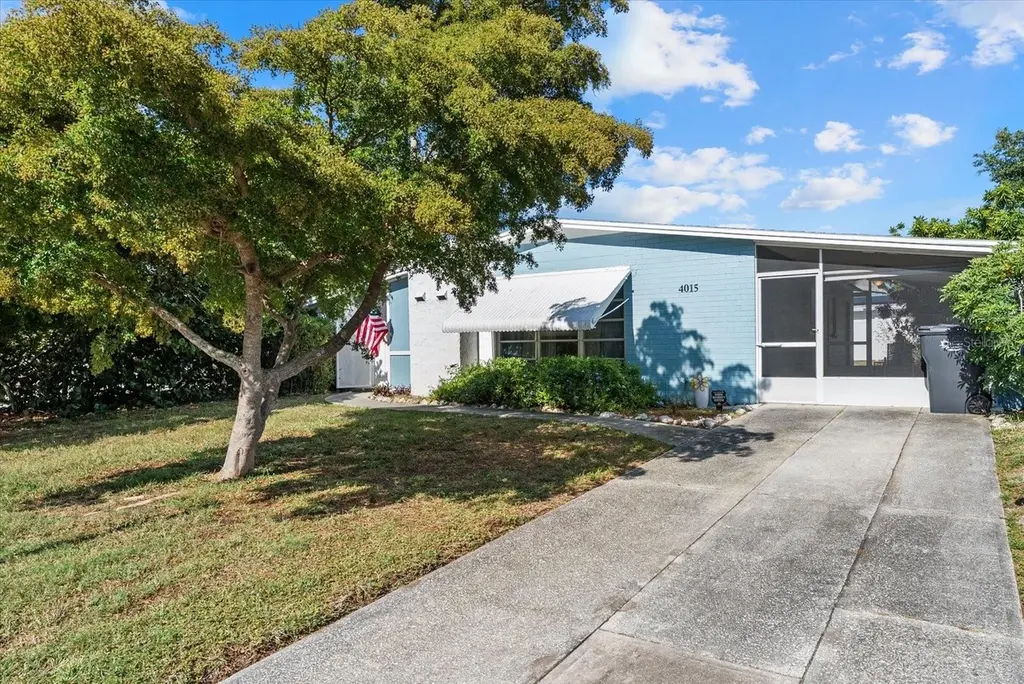
4015 52nd Street Ct W · Bradenton, FL
Flood risk 4/10 · Minor
- FEMA flood zone
- X (unshaded)
- Chance of flooding over 30 yrs
- 0.22%
- Est. flood insurance / yr
- $507 – $1,088
Fire risk 1/10 · Minimal
- Est. fire insurance / yr
- $947 – $1,759
Heat risk 10/10 · Severe
- Hot days now (above 106°F)
- 7 days/yr
- Hot days in 30 yrs
- 31 days/yr
Wind risk 10/10 · Severe
- Chance of severe wind over 30 yrs
- 99.0%
Air-quality risk 3/10 · Minor
- Unhealthy air days now
- 2 days/yr
- Unhealthy air days in 30 yrs
- 2 days/yr
Risk factors via First Street. Map © Google.
Why this score? — see what drove the F grade
The composite is a weighted blend of 9 inputs, each scored 0–100. Each bar is that input's sub-score; the figure is the points it added to the 100-point composite (weight × sub-score).
- Cash flow +13.1/30.0
- Schools +4.4/10.0
- Livability +4.0/5.0
- DSCR +3.9/10.0
- 1% rule +2.7/10.0
- Condition / age +2.5/5.0
- Rent growth +2.4/5.0
- ARV discount +0.2/15.0
- Appreciation +0.0/10.0
$259,900
🖨 Deal sheet 📄 Offer letter ✓ Due diligence
Listing remarks
Under contract-accepting backup offers. Priced to Sell! This inviting 2-bedroom, 1-bath, with large den/bonus room home in West Bradenton features a NEW ROOF completed in November 2025, providing added peace of mind for years to come. The home offers a functional layout with key updates including a newer water heater, updated electrical panel, and regularly serviced HVAC system. Enjoy relaxed Florida living with a screened-in carport, a cozy stone fireplace, and a bright, sun-filled Florida room that flows out to a private rear patio and a large, fully fenced backyard, ideal for outdoor living and entertaining. Conveniently located just minutes from grocery stores, shopping, dining, schools
Key facts
- Florida room
- Newer water heater
- Screened-in carport
Tags
Property features AI
Finance
- Other: Zoning: RSF6; Total acreage: under 1/4 acre
- HOA & community: No association fees
Exterior
- Parking: Driveway; 1-car carport
- Utilities: Public water; Public sewer; Cable connected; Electricity connected; Water connected
- Home design: Single-family residence; One story; Home faces west; Homestead property
- Construction: Block construction; Shingle roof; Block and slab foundation; Built on one level
- Exterior features: Covered screened patio/porch; Awnings; Vinyl fencing; Cleared lot; Sidewalks; Paved surfaces; Asphalt road access
Interior
- Kitchen: Range; Refrigerator; Exhaust fan
- Bedrooms: 2 bedrooms
- Bathrooms: 1 full bathroom
- Heating & cooling: Central heating; Central air conditioning
- Interior features: Ceiling fans; Open floorplan; Living room and dining room combo; Family room fireplace
- Laundry & utility: Laundry room; Dryer
Neighborhood map
What this means for you Summary
Snapshot
- This is a 2-bed/1.0-bath single-family listed at $260k.
Deal economics
- At list price, monthly cash flow is $-11 ($-134/yr) — negative.
- To cash-flow at today's rent, offer at most $258k (0.8% below list).
- To meet the 1% rule (rent ≥ 1% of price), the offer needs to be $199k (23.4% below list).
- Recommended offer: $199k (23.4% below list) — sets the bar for 1% rule.
- Cap rate 6.2% vs local median 3.6% in Bradenton — top-decile yield for the area; either an underpriced asset or a hidden risk that comps aren't pricing in. Stress-test before assuming the spread holds.
Location & tenants
- Location reads 81/100 on livability (#101 in FL, #1,528 nationally) — a professional / high-income tenant draw. Strengths: commute A+, cost of living A+, housing A+; Watch: employment D+, crime D, amenities F.
- Manatee (suburban): math 54% / reading 50% proficiency, ranked #26 of 73 in FL (top 36%) — acceptable for families but not a draw, mixed tenant base, ~2y average lease.
- Zoned schools: H. S. Moody Elementary School (math 39% / reading 24%, grade F, #1,841 of 2,144 statewide, top 86%, 606 students, 73% FRL); Bayshore High School (math 17% / reading 26%, grade F, #546 of 667 statewide, top 82%, 1,435 students, 65% FRL) — zoned schools average 69% FRL vs 51% district-wide (18 pts higher); higher-poverty schools than district average — tighter screening recommended.
- Zoned-school proficiency averages 26% at this address vs 52% district-wide (-26 pts) — the specific schools serving this property underperform the Manatee average; the district grade overstates school quality for this exact location.
- Market conditions: Rents soft (-0.3%/yr); 510 active listings in the ZIP; 40 comparable units currently listed for rent nearby; rentals at typical pace (median 15d on market — plan ~3-4 weeks tenant-placement turnaround); solid renter incomes; 7,472 units permitted in Manatee County in 2024 (1,782 in 5+ unit buildings).
Forward outlook
- Local home prices are declining (-3.0%/yr); year-one equity from $2k of loan paydown is wiped out by about $8k of value loss. Plan a longer hold.
- Manatee County population projected at +43% by 2050 — long-run rental-demand tailwind backs the buy-and-hold thesis.
Negotiation context
- Only 13 days on market — expect competitive offers; lowballing is unlikely to land.
- 6 sale attempts since 2y ago with the ask held roughly flat each time — persistent listings suggest the price (not the market) is what's stuck; bring a comps-based counter.
- Current owner paid $87k; list at $260k implies a 199% gain — meaningful room to come down on a strong offer.
Risks & watch-outs
- Climate carrying-cost: severe wind risk, 99% chance of damaging wind over 30y; extreme-heat days projected 7→31/yr by 2055 (HVAC capex compounding) — expect insurance premiums to compound above CPI over the hold.
Questions for the listing agent
- What do current leases actually rent for vs. the listed asking? Can we see a recent rent roll and the last 12 months of T-12 income?
- Built in 1961 — when were the roof, HVAC, electrical panel, plumbing, and water heater last replaced?
- Is there a deadline driving the sale (1031 exchange, divorce, estate, relocation)? That informs how much negotiation room exists.
- Crime grade is D in this area — have there been break-ins, vandalism, or insurance claims at this property in the last 3 years? What carrier currently insures it and at what premium?
- The area grade is low — what's the realistic commute time and amenity access for the typical tenant pool here? Any planned neighborhood developments (good or bad) we should know about?
- What's the average days-on-market for RENTAL listings here right now (not sales)? A rising rental-DOM trend means longer vacancies and softer asking-rent achievability than the comps imply.
- What's the recent tenant-quality profile in this submarket — average credit score on applications, eviction rate, late-payment / NSF rate, and stable-employment percentage? A property-management company in the area should have these aggregated.
- How much new for-sale + rental construction is in the pipeline within 1–3 miles? Heavy new supply typically softens prices + rents 12–24 months out; constrained supply supports both.
Investment metrics
- 1% rule
- 0.77% ✗
- Cap rate
- 6.24%
- Cash-on-cash
- -0.18%
- DSCR
- 0.99
- GRM
- 10.9
CMA / ARV
- ARV (on-the-fly)
- $223,733
- Comps found
- 12
Show comp detail 12 sales within ~0.75 mi
| Address | Dist | Beds/Ba | Sqft | Sold | Price | $/sf | Match |
|---|---|---|---|---|---|---|---|
| 4015 52nd Street Ct W | 0.00mi | 2/1.0 | 1,097 (+12%) | 0mo | $255,000 | $232 | 79 |
| 5303 40th Ave W | 0.07mi | 2/2.0 | 927 (-5%) | 9mo | $230,000 | $248 | 77 |
| 5903 36th Avenue Cir W | 0.52mi | 2/2.0 | 937 (-4%) | 3mo | $215,000 | $229 | 63 |
| 6104 39th Ave W | 0.56mi | 2/2.0 | 937 (-4%) | 3mo | $202,500 | $216 | 60 |
| 4528 58th St W | 0.58mi | 2/2.0 | 994 (+2%) | 11mo | $310,000 | $312 | 57 |
| 3912 41st St | 0.67mi | 2/2.0 | 965 (-1%) | 10mo | $214,000 | $222 | 55 |
| 3605 60th St W | 0.52mi | 2/2.0 | 1,028 (+5%) | 12mo | $190,000 | $185 | 53 |
| 5901 36th Avenue Cir W | 0.50mi | 2/2.0 | 1,028 (+5%) | 20mo | $219,000 | $213 | 48 |
| 4504 57th St W | 0.48mi | 2/1.0 | 884 (-10%) | 18mo | $320,000 | $362 | 47 |
| 4211 35th Ave W | 0.73mi | 2/2.0 | 1,015 (+4%) | 20mo | $207,000 | $204 | 39 |
| 3906 40th St W | 0.73mi | 2/2.0 | 1,050 (+8%) | 13mo | $260,000 | $248 | 38 |
| 3703 39th St W | 0.73mi | 2/2.0 | 1,050 (+8%) | 14mo | $155,000 | $148 | 38 |
Match score weights: distance 35% · size 25% · config 20% · recency 20%. Top-matched comps best support the ARV.
Projected returns pro-forma
-3.0% appreciation · 0.0% rent growth · sell at horizon
- IRR
- -19.7%
- Equity multiple
- 0.33×
- Total profit
- $-48,764
- Equity at exit
- $38,752
- IRR
- -19.5%
- Equity multiple
- 0.09×
- Total profit
- $-66,344
- Equity at exit
- $22,471
Cash invested: $72,772 (down + closing). Projections, not guarantees.
Landlord ↔ Tenant lean methodology
- Overall (STATE)
- 87 Strongly Landlord-Friendly
- State Florida
- 87 Strongly Landlord-Friendly · R+3
- County
- — inherits STATE
- City
- — inherits STATE
ZIP-level market 34209
- Rents YoY
- -0.3%
- Active inventory
- 510
- Price-to-rent
- 10.9×
Monthly cashflow live
- Estimated rent
- $1,992 high interval (Pro) →
- Mortgage (P&I)
- −$1,363
- Tax from tax record
- −$114 /mo · $1,363/yr
- Insurance
- −$108
- HOA
- −$0
- Vacancy / Maint / Mgmt
- −$418
- Net cashflow
- $-11
Break-even live
UW: 25.0% down · 7.5% · 30yr · 1.5% tax · 5.0% vac · 8.0% maint · 8.0% mgmt
Financing live
Cash to close
- Down payment
- $64,975
- Closing costs
- $7,797
- Reserves months
- —
- Total cash needed
- —
Loan-product check · same deal, 3 products live
Conventional
25% down · 7.5% · 30yr
- Down + closing
- —
- Monthly P&I
- —
- Monthly cashflow
- —
- DSCR
- —
- Eligible?
- —
Personal DTI + credit; lowest rate.
DSCR
20% down · 8.5% · 30yr
- Down + closing
- —
- Monthly P&I
- —
- Monthly cashflow
- —
- DSCR
- —
- Eligible?
- —
No personal income docs; deal must DSCR.
Hard money
10% down · 12.0% · 12mo
- Down + closing
- —
- Monthly P&I
- —
- Monthly cashflow
- —
- DSCR
- —
- Eligible?
- —
Short-term bridge; refi at stabilization.
Rent comps 40 comps
| Address | Beds | Baths | Sqft | Rent | $/sqft | DOM | Units | Dist |
|---|---|---|---|---|---|---|---|---|
| 4210 Ironwood Cir Unit 103J Bradenton, FL | 1.0 | 1.0 | 750 | $1,800 | $2.40 | 23d | 1 | 0.13mi |
| 4040 Ironwood Cir Unit 406F Bradenton, FL | 2.0 | 2.0 | 1008 | $1,675 | $1.66 | 15d | 1 | 0.21mi |
| 4040 Ironwood Cir Unit 404F Bradenton, FL | 2.0 | 2.0 | 1008 | $1,750 | $1.74 | 11d | 1 | 0.21mi |
| 4460 Ironwood Cir Unit 501A Bradenton, FL | 1.0 | 1.5 | 840 | $2,595 | $3.09 | 23d | 1 | 0.24mi |
| 4460 Ironwood Cir Unit 406 Bradenton, FL | 1.0 | 1.0 | 750 | $1,600 | $2.13 | 21d | 1 | 0.24mi |
| 4460 Ironwood Cir Unit 406 Bradenton, FL | 1.0 | 1.0 | 750 | $1,600 | $2.13 | 1d | 1 | 0.24mi |
| 4240 Ironwood Cir #404 Bradenton, FL | 2.0 | 2.0 | 1008 | $2,495 | $2.48 | 23d | 1 | 0.28mi |
| 4480 Ironwood Cir Unit 309 Bradenton, FL | 1.0 | 1.0 | 600 | $1,800 | $3.00 | 23d | 1 | 0.28mi |
| 4480 Ironwood Cir Unit 213A Bradenton, FL | 1.0 | 1.0 | 600 | $1,425 | $2.38 | 14d | 1 | 0.29mi |
| 4118 59th St W Bradenton, FL | 2.0 | 1.0 | 756 | $1,800 | $2.38 | 15d | 1 | 0.41mi |
| 4802 51st St W Bradenton, FL | 1.0–2.0 | 1.0–2.0 | 1007 | $1,950 | $1.94 | 15d | 15 | 0.43mi |
| 4802 51st St W Bradenton, FL | 1.0–2.0 | 1.0–2.0 | 1007 | $1,950 | $1.94 | 3d | 13 | 0.43mi |
| 4550 47th St W Bradenton, FL | 1.0–3.0 | 1.0–2.0 | 930 | $1,800 | $1.94 | 1d | 27 | 0.44mi |
| 4850 51st St W Bradenton, FL | 1.0–2.0 | 1.0–2.0 | 800 | $1,750 | $2.19 | 3d | 2 | 0.47mi |
| 4850 51st St W Bradenton, FL | 1.0–2.0 | 1.0–2.0 | 800 | $1,750 | $2.19 | 14d | 3 | 0.47mi |
| 5907 36th Ave Cir W #5907 Bradenton, FL | 2.0 | 2.0 | 937 | $2,800 | $2.99 | 23d | 1 | 0.50mi |
| 4457 45th Ave W #211 Bradenton, FL | 2.0 | 2.0 | 912 | $1,950 | $2.14 | 15d | 1 | 0.58mi |
| 4801 47th Ave W Bradenton, FL | 1.0–3.0 | 1.0–2.0 | 1016 | $1,810 | $1.78 | 1d | 32 | 0.60mi |
| 4116 62nd St W Bradenton, FL | 2.0 | 2.0 | 840 | $1,650 | $1.96 | 3d | 1 | 0.61mi |
| 4880 51st St W Bradenton, FL | 1.0–4.0 | 1.0–3.0 | 1019 | $1,527 | $1.50 | 3d | 11 | 0.62mi |
| 5909 30th Ave W Bradenton, FL | 1.0–2.0 | 1.0–2.0 | 788 | $1,670 | $2.12 | 1d | 6 | 0.71mi |
| 4112 66th Street Cir W Bradenton, FL | 2.0 | 2.0 | 1100 | $1,960 | $1.78 | 19d | 1 | 0.75mi |
| 4449 46th Ave W Unit 4449 Bradenton, FL | 2.0 | 1.0 | 1110 | $3,200 | $2.88 | 23d | 1 | 0.75mi |
| 4325 40th St W Bradenton, FL | 1.0–2.0 | 1.0–2.0 | 775 | $1,675 | $2.16 | 10d | 9 | 0.76mi |
| 4601 66th St W Bradenton, FL | 3.0 | 1.0–2.0 | 917 | $2,065 | $2.25 | 1d | 24 | 0.81mi |
| 4161 66th Street Cir W Bradenton, FL | 2.0 | 2.0 | 1044 | $1,800 | $1.72 | 15d | 1 | 0.82mi |
| 4209 66th Street Cir W Bradenton, FL | 2.0 | 2.0 | 1044 | $2,900 | $2.78 | 23d | 1 | 0.82mi |
| 5933 28th Ave W Bradenton, FL | 1.0–2.0 | 1.0–2.0 | 945 | $2,013 | $2.13 | 1d | 6 | 0.93mi |
| 2926 63rd St W Bradenton, FL | 2.0 | 2.0 | 946 | $2,100 | $2.22 | 3d | 1 | 0.94mi |
| 2903 63rd St W Bradenton, FL | 1.0 | 1.0 | 693 | $2,000 | $2.89 | 3d | 1 | 0.94mi |
| 6711 45th Ave W Unit A Bradenton, FL | 2.0 | 2.0 | 1100 | $1,700 | $1.55 | 15d | 1 | 1.02mi |
| 586 Lakeside Dr Unit 586 Bradenton, FL | 2.0 | 2.0 | 940 | $3,200 | $3.40 | 23d | 1 | 1.11mi |
| 4501 71st St W Bradenton, FL | 1.0–2.0 | 1.0–2.0 | 850 | $1,680 | $1.98 | 1d | 28 | 1.17mi |
| 6304 Pointe West Blvd Unit A309 Bradenton, FL | 2.0 | 2.0 | 1042 | $1,795 | $1.72 | 10d | 1 | 1.24mi |
| 184 Pineneedle Dr Bradenton, FL | 2.0 | 2.0 | 940 | $2,100 | $2.23 | 23d | 1 | 1.26mi |
| 206 Lakewood Dr Unit 206 Bradenton, FL | 2.0 | 2.0 | 940 | $2,700 | $2.87 | 23d | 1 | 1.28mi |
| 6415 21st Ave W Bradenton, FL | 1.0–2.0 | 1.0–2.0 | 1150 | $1,896 | $1.65 | 3d | 5 | 1.29mi |
| 4148 53rd Ave W Bradenton, FL | 1.0–3.0 | 1.0–2.0 | 989 | $2,550 | $2.58 | 1d | 1 | 1.44mi |
| 4148 53rd Ave W Unit 1210 Bradenton, FL | 2.0 | 2.0 | 1071 | $1,932 | $1.80 | 3d | 1 | 1.44mi |
| 4148 53rd Ave W Unit 0314 Bradenton, FL | 2.0 | 2.0 | 1071 | $1,967 | $1.84 | 23d | 1 | 1.44mi |
Listing history 16 events
-
2026-05-22status Pending
-
2026-05-09$259,900 Active
-
2025-10-25historical
-
2025-10-15price $274,900
-
2025-09-24status Active
-
2025-09-17status Pending
-
2025-08-21price $269,900
-
2025-06-05price $279,900
-
2025-04-07$289,900 Active
-
2025-01-01historical
-
2024-12-13price $299,000
-
2024-07-13status Active
-
2024-07-11status Active
-
2024-07-03status Pending
-
2024-06-30$299,900 Active
-
2002-08-02soldstatus $86,900
ⓘ Source: listings_history table (triggers on properties + properties_extension) + one-shot
backfill from property_details.listing_events for pre-trigger history.
Tax reassessment forecast FL · Resets to sale price
- Current annual tax
- $1,363 · $114/mo
- Projected year-2 tax
- $2,157 · $180/mo
- Expected delta
- +$794/yr (+$66/mo · 58.3%)
ⓘ Screening estimate from a state-policy table — verify with the county assessor before closing.
Climate risk First Street
- Flood 4/10 Moderate FEMA zone X (unshaded) · 22% chance over 30 yrs
- Wildfire 1/10 Low
- Heat 10/10 Extreme 7 d/yr ≥106°F today · 31 d/yr by 30 yrs out
- Wind 10/10 Extreme 99% chance of damaging wind over 30 yrs
- Air quality 3/10 Moderate 2 unhealthy d/yr today · 2 by 30 yrs out
Nearby sold comps map
Loading sold comps map…
Walkable amenities ~0.75 mi
Loading nearby amenities…
Taxation est. · year 1
- Rental income
- $23,904
- − Mortgage interest
- −$14,558
- − Property taxes
- −$1,363
- − Insurance
- −$1,300
- − Repairs & maintenance
- −$1,912
- − Management
- −$1,912
- − Depreciation
- −$7,561
- Taxable loss
- −$4,703
- Est. tax savings @ 24.0%
- +$1,129
- After-tax cash flow
- $995/yr
For passive investors: Depreciation is non-cash, so a rental often shows a tax loss while cash-flowing — sheltering income. Rental losses are passive: they offset passive income freely, and up to $25,000/yr can offset ordinary (W-2) income if you actively participate and your MAGI is under $100k (phasing out to $0 by $150k); unused losses carry forward. On sale, claimed depreciation is recaptured at up to 25%, and gains may owe capital-gains tax (a 1031 exchange can defer both). Figures are a year-1 estimate at your 24.0% rate — not tax advice; consult a CPA.
Schools (NCES district)
- District
- Manatee
- NCES district ID
- 1201230
- Math proficiency
- 54% ▼ -6.00%
- Reading proficiency
- 50% ▼ -2.00%
- Median HH income
- $49,607
- Composite
- 44.43/100
- National rank
- #2806
- State rank
- #26 of 73 in FL
Livability — Bradenton
- Score
- 81/100
- State rank
- #101
- US rank
- #1528
Category grades
Schools grade is shown separately in the Schools card above.
Census & demographics
- County
- Manatee County · 416,364 people
- City population
- 227,091
- Metro
- North Port-Sarasota-Bradenton, FL
- Population (ZIP)
- 33,224
- Household income
- $81,728
- Rent vs Own
- Severe rent burden
- 1126.0
Population outlook (Manatee County) Hauer SSP2
- Today (2025)
- 447,342 people
- By 2030
- 488,911 · +9.3%
- By 2040
- 567,934 · +27.0%
- By 2050
- 637,995 · +42.6%
- By 2075
- 781,970 · +74.8%
- By 2100
- 848,272 · +89.6%
Race, ethnicity, and origin ACS 2023
- Neighborhood character
- Predominantly White (84%)
- Race & ethnicity
- White 84% Hispanic / Latino 11% Two or more races 6% Black 2% Asian 1%
- Hispanic origin (detail)
- Puerto Rican 4% Cuban 3%
- Common ancestry
- Romanian 3% Slovak 3% Lithuanian 3%
- Foreign-born
- 9% · Canada, Jamaica, China
- Languages at home
- 90% English-only · Spanish 6% Russian/Polish/Slavic 1% Other Indo-European 1%
Political lean MEDSL · Manatee
- 2024 margin
- Strong R (+23.5) · D 37.9% · R 61.4%
- 2008→2024 swing
- -16.5pp toward R · 2008: -7.0pp · 2024: -23.5pp
- All cycles
- 2024: R+23.5 2020: R+16.1 2016: R+17.1 2012: R+12.5 2008: R+7.0
Not yet ingested
- Civics
- —
Market trends
- HPI YoY
- ▼ -360.34%
- Current HPI
- 320.0061
- Rent YoY
- ▼ -0.30%
- Metro
- North Port-Sarasota-Bradenton, FL
- State GDP YoY
- ▲ 3.28%
- F500 in state
- 36
Industry mix (Fortune 500 HQ in FL)
| Industry | F500 HQs | Revenue |
|---|---|---|
| Industrial Technology | 2 | $29B |
|
||
| Insurance | 2 | $17B |
|
||
| Retail | 1 | $60B |
|
||
| Technology Distribution | 1 | $58B |
|
||
| Homebuilding | 1 | $35B |
|
||
| Technology Manufacturing | 1 | $35B |
|
||
Price history
+199.1% since first listed16 events — show timeline
- 2026-05-22 Pending — Stellar MLS as Distributed by MLS Grid
- 2026-05-09 Listed $259,900 Stellar MLS as Distributed by MLS Grid
- 2025-10-25 Listing Removed — Stellar MLS as Distributed by MLS Grid
- 2025-10-15 Price Changed $274,900 Stellar MLS as Distributed by MLS Grid
- 2025-09-24 Relisted — Stellar MLS as Distributed by MLS Grid
- 2025-09-17 Pending — Stellar MLS as Distributed by MLS Grid
- 2025-08-21 Price Changed $269,900 Stellar MLS as Distributed by MLS Grid
- 2025-06-05 Price Changed $279,900 Stellar MLS as Distributed by MLS Grid
- 2025-04-07 Listed $289,900 Stellar MLS as Distributed by MLS Grid
- 2025-01-01 Listing Removed — Stellar MLS as Distributed by MLS Grid
- 2024-12-13 Price Changed $299,000 Stellar MLS as Distributed by MLS Grid
- 2024-07-13 Relisted — Stellar MLS as Distributed by MLS Grid
- 2024-07-11 Relisted — Stellar MLS as Distributed by MLS Grid
- 2024-07-03 Pending — Stellar MLS as Distributed by MLS Grid
- 2024-06-30 Listed $299,900 Stellar MLS as Distributed by MLS Grid
- 2002-08-02 Sold (Public Records) $86,900 Public Records
Property tax history
+6.4%/yrLatest (2025): $1,363 · +4.8% YoY. Source: county tax records.
Cash-flow waterfall
monthlySold comps — $/sqft
last 12 mo · ≤1 miLoading sold comps…