3700 Haywaters Rd · Cutchogue, NY
Flood risk 1/10 · Minimal
- FEMA flood zone
- X (unshaded)
- Chance of flooding over 30 yrs
- 0.0%
- Est. flood insurance / yr
- $473 – $860
Fire risk 1/10 · Minimal
- Est. fire insurance / yr
- $691 – $1,283
Heat risk 5/10 · Moderate
- Hot days now (above 90°F)
- 7 days/yr
- Hot days in 30 yrs
- 19 days/yr
Wind risk 8/10 · Major
- Chance of severe wind over 30 yrs
- 80.0%
Air-quality risk 3/10 · Minor
- Unhealthy air days now
- 2 days/yr
- Unhealthy air days in 30 yrs
- 3 days/yr
Risk factors via First Street. Map © Google.
Why this score? — see what drove the A- grade
The composite is a weighted blend of 9 inputs, each scored 0–100. Each bar is that input's sub-score; the figure is the points it added to the 100-point composite (weight × sub-score).
- Cash flow +30.0/30.0
- ARV discount +10.5/15.0
- 1% rule +10.0/10.0
- DSCR +10.0/10.0
- Appreciation +10.0/10.0
- Schools +6.1/10.0
- Livability +3.1/5.0
- Rent growth +2.5/5.0
- Condition / age +2.5/5.0
$1,250,000
🖨 Deal sheet 📄 Offer letter ✓ Due diligence
Listing remarks
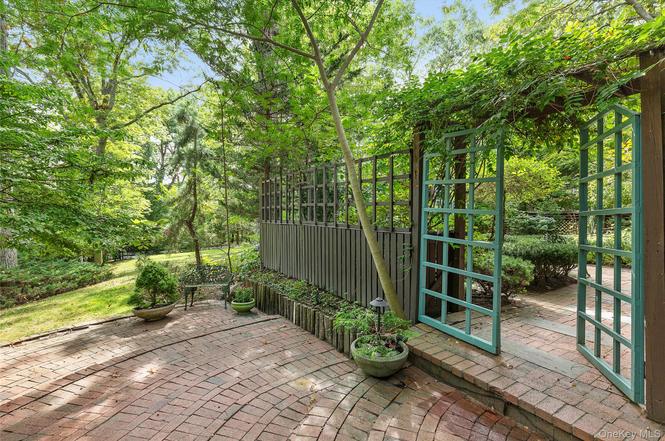
"A Peaceful Retreat Among the Trees. " Designed to embrace its natural surroundings, this four-bedroom, two-and-a-half-bath upside-down home offers a bright and inviting second-floor living area with kitchen and open-concept design. Large windows fill the space with beautiful natural light and frame views of the surrounding trees and gardens. The property features multiple private outdoor seating areas, a heated pool, and a deeded beach for easy access to the water. With its peaceful setting and thoughtful landscaping, this home offers the rare feeling of living among the trees—an ideal retreat for nature lovers.
Key facts
- Deeded beach
- Heated pool
- 0.41 acre lot
Tags
Neighborhood map
What this means for you Summary
Snapshot
- This is a 4-bed/2.5-bath single-family listed at $1.25M.
Deal economics
- At list price, monthly cash flow is $8k ($102k/yr) — positive.
- The deal already cash-flows at list — no discount required.
- Meets the 1% rule at list price ($21k rent vs $1.25M).
- Recommended offer: $1.10M (12.0% below list) — sets the bar for market timing.
- Cap rate 14.4% vs local median 7.5% in Cutchogue — top-decile yield for the area; either an underpriced asset or a hidden risk that comps aren't pricing in. Stress-test before assuming the spread holds.
Location & tenants
- Location reads 62/100 on livability (#843 in NY) — a middle-class / working-renter tenant base. Strengths: crime A+, employment A+, housing B+; Watch: amenities F, commute F, cost of living F.
- Mattituck-Cutchogue Union Free School District (suburban): math 69% / reading 68% proficiency, ranked #127 of 590 in NY (top 22%) — acceptable for families but not a draw, mixed tenant base, ~2y average lease; only 16% free/reduced lunch — higher-income household profile.
- Zoned schools: Mattituck-Cutchogue Elementary School (math 65% / reading 68%, grade B+, #575 of 2,108 statewide, top 27%, 453 students, 37% FRL); Mattituck Junior-Senior High School (math 74% / reading 72%, grade B+, #670 of 1,100 statewide, top 61%, 548 students, 0% FRL) — zoned schools at 18% FRL track the district average.
- Market conditions: 50 active listings in the ZIP; 2 comparable units currently listed for rent nearby; 1,366 units permitted in Suffolk County in 2024 (216 in 5+ unit buildings).
Forward outlook
- In year one you build about $134k of equity ($9k loan paydown + $125k appreciation (10.0% local appreciation)).
- Suffolk County population projected to shrink 5% by 2050 — rents likely to lag national; underwrite the cash flow, not the appreciation.
- At projected returns (10.0% appreciation + 3.0% rent growth), your $350k cash investment doubles in ~2 years — after that, you're playing with house money.
- By year 2, paydown + projected appreciation supports a ~$215k cash-out refi (75% LTV) — recoverable capital for the next deal without selling this one.
Negotiation context
- It's been on market 178 days — a 12% lower offer ($1.10M) is reasonable based on typical stale-listing flexibility.
- 2 sale attempts with the ask held roughly flat each time — persistent listings suggest the price (not the market) is what's stuck; bring a comps-based counter.
Risks & watch-outs
- Climate carrying-cost: severe wind risk, 80% chance of damaging wind over 30y; extreme-heat days projected 7→19/yr by 2055 (HVAC capex compounding) — expect insurance premiums to compound above CPI over the hold.
Questions for the listing agent
- It's been on market 178 days. Have you received any prior offers? Is the seller open to a 12% concession, seller financing, or rate buy-down credit?
- Built in 1973 — when were the roof, HVAC, electrical panel, plumbing, and water heater last replaced?
- Why hasn't it sold? Are there any deal-killer items the seller is aware of (foundation, flood, title, zoning, code violations)?
- Is there a deadline driving the sale (1031 exchange, divorce, estate, relocation)? That informs how much negotiation room exists.
- Schools are B-rated — typically a magnet for longer-tenancy family renters. What's the average tenant stay here, and is there a school-zone premium baked into asking?
- What's the average days-on-market for RENTAL listings here right now (not sales)? A rising rental-DOM trend means longer vacancies and softer asking-rent achievability than the comps imply.
- What's the recent tenant-quality profile in this submarket — average credit score on applications, eviction rate, late-payment / NSF rate, and stable-employment percentage? A property-management company in the area should have these aggregated.
- How much new for-sale + rental construction is in the pipeline within 1–3 miles? Heavy new supply typically softens prices + rents 12–24 months out; constrained supply supports both.
Investment metrics
- 1% rule
- 1.68% ✓
- Cap rate
- 14.44%
- Cash-on-cash
- 29.09%
- DSCR
- 2.29
- GRM
- 5.0
CMA / ARV
- ARV (on-the-fly)
- $1,339,200
- Comps found
- 5
Show comp detail 5 sales within ~0.75 mi
| Address | Dist | Beds/Ba | Sqft | Sold | Price | $/sf | Match |
|---|---|---|---|---|---|---|---|
| 2550 Haywaters Rd | 0.22mi | 3/3.5 (-1) | 2,510 (+5%) | 17mo | $1,400,000 | $558 | 59 |
| 4000 Wunneweta Rd | 0.16mi | 3/4.0 (-1) | 2,300 (-4%) | 22mo | $2,400,000 | $1,043 | 56 |
| 2090 Wunneweta Rd | 0.36mi | 4/2.5 | 2,162 (-10%) | 14mo | $999,999 | $463 | 56 |
| 4030 Nassau Point Rd | 0.37mi | 3/3.0 (-1) | 2,556 (+6%) | 21mo | $1,299,000 | $508 | 48 |
| 380 W Cove Rd | 0.57mi | 4/3.0 | 2,498 (+4%) | 24mo | $1,500,000 | $600 | 45 |
Match score weights: distance 35% · size 25% · config 20% · recency 20%. Top-matched comps best support the ARV.
Projected returns pro-forma
10.0% appreciation · 3.0% rent growth · sell at horizon
- IRR
- 46.3%
- Equity multiple
- 4.49×
- Total profit
- $1,221,123
- Equity at exit
- $1,126,099
- IRR
- 40.2%
- Equity multiple
- 10.06×
- Total profit
- $3,171,022
- Equity at exit
- $2,428,475
Cash invested: $350,000 (down + closing). Projections, not guarantees.
Landlord ↔ Tenant lean methodology
- Overall (STATE)
- 15 Strongly Tenant-Friendly
- State New York
- 15 Strongly Tenant-Friendly · D+10
- County
- — inherits STATE
- City
- — inherits STATE
ZIP-level market 11935
- Home prices YoY
- 2.8%
- Active inventory
- 50
- Price-to-rent
- 5.0×
Monthly cashflow live
- Estimated rent
- $20,974 medium interval (Pro) →
- Mortgage (P&I)
- −$6,555
- Tax from tax record
- −$1,010 /mo · $12,116/yr
- Insurance
- −$521
- HOA
- −$0
- Vacancy / Maint / Mgmt
- −$4,405
- Net cashflow
- $8,484
Break-even live
UW: 25.0% down · 7.5% · 30yr · 1.5% tax · 5.0% vac · 8.0% maint · 8.0% mgmt
Financing live
Cash to close
- Down payment
- $312,500
- Closing costs
- $37,500
- Reserves months
- —
- Total cash needed
- —
Loan-product check · same deal, 3 products live
Conventional
25% down · 7.5% · 30yr
- Down + closing
- —
- Monthly P&I
- —
- Monthly cashflow
- —
- DSCR
- —
- Eligible?
- —
Personal DTI + credit; lowest rate.
DSCR
20% down · 8.5% · 30yr
- Down + closing
- —
- Monthly P&I
- —
- Monthly cashflow
- —
- DSCR
- —
- Eligible?
- —
No personal income docs; deal must DSCR.
Hard money
10% down · 12.0% · 12mo
- Down + closing
- —
- Monthly P&I
- —
- Monthly cashflow
- —
- DSCR
- —
- Eligible?
- —
Short-term bridge; refi at stabilization.
Rent comps 2 comps
| Address | Beds | Baths | Sqft | Rent | $/sqft | DOM | Units | Dist |
|---|---|---|---|---|---|---|---|---|
| 1600 Pine Tree Rd Cutchogue, NY | 3.0 | 2.0 | 2012 | $10,000 | $4.97 | 44d | 1 | 1.36mi |
| 250 Pine Tree Ct Cutchogue, NY | 4.0 | 3.5 | 2800 | $32,500 | $11.61 | 44d | 1 | 1.46mi |
Listing history 4 events
-
2026-04-09status Pending
-
2026-04-09status Active
-
2026-04-09status Pending
-
2025-10-13$1,250,000 Active
ⓘ Source: listings_history table (triggers on properties + properties_extension) + one-shot
backfill from property_details.listing_events for pre-trigger history.
Tax reassessment forecast NY · Partial reset (capped growth)
- Current annual tax
- $12,116 · $1,010/mo
- Projected year-2 tax
- $16,620 · $1,385/mo
- Expected delta
- +$4,505/yr (+$375/mo · 37.2%)
ⓘ Screening estimate from a state-policy table — verify with the county assessor before closing.
Climate risk First Street
- Flood 1/10 Low FEMA zone X (unshaded) · 0% chance over 30 yrs
- Wildfire 1/10 Low
- Heat 5/10 Major 7 d/yr ≥90°F today · 19 d/yr by 30 yrs out
- Wind 8/10 Severe 80% chance of damaging wind over 30 yrs
- Air quality 3/10 Moderate 2 unhealthy d/yr today · 3 by 30 yrs out
Nearby sold comps map
Loading sold comps map…
Walkable amenities ~0.75 mi
Loading nearby amenities…
Taxation est. · year 1
- Rental income
- $251,694
- − Mortgage interest
- −$70,019
- − Property taxes
- −$12,116
- − Insurance
- −$6,250
- − Repairs & maintenance
- −$20,135
- − Management
- −$20,135
- − Depreciation
- −$36,364
- Taxable income
- $86,674
- Est. tax owed @ 24.0%
- −$20,802
- After-tax cash flow
- $81,009/yr
For passive investors: Depreciation is non-cash, so a rental often shows a tax loss while cash-flowing — sheltering income. Rental losses are passive: they offset passive income freely, and up to $25,000/yr can offset ordinary (W-2) income if you actively participate and your MAGI is under $100k (phasing out to $0 by $150k); unused losses carry forward. On sale, claimed depreciation is recaptured at up to 25%, and gains may owe capital-gains tax (a 1031 exchange can defer both). Figures are a year-1 estimate at your 24.0% rate — not tax advice; consult a CPA.
Schools (NCES district)
- District
- Mattituck-Cutchogue Union Free School District
- NCES district ID
- 3600021
- Math proficiency
- 69% ▼ -3.00%
- Reading proficiency
- 68% ▲ 4.00%
- Median HH income
- $84,164
- Composite
- 61.4/100
- National rank
- #765
- State rank
- #127 of 590 in NY
Livability — Cutchogue
- Score
- 62/100
- State rank
- #843
- US rank
- #16353
Category grades
Schools grade is shown separately in the Schools card above.
Census & demographics
- Census place
- Cutchogue, NY
- City population
- 2,946
- Population (ZIP)
- 2,946
Population outlook (Suffolk County) Hauer SSP2
- Today (2025)
- 1,505,262 people
- By 2030
- 1,498,318 · -0.5%
- By 2040
- 1,471,101 · -2.3%
- By 2050
- 1,424,848 · -5.3%
- By 2075
- 1,337,157 · -11.2%
- By 2100
- 1,217,720 · -19.1%
Race, ethnicity, and origin ACS 2023
- Neighborhood character
- Predominantly White (92%)
- Race & ethnicity
- White 92% Two or more races 6% Hispanic / Latino 6%
- Hispanic origin (detail)
- Puerto Rican 2% Cuban 1%
- Common ancestry
- Romanian 10% Scotch-Irish 1% Lithuanian 1%
- Foreign-born
- 9% · Canada, China
- Languages at home
- 87% English-only · Other Indo-European 5% German/W. Germanic 3% Spanish 3%
Political lean MEDSL · Suffolk
- 2024 margin
- Lean R (+10.0) · D 45.0% · R 55.0%
- 2008→2024 swing
- -16.0pp toward R · 2008: 6.0pp · 2024: -10.0pp
- All cycles
- 2024: R+10.0 2020: R+0.0 2016: R+8.2 2012: D+2.9 2008: D+6.0
Not yet ingested
- Civics
- —
Market trends
- HPI YoY
- ▲ 12.82%
- Current HPI
- 467.3019
- Rent YoY
- —
- Metro
- —
- State GDP YoY
- ▲ 2.60%
- F500 in state
- 92
Industry mix (Fortune 500 HQ in NY)
| Industry | F500 HQs | Revenue |
|---|---|---|
| Financial Services | 10 | $950B |
|
||
| Consumer Goods | 9 | $162B |
|
||
| Insurance | 4 | $225B |
|
||
| Telecommunications | 2 | $144B |
|
||
| Pharmaceuticals | 2 | $112B |
|
||
| Media / Entertainment | 2 | $69B |
|
||
Price history
4 events — show timeline
- 2026-04-09 Pending — OneKey® MLS as Distributed by MLS Grid
- 2026-04-09 Relisted — OneKey® MLS as Distributed by MLS Grid
- 2026-04-09 Pending — OneKey® MLS as Distributed by MLS Grid
- 2025-10-13 Listed $1,250,000 OneKey® MLS as Distributed by MLS Grid
Property tax history
+2.3%/yrLatest (2025): $12,116 · +0.0% YoY. Source: county tax records.
Cash-flow waterfall
monthlySold comps — $/sqft
last 12 mo · ≤1 miLoading sold comps…