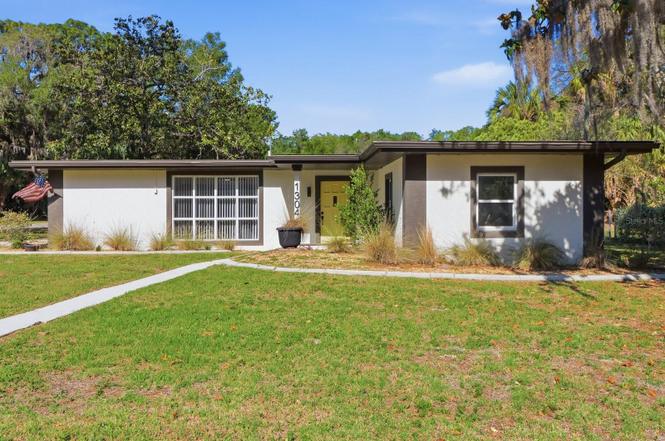
1304 NE 5th Ave · Crystal River, FL
Flood risk 10/10 · Severe
- FEMA flood zone
- AE
- Chance of flooding over 30 yrs
- 0.99%
- Est. flood insurance / yr
- $1,737 – $8,500
Fire risk 4/10 · Minor
- Est. fire insurance / yr
- $947 – $1,759
Heat risk 9/10 · Severe
- Hot days now (above 109°F)
- 7 days/yr
- Hot days in 30 yrs
- 25 days/yr
Wind risk 9/10 · Severe
- Chance of severe wind over 30 yrs
- 99.0%
Air-quality risk 1/10 · Minimal
- Unhealthy air days now
- 0 days/yr
- Unhealthy air days in 30 yrs
- 0 days/yr
Risk factors via First Street. Map © Google.
Why this score? — see what drove the C grade
The composite is a weighted blend of 9 inputs, each scored 0–100. Each bar is that input's sub-score; the figure is the points it added to the 100-point composite (weight × sub-score).
- Cash flow +20.9/30.0
- ARV discount +10.9/15.0
- DSCR +6.6/10.0
- 1% rule +5.6/10.0
- Schools +4.1/10.0
- Livability +3.3/5.0
- Rent growth +2.5/5.0
- Condition / age +2.5/5.0
- Appreciation +0.0/10.0
$219,990
🖨 Deal sheet (PDF) 📄 Offer letter ✓ Due diligence
Listing remarks
Under contract-accepting backup offers. BUYERS AUCTION, HIGHEST AND BEST. AGENTS - PLEASE VIEW REALTOR REMARKS IN THE MLS. Midcentury Modern Gem | Appraised ABOVE List Price! 1304 NE 5th Ave, Crystal River, FL 34428, Experience the perfect marriage of retro soul and modern luxury in this stunning 5-bedroom, 2-bathroom Midcentury Transitional home. Boasting a low-slung, linear profile and a brand-new flat roof with wide architectural eaves, this residence delivers incredible curb appeal and instant equity—it has already appraised for more than the asking price! The Interior: Modernized & Sun-Drenched, Step inside to nearly 2,000 sq. ft. of completely renovated open-concept living
Key facts
- Designer bathrooms
- Premium finishes
- Chef's kitchen
Tags
Property features AI
Finance
- Other: Unfurnished; Owner-provided living area and building area measurements; Home warranty included; Zoned R2; No lease restrictions reported
- HOA & community: No association reported; Pets allowed (cats and dogs OK)
Exterior
- Parking: Driveway; Off-street parking
- Utilities: Public water; Public sewer; Cable available; Broadband/high-speed internet available; Electricity connected; Water connected; Sewer connected
- Home design: Single family residence; Residential property; One story; Northeast facing
- Construction: Block and stucco construction; Membrane roof; Slab foundation; Built area approximately 1,969 (owner provided)
- Exterior features: Patio; Private mailbox; Rain gutters; Chain link fencing; Corner lot; Mature landscaping with oak trees; Paved, public maintained road (75 x 150 lot)
Interior
- Kitchen: Dishwasher; Microwave; Range; Refrigerator; Electric water heater
- Bedrooms: 5 bedrooms
- Bathrooms: 2 full bathrooms
- Heating & cooling: Electric heating with heat pump; Central air conditioning
- Interior features: Ceiling fans; Living room / dining room combo; Open floorplan; Thermostat; Walk-in closets; Smoke detector(s)
- Laundry & utility: Inside laundry room with washer and electric dryer hookups; Inside utility and storage rooms
Neighborhood map
What this means for you Summary
Snapshot
- This is a 3-bed/2.0-bath single-family listed at $220k.
Deal economics
- At list price, monthly cash flow is $-123 ($-1k/yr) — negative.
- To cash-flow at today's rent, offer at most $198k (9.8% below list).
- Meets the 1% rule at list price ($2k rent vs $220k).
- Recommended offer: $198k (9.8% below list) — sets the bar for cash-flow.
- Cap rate 8.0% vs local median 2.5% in Crystal River — top-decile yield for the area; either an underpriced asset or a hidden risk that comps aren't pricing in. Stress-test before assuming the spread holds.
Location & tenants
- Location reads 66/100 on livability (#603 in FL) — a middle-class / working-renter tenant base. Strengths: crime A+, cost of living A+; Watch: health & safety C-, amenities F, commute F.
- Citrus (rural): math 49% / reading 50% proficiency, ranked #44 of 73 in FL (top 60%) — families likely to look elsewhere, expect single-tenant / working-renter base with shorter leases.
- Zoned schools: Crystal River Primary School (math 45% / reading 55%, grade D+, #1,070 of 2,144 statewide, top 51%, 654 students, 70% FRL); Crystal River Middle School (math 49% / reading 47%, grade C-, #286 of 571 statewide, top 50%, 900 students, 64% FRL); Crystal River High School (math 31% / reading 44%, grade F, #336 of 667 statewide, top 51%, 1,249 students, 56% FRL).
- Market conditions: 322 active listings in the ZIP; 4 comparable units currently listed for rent nearby; rentals at typical pace (median 24d on market — plan ~3-4 weeks tenant-placement turnaround); 2,443 units permitted in Citrus County in 2024 (0 in 5+ unit buildings).
- At $2,329/mo this rent would consume 55% of the median local household income ($51k/yr) (locally 264% of renters already pay >50% of income on rent) — very limited rent-growth headroom before tenants either downsize or default.
Forward outlook
- Local home prices are declining (-3.0%/yr); year-one equity from $2k of loan paydown is wiped out by about $7k of value loss. Plan a longer hold.
- Citrus County population projected to shrink 10% by 2050 — rents likely to lag national; underwrite the cash flow, not the appreciation.
Negotiation context
- It's been on market 92 days — a 9% lower offer ($200k) is reasonable based on typical stale-listing flexibility.
- 5 sale attempts since 3y ago; this cycle's ask has dropped $26k (11%) from the opening price — seller is motivated, your offer sets the floor, not the list.
- Current owner paid $35k; list at $220k implies a 529% gain — meaningful room to come down on a strong offer.
Risks & watch-outs
- Watch-outs: flood insurance adds $427/mo; built in 1952 — expect roof / HVAC / electrical / plumbing capex.
- Climate carrying-cost: in FEMA flood zone AE (mandatory federal flood insurance); severe wind risk, 99% chance of damaging wind over 30y; extreme-heat days projected 7→25/yr by 2055 (HVAC capex compounding) — expect insurance premiums to compound above CPI over the hold.
Questions for the listing agent
- What do current leases actually rent for vs. the listed asking? Can we see a recent rent roll and the last 12 months of T-12 income?
- It's been on market 92 days. Have you received any prior offers? Is the seller open to a 10% concession, seller financing, or rate buy-down credit?
- Built in 1952 — when were the roof, HVAC, electrical panel, plumbing, and water heater last replaced?
- What's the actual annual flood-insurance premium (NFIP or private), and is the property in a SFHA with mandatory coverage?
- Why hasn't it sold? Are there any deal-killer items the seller is aware of (foundation, flood, title, zoning, code violations)?
- Is there a deadline driving the sale (1031 exchange, divorce, estate, relocation)? That informs how much negotiation room exists.
- Schools are D-rated, which usually means shorter tenancies and higher turnover. Who's the typical renter profile here, and what's been the actual vacancy rate?
- What's the average days-on-market for RENTAL listings here right now (not sales)? A rising rental-DOM trend means longer vacancies and softer asking-rent achievability than the comps imply.
- What's the recent tenant-quality profile in this submarket — average credit score on applications, eviction rate, late-payment / NSF rate, and stable-employment percentage? A property-management company in the area should have these aggregated.
- How much new for-sale + rental construction is in the pipeline within 1–3 miles? Heavy new supply typically softens prices + rents 12–24 months out; constrained supply supports both.
Investment metrics
- 1% rule
- 1.06% ✓
- Cap rate
- 7.95%
- Cash-on-cash
- 5.92%
- DSCR
- 1.26
- GRM
- 7.9
CMA / ARV
- ARV (on-the-fly)
- $237,750
- Comps found
- 7
Show comp detail 7 sales within ~0.75 mi
| Address | Dist | Beds/Ba | Sqft | Sold | Price | $/sf | Match |
|---|---|---|---|---|---|---|---|
| 601 NE 11th St | 0.15mi | 3/2.0 | 1,640 (+4%) | 14mo | $250,000 | $152 | 76 |
| 451 NE 11th St | 0.14mi | 4/2.0 (+1) | 1,428 (-10%) | 3mo | $235,000 | $165 | 70 |
| 3555 N Turkey Oak Dr | 0.41mi | 3/2.0 | 1,546 (-2%) | 15mo | $265,000 | $171 | 64 |
| 1005 NE 4th Ave | 0.22mi | 3/2.0 | 1,384 (-13%) | 16mo | $135,000 | $98 | 55 |
| 750 NE 2nd Ave | 0.53mi | 4/3.0 (+1) | 1,681 (+6%) | 12mo | $252,000 | $150 | 46 |
| 307 NE 4th Ave | 0.72mi | 4/1.0 (+1) | 1,673 (+6%) | 4mo | $160,000 | $96 | 45 |
| 745 NE 5th Ter | 0.63mi | 4/2.0 (+1) | 1,680 (+6%) | 16mo | $130,000 | $77 | 42 |
Match score weights: distance 35% · size 25% · config 20% · recency 20%. Top-matched comps best support the ARV.
Projected returns pro-forma
-3.0% appreciation · 3.0% rent growth · sell at horizon
- IRR
- -20.1%
- Equity multiple
- 0.30×
- Total profit
- $-43,145
- Equity at exit
- $32,801
- IRR
- -12.7%
- Equity multiple
- 0.25×
- Total profit
- $-46,371
- Equity at exit
- $19,021
Cash invested: $61,597 (down + closing). Projections, not guarantees.
Landlord ↔ Tenant lean methodology
- Overall (STATE)
- 87 Strongly Landlord-Friendly
- State Florida
- 87 Strongly Landlord-Friendly · R+3
- County
- — inherits STATE
- City
- — inherits STATE
ZIP-level market 34428
- Home prices YoY
- -15.3%
- Active inventory
- 322
- Price-to-rent
- 7.9×
Monthly cashflow live
- Estimated rent
- $2,329 medium interval (Pro) →
- Mortgage (P&I)
- −$1,154
- Tax from tax record
- −$291 /mo · $3,492/yr
- Insurance
- −$92
- Flood insurance flood zone
- −$427 /mo · $5,118/yr
- HOA
- −$0
- Lot rent
- −$0
- Vacancy / Maint / Mgmt
- −$489
- Net cashflow
- $-123
Break-even live
Sensitivity live
| Price | -10% $2 | -5% $-60 | +0% $-123 | +5% $-185 | +10% $-247 |
|---|---|---|---|---|---|
| Rent | -10% $-307 | -5% $-215 | +0% $-123 | +5% $-31 | +10% $61 |
| Rate | -1.0pp $-12 | -0.5pp $-67 | base $-123 | +0.5pp $-180 | +1.0pp $-238 |
UW: 25.0% down · 7.5% · 30yr · 1.5% tax · 5.0% vac · 8.0% maint · 8.0% mgmt
Financing live
Cash to close
- Down payment
- $54,998
- Closing costs
- $6,600
- Reserves months
- —
- Total cash needed
- —
Loan-product check · same deal, 3 products live
Conventional
25% down · 7.5% · 30yr
- Down + closing
- —
- Monthly P&I
- —
- Monthly cashflow
- —
- DSCR
- —
- Eligible?
- —
Personal DTI + credit; lowest rate.
DSCR
20% down · 8.5% · 30yr
- Down + closing
- —
- Monthly P&I
- —
- Monthly cashflow
- —
- DSCR
- —
- Eligible?
- —
No personal income docs; deal must DSCR.
Hard money
10% down · 12.0% · 12mo
- Down + closing
- —
- Monthly P&I
- —
- Monthly cashflow
- —
- DSCR
- —
- Eligible?
- —
Short-term bridge; refi at stabilization.
Rent comps 4 comps
| Address | Beds | Baths | Sqft | Rent | $/sqft | DOM | Units | Dist |
|---|---|---|---|---|---|---|---|---|
| 1328 NE 5th Ave Crystal River, FL | 3.0 | 2.0 | 1946 | $2,000 | $1.03 | 23d | 1 | 0.01mi |
| 1004 SE 5th Ave Crystal River, FL | 3.0 | 2.5 | 2114 | $3,500 | $1.66 | 23d | 1 | 1.42mi |
| 1950 NW 12th Ave Unit B Crystal River, FL | 2.0 | 2.0 | 1100 | $1,300 | $1.18 | 23d | 1 | 1.46mi |
| 373 NW 14th Pl Crystal River, FL | 2.0 | 2.0 | 1422 | $3,000 | $2.11 | 23d | 1 | 1.50mi |
Listing history 50 events
-
2026-06-15statusdays on market $219,990 Pending 92 DOM
-
2026-06-14days on market $219,990 Active 91 DOM
-
2026-06-13pricedays on market $219,990 Active 90 DOM
-
2026-06-09pricedays on market $219,993 Active 87 DOM
-
2026-06-09price $219,994 Active 86 DOM
-
2026-06-08pricedays on market $219,995 Active 86 DOM
-
2026-06-03pricedays on market $219,997 Active 81 DOM
-
2026-06-03price $219,998 Active 80 DOM
-
2026-06-02days on market $219,999 Active 80 DOM
-
2026-06-01days on market $219,999 Active 79 DOM
-
2026-05-31days on market $219,999 Active 78 DOM
-
2026-05-30days on market $219,999 Active 77 DOM
-
2026-05-25price $234,888
-
2026-05-22price $234,889
-
2026-05-21price $239,889
-
2026-05-20price $239,890
-
2026-05-19price $239,891
-
2026-05-18price $239,892
-
2026-05-15price $239,893
-
2026-05-14price $239,894
-
2026-05-13price $239,895
-
2026-05-12price $239,896
-
2026-05-11price $239,897
-
2026-05-08price $239,898
-
2026-05-07price $239,899
-
2026-05-04price $239,900
-
2026-04-27price $244,900
-
2026-04-26price $239,000
-
2026-04-24price $245,000
-
2026-04-23price $245,100
-
2026-04-22price $245,200
-
2026-04-21price $245,300
-
2026-04-20price $245,400
-
2026-04-17price $245,500
-
2026-04-11price $245,600
-
2026-04-05price $245,700
-
2026-03-29price $245,800
-
2026-03-16status Active
-
2026-03-08status Pending
-
2026-03-06$245,900 Active
-
2025-08-12status Active
-
2025-07-20status Pending
-
2025-07-14price $249,900
-
2025-07-14price $249,900
-
2025-06-05price $254,800
-
2025-06-05price $254,800
-
2025-05-09price $259,800
-
2025-05-09price $259,800
-
2025-04-17price $259,900
-
2025-04-17price $259,900
ⓘ Source: listings_history table (triggers on properties + properties_extension) + one-shot
backfill from property_details.listing_events for pre-trigger history.
Tax reassessment forecast FL · Resets to sale price
- Current annual tax
- $3,492 · $291/mo
- Projected year-2 tax
- $3,492 · $291/mo
- Expected delta
- $0/yr ($0/mo · 0.0%)
ⓘ Screening estimate from a state-policy table — verify with the county assessor before closing.
Climate risk First Street
- Flood 10/10 Extreme FEMA zone AE · 99% chance over 30 yrs
- Wildfire 4/10 Moderate
- Heat 9/10 Extreme 7 d/yr ≥109°F today · 25 d/yr by 30 yrs out
- Wind 9/10 Extreme 99% chance of damaging wind over 30 yrs
- Air quality 1/10 Low 0 unhealthy d/yr today · 0 by 30 yrs out
Nearby sold comps map
Loading sold comps map…
Walkable amenities ~0.75 mi
Loading nearby amenities…
Taxation est. · year 1
- Rental income
- $27,954
- − Mortgage interest
- −$12,323
- − Property taxes
- −$3,492
- − Insurance
- −$6,218
- − Repairs & maintenance
- −$2,236
- − Management
- −$2,236
- − Depreciation
- −$6,400
- Taxable loss
- −$4,951
- Est. tax savings @ 24.0%
- +$1,188
- After-tax cash flow
- $-282/yr
For passive investors: Depreciation is non-cash, so a rental often shows a tax loss while cash-flowing — sheltering income. Rental losses are passive: they offset passive income freely, and up to $25,000/yr can offset ordinary (W-2) income if you actively participate and your MAGI is under $100k (phasing out to $0 by $150k); unused losses carry forward. On sale, claimed depreciation is recaptured at up to 25%, and gains may owe capital-gains tax (a 1031 exchange can defer both). Figures are a year-1 estimate at your 24.0% rate — not tax advice; consult a CPA.
Schools (NCES district)
- District
- Citrus
- NCES district ID
- 1200270
- Math proficiency
- 49% ▼ -10.00%
- Reading proficiency
- 50% ▼ -6.00%
- Median HH income
- $38,618
- Composite
- 41.28/100
- National rank
- #3519
- State rank
- #44 of 73 in FL
Livability — Crystal River
- Score
- 66/100
- State rank
- #603
- US rank
- #11564
Category grades
Schools grade is shown separately in the Schools card above.
Census & demographics
- Census place
- Crystal River, FL
- County
- Citrus County · 111,314 people
- City population
- 10,163
- Metro
- Homosassa Springs, FL
- Population (ZIP)
- 10,163
- Household income
- $50,779
- Rent vs Own
- Severe rent burden
- 264.0
Population outlook (Citrus County) Hauer SSP2
- Today (2025)
- 138,622 people
- By 2030
- 136,886 · -1.3%
- By 2040
- 132,009 · -4.8%
- By 2050
- 125,196 · -9.7%
- By 2075
- 108,570 · -21.7%
- By 2100
- 84,454 · -39.1%
Race, ethnicity, and origin ACS 2023
- Neighborhood character
- Predominantly White (88%)
- Race & ethnicity
- White 88% Two or more races 6% Hispanic / Latino 5% Asian 2%
- Common ancestry
- Lithuanian 3% Romanian 3% Slovak 2%
- Foreign-born
- 5% · Canada, Jamaica, South Korea
- Languages at home
- 96% English-only · Spanish 3%
Political lean MEDSL · Citrus
- 2024 margin
- Solid R (+45.9) · D 26.8% · R 72.6%
- 2008→2024 swing
- -29.8pp toward R · 2008: -16.1pp · 2024: -45.9pp
- All cycles
- 2024: R+45.9 2020: R+41.0 2016: R+39.7 2012: R+21.9 2008: R+16.1
Not yet ingested
- Civics
- —
Market trends
- HPI YoY
- ▼ -57.32%
- Current HPI
- 317.7637
- Rent YoY
- —
- Metro
- Homosassa Springs, FL
- State GDP YoY
- ▲ 3.28%
- F500 in state
- 36
Industry mix (Fortune 500 HQ in FL)
| Industry | F500 HQs | Revenue |
|---|---|---|
| Industrial Technology | 2 | $29B |
|
||
| Insurance | 2 | $17B |
|
||
| Retail | 1 | $60B |
|
||
| Technology Distribution | 1 | $58B |
|
||
| Homebuilding | 1 | $35B |
|
||
| Technology Manufacturing | 1 | $35B |
|
||
Price history
+534.8% since first listed48 events — show timeline
- 2026-05-25 Price Changed $234,888 Stellar MLS as Distributed by MLS Grid
- 2026-05-22 Price Changed $234,889 Stellar MLS as Distributed by MLS Grid
- 2026-05-21 Price Changed $239,889 Stellar MLS as Distributed by MLS Grid
- 2026-05-20 Price Changed $239,890 Stellar MLS as Distributed by MLS Grid
- 2026-05-19 Price Changed $239,891 Stellar MLS as Distributed by MLS Grid
- 2026-05-18 Price Changed $239,892 Stellar MLS as Distributed by MLS Grid
- 2026-05-15 Price Changed $239,893 Stellar MLS as Distributed by MLS Grid
- 2026-05-14 Price Changed $239,894 Stellar MLS as Distributed by MLS Grid
- 2026-05-13 Price Changed $239,895 Stellar MLS as Distributed by MLS Grid
- 2026-05-12 Price Changed $239,896 Stellar MLS as Distributed by MLS Grid
- 2026-05-11 Price Changed $239,897 Stellar MLS as Distributed by MLS Grid
- 2026-05-08 Price Changed $239,898 Stellar MLS as Distributed by MLS Grid
- 2026-05-07 Price Changed $239,899 Stellar MLS as Distributed by MLS Grid
- 2026-05-04 Price Changed $239,900 Stellar MLS as Distributed by MLS Grid
- 2026-04-27 Price Changed $244,900 Stellar MLS as Distributed by MLS Grid
- 2026-04-26 Price Changed $239,000 Stellar MLS as Distributed by MLS Grid
- 2026-04-24 Price Changed $245,000 Stellar MLS as Distributed by MLS Grid
- 2026-04-23 Price Changed $245,100 Stellar MLS as Distributed by MLS Grid
- 2026-04-22 Price Changed $245,200 Stellar MLS as Distributed by MLS Grid
- 2026-04-21 Price Changed $245,300 Stellar MLS as Distributed by MLS Grid
- 2026-04-20 Price Changed $245,400 Stellar MLS as Distributed by MLS Grid
- 2026-04-17 Price Changed $245,500 Stellar MLS as Distributed by MLS Grid
- 2026-04-11 Price Changed $245,600 Stellar MLS as Distributed by MLS Grid
- 2026-04-05 Price Changed $245,700 Stellar MLS as Distributed by MLS Grid
- 2026-03-29 Price Changed $245,800 Stellar MLS as Distributed by MLS Grid
- 2026-03-16 Relisted — Stellar MLS as Distributed by MLS Grid
- 2026-03-08 Pending — Stellar MLS as Distributed by MLS Grid
- 2026-03-06 Listed $245,900 Stellar MLS as Distributed by MLS Grid
- 2025-08-12 Relisted — Stellar MLS as Distributed by MLS Grid
- 2025-07-20 Pending — Stellar MLS as Distributed by MLS Grid
- 2025-07-14 Price Changed $249,900 RACC
- 2025-07-14 Price Changed $249,900 Stellar MLS as Distributed by MLS Grid
- 2025-06-05 Price Changed $254,800 Stellar MLS as Distributed by MLS Grid
- 2025-06-05 Price Changed $254,800 RACC
- 2025-05-09 Price Changed $259,800 RACC
- 2025-05-09 Price Changed $259,800 Stellar MLS as Distributed by MLS Grid
- 2025-04-17 Price Changed $259,900 RACC
- 2025-04-17 Price Changed $259,900 Stellar MLS as Distributed by MLS Grid
- 2025-04-04 Price Changed $274,500 RACC
- 2025-04-04 Price Changed $274,500 Stellar MLS as Distributed by MLS Grid
- 2025-03-13 Price Changed $284,750 Stellar MLS as Distributed by MLS Grid
- 2025-03-13 Price Changed $284,750 RACC
- 2025-02-01 Listed $289,750 Stellar MLS as Distributed by MLS Grid
- 2023-10-24 Listing Removed — Stellar MLS as Distributed by MLS Grid
- 2023-10-21 Listing Removed — Stellar MLS as Distributed by MLS Grid
- 2023-08-07 Listed $165,000 Stellar MLS as Distributed by MLS Grid
- 1995-07-01 Sold (Public Records) $35,000 Public Records
- 1990-08-01 Sold (Public Records) $37,000 Public Records
Property tax history
+14.6%/yrLatest (2025): $3,492 · +82.4% YoY. Source: county tax records.
Cash-flow waterfall
monthlySold comps — $/sqft
last 12 mo · ≤1 miLoading sold comps…