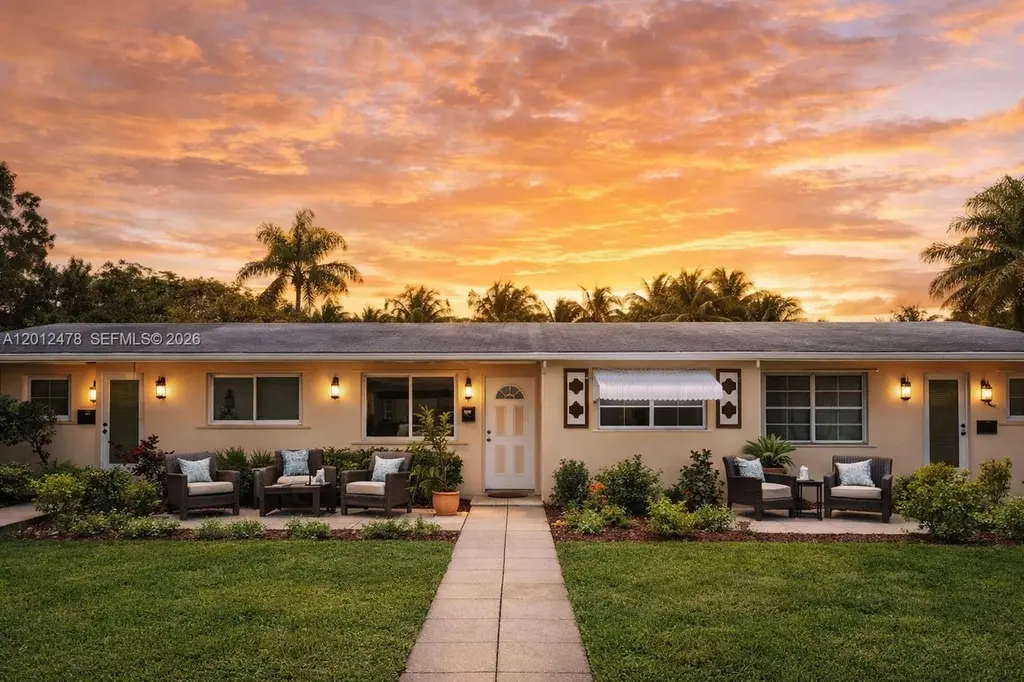
1817 NW 60th Ave Unit G · Sunrise, FL
Flood risk 1/10 · Minimal
- FEMA flood zone
- X (shaded)
- Chance of flooding over 30 yrs
- 0.0%
- Est. flood insurance / yr
- $507 – $1,088
Fire risk 1/10 · Minimal
- Est. fire insurance / yr
- $947 – $1,759
Heat risk 10/10 · Severe
- Hot days now (above 105°F)
- 7 days/yr
- Hot days in 30 yrs
- 29 days/yr
Wind risk 10/10 · Severe
- Chance of severe wind over 30 yrs
- 99.0%
Air-quality risk 2/10 · Minimal
- Unhealthy air days now
- 2 days/yr
- Unhealthy air days in 30 yrs
- 2 days/yr
Risk factors via First Street. Map © Google.
Why this score? — see what drove the D+ grade
The composite is a weighted blend of 9 inputs, each scored 0–100. Each bar is that input's sub-score; the figure is the points it added to the 100-point composite (weight × sub-score).
- Cash flow +15.9/30.0
- ARV discount +7.5/15.0
- 1% rule +5.1/10.0
- DSCR +4.9/10.0
- Livability +4.2/5.0
- Schools +4.1/10.0
- Rent growth +2.6/5.0
- Condition / age +2.5/5.0
- Appreciation +0.0/10.0
$155,000
🖨 Deal sheet (PDF) 📄 Offer letter ✓ Due diligence
Listing remarks
INVESTOR OPPORTUNITY! TURN-KEY 2 BED / 1 BATH – FULLY REMODELED. Unit rented. SELLER FINANCING 30% DOWN! Property features include conversion from wall unit to central A/C, new tile flooring throughout, and a brand-new kitchen and bathroom. Excellent income-producing property with a cap rate over 15% based on list price. Enjoy canal views with beautiful sunsets in a quiet and peaceful area. The unit also offers impact windows, is very well maintained, and has a low HOA. No rental restrictions and all ages welcome. Tenants are not required to apply to the HOA, making it a highly flexible investment. The unit is going to be rented in $1750 - very good tenants.
Key facts
- New tile flooring
- Fully remodeled
- Central a/c
Tags
Property features AI
Finance
- Financial info: Lease considered; Pets allowed (no restrictions)
- HOA & community: Association fee of $200 per month
Exterior
- Parking: Two or more parking spaces
- Home design: Attached property; Single-story; Entry on level 1; Resale
- Construction: Block construction
- Exterior features: Canal-front property; Waterfront setting; Has a view
Interior
- Bathrooms: 1 full bathroom
- Interior features: First-floor entry; Other interior features
Neighborhood map
What this means for you Summary
Snapshot
- This is a 1-bed/1.0-bath condo listed at $155k.
Deal economics
- At list price, monthly cash flow is $74 ($890/yr) — positive.
- The deal already cash-flows at list — no discount required.
- Meets the 1% rule at list price ($2k rent vs $155k).
- Recommended offer: $150k (3.0% below list) — sets the bar for market timing.
- Cap rate 6.9% vs local median 4.9% in Sunrise — top-decile yield for the area; either an underpriced asset or a hidden risk that comps aren't pricing in. Stress-test before assuming the spread holds.
Location & tenants
- Location reads 83/100 on livability (#56 in FL, #986 nationally) — a professional / high-income tenant draw. Strengths: commute A+, housing A+, health & safety A+; Watch: employment C-, amenities F.
- Broward (suburban): math 42% / reading 53% proficiency, ranked #46 of 73 in FL (top 63%) — families likely to look elsewhere, expect single-tenant / working-renter base with shorter leases.
- Zoned schools: Nova Blanche Forman Elementary (math 35% / reading 55%, grade D-, #1,271 of 2,144 statewide, top 60%, 769 students, 72% FRL); Nova Middle School (math 44% / reading 53%, grade C-, #274 of 571 statewide, top 50%, 1,284 students, 68% FRL); Nova High School (math 22% / reading 56%, grade F, #312 of 667 statewide, top 48%, 2,227 students, 59% FRL) — zoned schools average 66% FRL vs 51% district-wide (15 pts higher); higher-poverty schools than district average — tighter screening recommended.
- Market conditions: Rents flat; 664 active listings in the ZIP; 40 comparable units currently listed for rent nearby; rentals at typical pace (median 24d on market — plan ~3-4 weeks tenant-placement turnaround); 2,111 units permitted in Broward County in 2024 (1,265 in 5+ unit buildings).
- This rent runs 41% of the median local income ($46k/yr) — at the standard rent-burdened threshold; future hikes will face affordability resistance.
Forward outlook
- Local home prices are declining (-3.0%/yr); year-one equity from $1k of loan paydown is wiped out by about $5k of value loss. Plan a longer hold.
- Broward County population projected at +34% by 2050 — long-run rental-demand tailwind backs the buy-and-hold thesis.
Negotiation context
- It's been on market 48 days — a 3% lower offer ($150k) is reasonable based on typical stale-listing flexibility.
- 3 sale attempts; this cycle's ask is 9018% above the opening price — seller raised mid-cycle; expect resistance to lowballs.
- Current owner paid $105k; 48% above their basis — modest negotiation headroom, anchor on the comps not their cost.
Risks & watch-outs
- Climate carrying-cost: severe wind risk, 99% chance of damaging wind over 30y; extreme-heat days projected 7→29/yr by 2055 (HVAC capex compounding) — expect insurance premiums to compound above CPI over the hold.
Questions for the listing agent
- It's been on market 48 days. Have you received any prior offers? Is the seller open to a 3% concession, seller financing, or rate buy-down credit?
- Built in 1965 — when were the roof, HVAC, electrical panel, plumbing, and water heater last replaced?
- What does the HOA fee cover, when was the last increase, and are there any pending special assessments or reserve-fund shortfalls?
- Any open or pending special assessments — roof, HVAC, plumbing, elevator, façade? What's the per-unit balance and payoff schedule, and is the seller paying it off at close or rolling it to the buyer?
- Is there a deadline driving the sale (1031 exchange, divorce, estate, relocation)? That informs how much negotiation room exists.
- The area grade is low — what's the realistic commute time and amenity access for the typical tenant pool here? Any planned neighborhood developments (good or bad) we should know about?
- What's the average days-on-market for RENTAL listings here right now (not sales)? A rising rental-DOM trend means longer vacancies and softer asking-rent achievability than the comps imply.
- What's the recent tenant-quality profile in this submarket — average credit score on applications, eviction rate, late-payment / NSF rate, and stable-employment percentage? A property-management company in the area should have these aggregated.
- How much new apartment / multifamily construction is in the pipeline within 1–3 miles? Heavy new supply (>2% of stock underway) typically softens rents 12–24 months out; light construction supports rent growth.
Investment metrics
- 1% rule
- 1.01% ✓
- Cap rate
- 6.87%
- Cash-on-cash
- 2.05%
- DSCR
- 1.09
- GRM
- 8.3
CMA / ARV
No comps found within radius.
Projected returns pro-forma
-3.0% appreciation · 0.26% rent growth · sell at horizon
- IRR
- -16.4%
- Equity multiple
- 0.44×
- Total profit
- $-24,508
- Equity at exit
- $23,111
- IRR
- -14.5%
- Equity multiple
- 0.28×
- Total profit
- $-31,236
- Equity at exit
- $13,402
Cash invested: $43,400 (down + closing). Projections, not guarantees.
Landlord ↔ Tenant lean methodology
- Overall (STATE)
- 87 Strongly Landlord-Friendly
- State Florida
- 87 Strongly Landlord-Friendly · R+3
- County
- — inherits STATE
- City
- — inherits STATE
ZIP-level market 33313
- Rents YoY
- 0.3%
- Active inventory
- 664
- Price-to-rent
- 8.3×
Monthly cashflow live
- Estimated rent
- $1,564 high interval (Pro) →
- Mortgage (P&I)
- −$813
- Tax from tax record
- −$84 /mo · $1,004/yr
- Insurance
- −$65
- HOA
- −$200
- Vacancy / Maint / Mgmt
- −$328
- Net cashflow
- $74
Break-even live
Sensitivity live
| Price | -10% $162 | -5% $118 | +0% $74 | +5% $30 | +10% $-14 |
|---|---|---|---|---|---|
| Rent | -10% $-49 | -5% $12 | +0% $74 | +5% $136 | +10% $198 |
| Rate | -1.0pp $152 | -0.5pp $114 | base $74 | +0.5pp $34 | +1.0pp $-7 |
UW: 25.0% down · 7.5% · 30yr · 1.5% tax · 5.0% vac · 8.0% maint · 8.0% mgmt
Financing live
Cash to close
- Down payment
- $38,750
- Closing costs
- $4,650
- Reserves months
- —
- Total cash needed
- —
Loan-product check · same deal, 3 products live
Conventional
25% down · 7.5% · 30yr
- Down + closing
- —
- Monthly P&I
- —
- Monthly cashflow
- —
- DSCR
- —
- Eligible?
- —
Personal DTI + credit; lowest rate.
DSCR
20% down · 8.5% · 30yr
- Down + closing
- —
- Monthly P&I
- —
- Monthly cashflow
- —
- DSCR
- —
- Eligible?
- —
No personal income docs; deal must DSCR.
Hard money
10% down · 12.0% · 12mo
- Down + closing
- —
- Monthly P&I
- —
- Monthly cashflow
- —
- DSCR
- —
- Eligible?
- —
Short-term bridge; refi at stabilization.
Rent comps 40 comps
| Address | Beds | Baths | Sqft | Rent | $/sqft | DOM | Units | Dist |
|---|---|---|---|---|---|---|---|---|
| 5971 NW 16th Pl Sunrise, FL | 1.0–2.0 | 1.0 | 715 | $1,500 | $2.10 | 26d | 1 | 0.12mi |
| 5941 NW 16th Pl Sunrise, FL | 1.0–2.0 | 1.0–1.5 | 772 | $1,500 | $1.94 | 26d | 1 | 0.14mi |
| 5990 NW 16th Pl Sunrise, FL | 1.0–2.0 | 1.0–2.0 | 801 | $1,500 | $1.87 | 26d | 1 | 0.15mi |
| 5972 NW 19th St Unit 3 Lauderhill, FL | 1.0 | 1.0 | 700 | $1,450 | $2.07 | 15d | 1 | 0.15mi |
| 5980 NW 16th Pl Sunrise, FL | 1.0–2.0 | 1.0–2.0 | 797 | $1,500 | $1.88 | 26d | 1 | 0.15mi |
| 5960 NW 16th Pl Sunrise, FL | 1.0–2.0 | 1.0–2.0 | 797 | $1,500 | $1.88 | 26d | 1 | 0.16mi |
| 5811 NW 17th Pl Unit H Sunrise, FL | 1.0 | 1.0 | 600 | $1,750 | $2.92 | 26d | 1 | 0.17mi |
| 5880 NW 19th Ct Unit 5888 Lauderhill, FL | 2.0 | 1.0 | 750 | $1,775 | $2.37 | 4d | 1 | 0.26mi |
| 2111 NW 60th Ave Unit back Sunrise, FL | 1.0 | 1.0 | 600 | $1,450 | $2.42 | 26d | 1 | 0.28mi |
| 1611 NW 63rd Ave Unit 2 Sunrise, FL | 1.0 | 1.0 | 750 | $1,350 | $1.80 | 26d | 1 | 0.32mi |
| 4400 W Sunrise Blvd Fort Lauderdale, FL | 2.0 | 1.0–2.0 | 811 | $2,624 | $3.24 | 0d | 43 | 0.36mi |
| 2241 NW 59th Ter Unit 1 Lauderhill, FL | 2.0 | 1.0 | 735 | $1,850 | $2.52 | 26d | 1 | 0.48mi |
| 6580 NW 22nd St Unit 2 Sunrise, FL | 1.0 | 1.0 | 650 | $1,000 | $1.54 | 4d | 1 | 0.53mi |
| 1752 NW 55th Ave #102 Lauderhill, FL | 1.0 | 1.0 | 550 | $1,390 | $2.53 | 26d | 1 | 0.56mi |
| 6901 W Sunrise Blvd Plantation, FL | 1.0–3.0 | 1.0–2.0 | 1037 | $1,989 | $1.92 | 0d | 42 | 0.65mi |
| 2360 NW 56th Ave Lauderhill, FL | 1.0–3.0 | 1.0–2.0 | 924 | $1,585 | $1.72 | 0d | 20 | 0.67mi |
| 6121 NW 11th St Sunrise, FL | 2.0 | 1.0 | 800 | $1,500 | $1.88 | 26d | 1 | 0.68mi |
| 2481 NW 56th Ave Unit 6-16 Lauderhill, FL | 1.0 | 1.0 | 745 | $1,600 | $2.15 | 18d | 1 | 0.69mi |
| 5321 NW 21st Ct Lauderhill, FL | 2.0 | 1.0 | 750 | $1,900 | $2.53 | 26d | 1 | 0.72mi |
| 6108 NW 26th St Sunrise, FL | 1.0–3.0 | 1.0–2.0 | 925 | $1,675 | $1.81 | 0d | 43 | 0.81mi |
| 1681 NW 70th Ave #418 Plantation, FL | 1.0 | 1.0 | 660 | $1,700 | $2.58 | 6d | 1 | 0.85mi |
| 1681 NW 70th Ave #418 Plantation, FL | 1.0 | 1.0 | 660 | $1,600 | $2.42 | 26d | 1 | 0.85mi |
| 2330 NW 72nd Ave Sunrise, FL | 1.0–2.0 | 1.0 | 742 | $1,650 | $2.22 | 26d | 1 | 0.87mi |
| 5480 NW 11th St #306 Lauderhill, FL | 1.0 | 1.0 | 675 | $1,590 | $2.36 | 26d | 1 | 0.90mi |
| 5480 NW 11th St Lauderhill, FL | 1.0 | 1.0 | 675 | $1,570 | $2.33 | 22d | 2 | 0.90mi |
| 5480 NW 11th St Lauderhill, FL | 1.0 | 1.0 | 675 | $1,570 | $2.33 | 7d | 2 | 0.90mi |
| 5420 NW 11th St #205 Lauderhill, FL | 1.0 | 1.0 | 675 | $1,990 | $2.95 | 0d | 1 | 0.93mi |
| 2800 NW 56th Ave Lauderhill, FL | 1.0–2.0 | 1.0–2.0 | 847 | $1,480 | $1.75 | 16d | 6 | 1.02mi |
| 2800 NW 56th Ave Lauderhill, FL | 1.0–3.0 | 1.0–2.0 | 965 | $1,250 | $1.30 | 0d | 8 | 1.02mi |
| 2800 NW 56th Ave Lauderhill, FL | 1.0–2.0 | 1.0–2.0 | 847 | $1,175 | $1.39 | 26d | 8 | 1.02mi |
| 2800 NW 56th Ave Lauderhill, FL | 1.0–2.0 | 1.0–2.0 | 847 | $1,250 | $1.48 | 6d | 8 | 1.02mi |
| 2800 NW 56th Ave Lauderhill, FL | 1.0–2.0 | 1.0–2.0 | 847 | $1,250 | $1.48 | 23d | 7 | 1.02mi |
| 7300 NW 17th St #318 Plantation, FL | 1.0 | 1.0 | 660 | $1,550 | $2.35 | 26d | 1 | 1.08mi |
| 7400 NW 13th St Plantation, FL | 1.0 | 1.0 | 600 | $1,400 | $2.33 | 26d | 1 | 1.13mi |
| 4770 NW 10th Ct #312 Plantation, FL | 1.0 | 1.0 | 748 | $1,600 | $2.14 | 0d | 1 | 1.25mi |
| 1861 NW 46th Ave Lauderhill, FL | 2.0 | 1.0–2.0 | 730 | $1,475 | $2.02 | 0d | 14 | 1.26mi |
| 1621 NW 46th Ave #101 Lauderhill, FL | 1.0 | 1.0 | 576 | $1,600 | $2.78 | 26d | 1 | 1.27mi |
| 4851 NW 26th Ct #338 Lauderdale Lakes, FL | 1.0 | 1.0 | 705 | $1,650 | $2.34 | 18d | 1 | 1.28mi |
| 1599 NW 43rd Ave #106 Lauderhill, FL | 1.0 | 1.0 | 730 | $1,499 | $2.05 | 19d | 1 | 1.48mi |
| 5021 W Oakland Park Blvd Lauderdale Lakes, FL | 1.0 | 1.0 | 684 | $1,550 | $2.27 | 19d | 2 | 1.49mi |
HOA detail condo
- Monthly dues
- $200 · $2,400/yr
- Assessments
- None detected in remarks — confirm with the listing agent.
Listing history 24 events
-
2026-06-21days on market $155,000 Active 48 DOM
-
2026-06-18days on market $155,000 Active 45 DOM
-
2026-06-17days on market $155,000 Active 44 DOM
-
2026-06-16days on market $155,000 Active 43 DOM
-
2026-06-15days on market $155,000 Active 42 DOM
-
2026-06-13days on market $155,000 Active 40 DOM
-
2026-06-09days on market $155,000 Active 36 DOM
-
2026-06-08days on market $155,000 Active 35 DOM
-
2026-06-07days on market $155,000 Active 34 DOM
-
2026-06-04days on market $155,000 Active 31 DOM
-
2026-06-03days on market $155,000 Active 30 DOM
-
2026-06-02days on market $155,000 Active 29 DOM
-
2026-06-01days on market $155,000 Active 28 DOM
-
2026-05-31days on market $155,000 Active 27 DOM
-
2026-05-20price $1,750
-
2026-05-13status Active
-
2026-05-08historical Active Under Contract
-
2026-05-08price $1,800
-
2026-05-06$1,700
-
2026-05-04$149,900 Active
-
2026-04-15soldstatus $105,000
-
2022-11-09soldstatus $90,000
-
1983-09-01soldstatus $30,000
-
1965-04-01soldstatus $8,700
ⓘ Source: listings_history table (triggers on properties + properties_extension) + one-shot
backfill from property_details.listing_events for pre-trigger history.
Tax reassessment forecast FL · Resets to sale price
- Current annual tax
- $1,004 · $84/mo
- Projected year-2 tax
- $1,286 · $107/mo
- Expected delta
- +$283/yr (+$24/mo · 28.2%)
ⓘ Screening estimate from a state-policy table — verify with the county assessor before closing.
Climate risk First Street
- Flood 1/10 Low FEMA zone X (shaded) · 0% chance over 30 yrs
- Wildfire 1/10 Low
- Heat 10/10 Extreme 7 d/yr ≥105°F today · 29 d/yr by 30 yrs out
- Wind 10/10 Extreme 99% chance of damaging wind over 30 yrs
- Air quality 2/10 Low 2 unhealthy d/yr today · 2 by 30 yrs out
Nearby sold comps map
Loading sold comps map…
Walkable amenities ~0.75 mi
Loading nearby amenities…
Taxation est. · year 1
- Rental income
- $18,763
- − Mortgage interest
- −$8,682
- − Property taxes
- −$1,004
- − Insurance
- −$775
- − Repairs & maintenance
- −$1,501
- − Management
- −$1,501
- − HOA
- −$2,400
- − Depreciation
- −$4,509
- Taxable loss
- −$1,609
- Est. tax savings @ 24.0%
- +$386
- After-tax cash flow
- $1,276/yr
For passive investors: Depreciation is non-cash, so a rental often shows a tax loss while cash-flowing — sheltering income. Rental losses are passive: they offset passive income freely, and up to $25,000/yr can offset ordinary (W-2) income if you actively participate and your MAGI is under $100k (phasing out to $0 by $150k); unused losses carry forward. On sale, claimed depreciation is recaptured at up to 25%, and gains may owe capital-gains tax (a 1031 exchange can defer both). Figures are a year-1 estimate at your 24.0% rate — not tax advice; consult a CPA.
Schools (NCES district)
- District
- Broward
- NCES district ID
- 1200180
- Math proficiency
- 42% ▼ -18.00%
- Reading proficiency
- 53% ▼ -5.00%
- Median HH income
- $52,139
- Composite
- 40.88/100
- National rank
- #3621
- State rank
- #46 of 73 in FL
Livability — Sunrise
- Score
- 83/100
- State rank
- #56
- US rank
- #986
Category grades
Schools grade is shown separately in the Schools card above.
Census & demographics
- Census place
- Sunrise, FL
- County
- Broward County · 1,963,430 people
- City population
- 77,492
- Metro
- Miami-Fort Lauderdale-Pompano Beach, FL
- Population (ZIP)
- 62,807
- Household income
- $46,305
- Rent vs Own
- Severe rent burden
- 5692.0
Population outlook (Broward County) Hauer SSP2
- Today (2025)
- 2,207,033 people
- By 2030
- 2,360,704 · +7.0%
- By 2040
- 2,661,208 · +20.6%
- By 2050
- 2,946,698 · +33.5%
- By 2075
- 3,602,273 · +63.2%
- By 2100
- 3,970,984 · +79.9%
Race, ethnicity, and origin ACS 2023
- Neighborhood character
- Predominantly Black (77%)
- Race & ethnicity
- Black 77% Hispanic / Latino 12% Two or more races 8% White 7% Asian 2%
- Hispanic origin (detail)
- Puerto Rican 2% Cuban 3% Dominican 1%
- Common ancestry
- Hispanic 20%
- Foreign-born
- 39% · Canada, Jamaica, Dominican Republic
- Languages at home
- 66% English-only · French/Haitian/Cajun 22% Spanish 10%
Political lean MEDSL · Broward
- 2024 margin
- D (+17.0) · D 58.0% · R 41.0%
- 2008→2024 swing
- -17.8pp toward R · 2008: 34.7pp · 2024: 17.0pp
- All cycles
- 2024: D+17.0 2020: D+29.8 2016: D+35.0 2012: D+34.9 2008: D+34.7
Not yet ingested
- Civics
- —
Market trends
- HPI YoY
- ▼ -338.15%
- Current HPI
- 288.9345
- Rent YoY
- ▲ 0.26%
- Metro
- Miami-Fort Lauderdale-Pompano Beach, FL
- State GDP YoY
- ▲ 3.28%
- F500 in state
- 36
Industry mix (Fortune 500 HQ in FL)
| Industry | F500 HQs | Revenue |
|---|---|---|
| Industrial Technology | 2 | $29B |
|
||
| Insurance | 2 | $17B |
|
||
| Retail | 1 | $60B |
|
||
| Technology Distribution | 1 | $58B |
|
||
| Homebuilding | 1 | $35B |
|
||
| Technology Manufacturing | 1 | $35B |
|
||
Price history
-79.9% since first listed10 events — show timeline
- 2026-05-20 Price Changed $1,750 MARMLS
- 2026-05-13 Relisted — MARMLS
- 2026-05-08 Contingent — MARMLS
- 2026-05-08 Price Changed $1,800 MARMLS
- 2026-05-06 Listed for Rent $1,700 MARMLS
- 2026-05-04 Listed $149,900 MARMLS
- 2026-04-15 Sold (Public Records) $105,000 Public Records
- 2022-11-09 Sold (Public Records) $90,000 Public Records
- 1983-09-01 Sold (Public Records) $30,000 Public Records
- 1965-04-01 Sold (Public Records) $8,700 Public Records
Property tax history
+15.1%/yrLatest (2025): $1,004 · +5.6% YoY. Source: county tax records.
Cash-flow waterfall
monthlySold comps — $/sqft
last 12 mo · ≤1 miLoading sold comps…