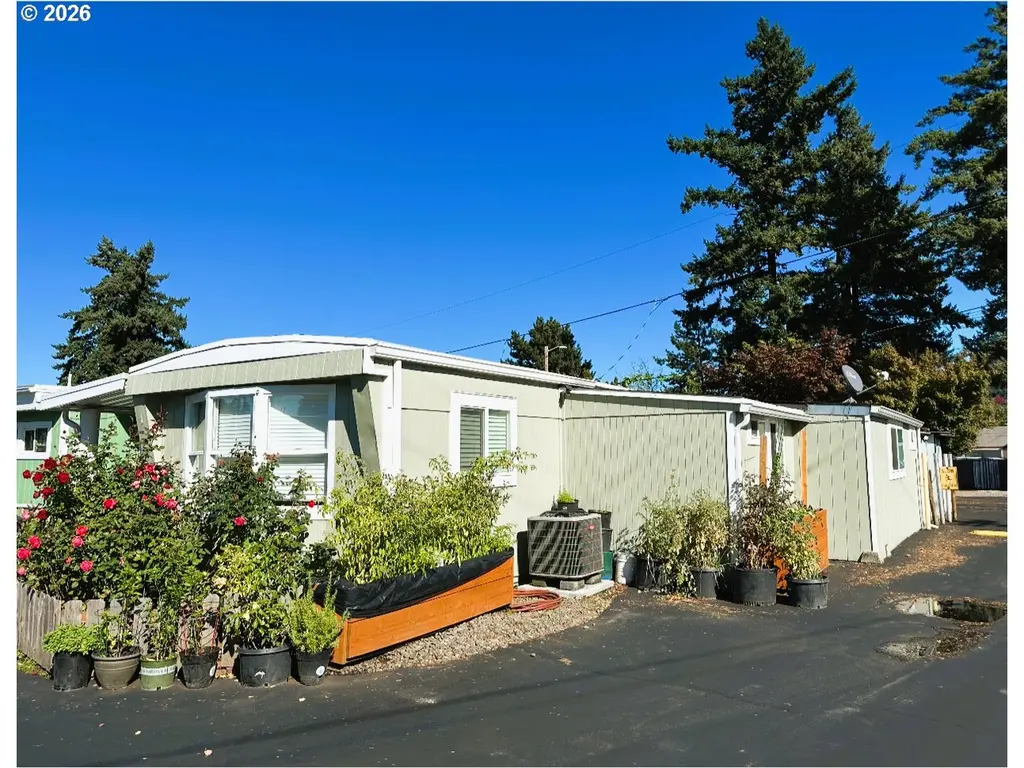
7958 SE Glencoe Rd #1 · Portland, OR
Flood risk 1/10 · Minimal
- FEMA flood zone
- X (unshaded)
- Chance of flooding over 30 yrs
- 0.0%
- Est. flood insurance / yr
- $507 – $1,088
Fire risk 1/10 · Minimal
- Est. fire insurance / yr
- $498 – $926
Heat risk 3/10 · Minor
- Hot days now (above 92°F)
- 7 days/yr
- Hot days in 30 yrs
- 15 days/yr
Wind risk 1/10 · Minimal
- Chance of severe wind over 30 yrs
- —
Air-quality risk 10/10 · Severe
- Unhealthy air days now
- 18 days/yr
- Unhealthy air days in 30 yrs
- 20 days/yr
Risk factors via First Street. Map © Google.
Why this score? — see what drove the B- grade
The composite is a weighted blend of 9 inputs, each scored 0–100. Each bar is that input's sub-score; the figure is the points it added to the 100-point composite (weight × sub-score).
- Cash flow +30.0/30.0
- DSCR +10.0/10.0
- 1% rule +9.7/10.0
- ARV discount +7.5/15.0
- Livability +3.9/5.0
- Schools +3.2/10.0
- Condition / age +2.5/5.0
- Rent growth +2.3/5.0
- Appreciation +0.0/10.0
$125,000
🖨 Deal sheet 📄 Offer letter ✓ Due diligence
Listing remarks MLS
Comfortable manufactured home with ample and new kitchen, 3 bedrooms, 2 full bath, wood flooring throughout the house, Bedroom in the back could be used as a Studio. A/C, newer electrical wires and panel insulation all around.
Key facts
- Wood flooring
- Ample kitchen
- Panel insulation
Tags
Neighborhood map
What this means for you Summary
Snapshot
- This is a 3-bed/2.0-bath other listed at $125k.
Deal economics
- At list price, monthly cash flow is $585 ($7k/yr) — positive.
- The deal already cash-flows at list — no discount required.
- Meets the 1% rule at list price ($2k rent vs $125k).
- Recommended offer: $114k (9.0% below list) — sets the bar for market timing.
- Cap rate 11.9% vs local median 2.2% in Portland — top-decile yield for the area; either an underpriced asset or a hidden risk that comps aren't pricing in. Stress-test before assuming the spread holds.
Location & tenants
- Location reads 77/100 on livability (#72 in OR, #3,256 nationally) — a middle-class / working-renter tenant base. Strengths: amenities A+, commute A+, health & safety A+; Watch: crime F, cost of living F.
- North Clackamas SD 12 (suburban): math 29% / reading 43% proficiency, ranked #22 of 58 in OR (top 38%) — families likely to look elsewhere, expect single-tenant / working-renter base with shorter leases.
- Market conditions: Rents soft (-0.8%/yr); 139 active listings in the ZIP; 40 comparable units currently listed for rent nearby; rentals at typical pace (median 21d on market — plan ~3-4 weeks tenant-placement turnaround); solid renter incomes; 946 units permitted in Clackamas County in 2024 (188 in 5+ unit buildings).
Forward outlook
- Local home prices are declining (-3.0%/yr); year-one equity from $864 of loan paydown is wiped out by about $4k of value loss. Plan a longer hold.
- Clackamas County population projected at +25% by 2050 — long-run rental-demand tailwind backs the buy-and-hold thesis.
- At projected returns (-3.0% appreciation + 0.0% rent growth), your $35k cash investment doubles in ~8 years — after that, you're playing with house money.
Negotiation context
- It's been on market 103 days — a 9% lower offer ($114k) is reasonable based on typical stale-listing flexibility.
Questions for the listing agent
- It's been on market 103 days. Have you received any prior offers? Is the seller open to a 9% concession, seller financing, or rate buy-down credit?
- Why hasn't it sold? Are there any deal-killer items the seller is aware of (foundation, flood, title, zoning, code violations)?
- Is there a deadline driving the sale (1031 exchange, divorce, estate, relocation)? That informs how much negotiation room exists.
- Crime grade is F in this area — have there been break-ins, vandalism, or insurance claims at this property in the last 3 years? What carrier currently insures it and at what premium?
- What's the average days-on-market for RENTAL listings here right now (not sales)? A rising rental-DOM trend means longer vacancies and softer asking-rent achievability than the comps imply.
- What's the recent tenant-quality profile in this submarket — average credit score on applications, eviction rate, late-payment / NSF rate, and stable-employment percentage? A property-management company in the area should have these aggregated.
- How much new for-sale + rental construction is in the pipeline within 1–3 miles? Heavy new supply typically softens prices + rents 12–24 months out; constrained supply supports both.
Investment metrics
- 1% rule
- 1.47% ✓
- Cap rate
- 11.91%
- Cash-on-cash
- 20.05%
- DSCR
- 1.89
- GRM
- 5.7
CMA / ARV
No comps found within radius.
Projected returns pro-forma
-3.0% appreciation · 0.0% rent growth · sell at horizon
- IRR
- 8.8%
- Equity multiple
- 1.33×
- Total profit
- $11,649
- Equity at exit
- $18,638
- IRR
- 15.3%
- Equity multiple
- 2.07×
- Total profit
- $37,453
- Equity at exit
- $10,808
Cash invested: $35,000 (down + closing). Projections, not guarantees.
Landlord ↔ Tenant lean methodology
- Overall (CITY)
- 0 Strongly Tenant-Friendly
- State Oregon
- 28 Tenant-Leaning · D+6
- County
- — inherits STATE
- City Portland
- 0 Strongly Tenant-Friendly · D+39
ZIP-level market 97222
- Rents YoY
- -0.8%
- Active inventory
- 139
- Price-to-rent
- 5.7×
Monthly cashflow live
- Estimated rent
- $1,834 high interval (Pro) →
- Mortgage (P&I)
- −$656
- Tax est. 1.5%
- −$156 /mo · $1,875/yr
- Insurance
- −$52
- HOA
- −$0
- Vacancy / Maint / Mgmt
- −$385
- Net cashflow
- $585
Break-even live
UW: 25.0% down · 7.5% · 30yr · 1.5% tax · 5.0% vac · 8.0% maint · 8.0% mgmt
Financing live
Cash to close
- Down payment
- $31,250
- Closing costs
- $3,750
- Reserves months
- —
- Total cash needed
- —
Loan-product check · same deal, 3 products live
Conventional
25% down · 7.5% · 30yr
- Down + closing
- —
- Monthly P&I
- —
- Monthly cashflow
- —
- DSCR
- —
- Eligible?
- —
Personal DTI + credit; lowest rate.
DSCR
20% down · 8.5% · 30yr
- Down + closing
- —
- Monthly P&I
- —
- Monthly cashflow
- —
- DSCR
- —
- Eligible?
- —
No personal income docs; deal must DSCR.
Hard money
10% down · 12.0% · 12mo
- Down + closing
- —
- Monthly P&I
- —
- Monthly cashflow
- —
- DSCR
- —
- Eligible?
- —
Short-term bridge; refi at stabilization.
Rent comps 40 comps
| Address | Beds | Baths | Sqft | Rent | $/sqft | DOM | Units | Dist |
|---|---|---|---|---|---|---|---|---|
| 7911 SE King Rd Unit 50 Milwaukie, OR | 2.0 | 1.5 | 920 | $1,595 | $1.73 | 20d | 1 | 0.06mi |
| 7911 SE King Rd Unit 42 Milwaukie, OR | 2.0 | 1.5 | 920 | $1,595 | $1.73 | 16d | 1 | 0.07mi |
| 7911 SE King Rd Portland, OR | 2.0 | 1.5 | 920 | $1,700 | $1.85 | 44d | 1 | 0.07mi |
| 7911 SE King Rd Portland, OR | 2.0 | 1.5 | 920 | $1,700 | $1.85 | 22d | 1 | 0.07mi |
| 7911 SE King Rd Unit 38 Milwaukie, OR | 2.0 | 1.5 | 920 | $1,495 | $1.62 | 24d | 1 | 0.09mi |
| 7915 SE King Rd Portland, OR | 2.0 | 1.0 | 925 | $1,800 | $1.95 | 4d | 2 | 0.10mi |
| 7707 SE Otty St Portland, OR | 3.0 | 1.0 | 828 | $2,245 | $2.71 | 17d | 1 | 0.26mi |
| 8057 SE Monroe St Portland, OR | 2.0 | 2.0 | 900 | $1,799 | $2.00 | 2d | 1 | 0.28mi |
| 7946 SE Monroe St Unit 7958 Milwaukie, OR | 2.0 | 1.0 | 775 | $1,499 | $1.93 | 44d | 1 | 0.31mi |
| 8495 SE Otty Rd Unit duplex Happy Valley, OR | 3.0 | 1.0 | 924 | $2,100 | $2.27 | 44d | 1 | 0.31mi |
| 10411 SE Cook Ct Portland, OR | 2.0 | 2.0 | 893 | $1,885 | $2.11 | 15d | 1 | 0.45mi |
| 10411 SE Cook Ct Portland, OR | 2.0 | 2.0 | 893 | $1,765 | $1.98 | 44d | 1 | 0.45mi |
| 11444 SE Fuller Rd Milwaukie, OR | 2.0 | 1.0 | 836 | $1,550 | $1.85 | 24d | 2 | 0.65mi |
| 8942 SE 79th Pl Unit 8942 Portland, OR | 2.0 | 1.0 | 1000 | $1,395 | $1.40 | 2d | 1 | 0.66mi |
| 8950 SE 79th Pl Portland, OR | 2.0 | 1.0 | 1000 | $1,472 | $1.47 | 24d | 4 | 0.66mi |
| 8950 SE 79th Pl Portland, OR | 2.0 | 1.0 | 1000 | $1,495 | $1.50 | 22d | 1 | 0.66mi |
| 8366 SE Causey Ave Happy Valley, OR | 2.0 | 1.0 | 828 | $1,800 | $2.17 | 15d | 10 | 0.66mi |
| 8366 SE Causey Ave Happy Valley, OR | 2.0 | 1.0 | 828 | $1,800 | $2.17 | 2d | 9 | 0.66mi |
| 9009 SE Causey Ave Happy Valley, OR | 1.0–2.0 | 1.0–2.0 | 863 | $1,535 | $1.78 | 44d | 1 | 0.67mi |
| 8640 SE Causey Ave Happy Valley, OR | 1.0–3.0 | 1.0–2.0 | 925 | $1,899 | $2.05 | 3d | 12 | 0.68mi |
| 11556 SE Fuller Rd Portland, OR | 2.0 | 1.0 | 870 | $1,550 | $1.78 | 12d | 5 | 0.71mi |
| 9985 SE 65th Ave Portland, OR | 2.0 | 1.0 | 925 | $1,822 | $1.97 | 11d | 2 | 0.73mi |
| 11408 SE 90th Ave Unit 1214 Happy Valley, OR | 2.0 | 1.0 | 880 | $1,625 | $1.85 | 20d | 1 | 0.78mi |
| 11408 SE 90th Ave Unit 1033 Happy Valley, OR | 2.0 | 1.0 | 880 | $1,525 | $1.73 | 24d | 1 | 0.78mi |
| 11408 SE 90th Ave Happy Valley, OR | 1.0–2.0 | 1.0 | 850 | $1,625 | $1.91 | 8d | 5 | 0.78mi |
| 11408 SE 90th Ave Happy Valley, OR | 2.0 | 1.0 | 880 | $1,625 | $1.85 | 24d | 1 | 0.78mi |
| 8800 SE Causey Loop Happy Valley, OR | 2.0 | 1.0–2.0 | 680 | $1,866 | $2.74 | 2d | 22 | 0.78mi |
| 11299 SE Stevens Rd Happy Valley, OR | 2.0 | 2.0 | 944 | $1,675 | $1.77 | 22d | 1 | 1.00mi |
| 11299 SE Stevens Rd Happy Valley, OR | 2.0 | 2.0 | 944 | $1,688 | $1.79 | 15d | 5 | 1.00mi |
| 11430 SE Stevens Rd Happy Valley, OR | 1.0–3.0 | 1.0–2.0 | 1010 | $2,550 | $2.52 | 2d | 8 | 1.04mi |
| 9701 SE Johnson Creek Blvd Happy Valley, OR | 1.0–2.0 | 1.0–2.0 | 937 | $3,234 | $3.45 | 2d | 20 | 1.04mi |
| 5733 SE King Rd Unit 5753 Milwaukie, OR | 2.0 | 1.0 | 1000 | $1,699 | $1.70 | 44d | 1 | 1.11mi |
| 8104 SE 72nd Ave Portland, OR | 2.0 | 1.0 | 1000 | $2,195 | $2.19 | 3d | 1 | 1.16mi |
| 12025 SE Stevens Rd Happy Valley, OR | 3.0 | 1.5 | 1100 | $1,550 | $1.41 | 3d | 1 | 1.17mi |
| 6515 SE Aspen St Portland, OR | 3.0 | 1.0 | 1100 | $2,325 | $2.11 | 8d | 1 | 1.22mi |
| 8300 SE Flavel St Unit 102 Portland, OR | 2.0 | 1.0 | 1011 | $1,650 | $1.63 | 44d | 1 | 1.35mi |
| 8304 SE Flavel St Portland, OR | 2.0 | 1.0 | 650 | $1,695 | $2.61 | 44d | 1 | 1.36mi |
| 8860 SE Flavel St Unit 6 Portland, OR | 2.0 | 1.0 | 806 | $1,469 | $1.82 | 24d | 1 | 1.37mi |
| 8860 SE Flavel St Unit 51 Portland, OR | 2.0 | 1.0 | 806 | $1,449 | $1.80 | 44d | 1 | 1.37mi |
| 8860 SE Flavel St Unit 46 Portland, OR | 2.0 | 1.0 | 806 | $1,469 | $1.82 | 44d | 1 | 1.37mi |
Listing history 4 events
-
2026-06-02days on market $125,000 Active 103 DOM
-
2026-06-01days on market $125,000 Active 102 DOM
-
2026-05-31days on market $125,000 Active 101 DOM
-
2026-02-19$125,000 Active 228-char remark
Show marketing remark (228 chars)
Comfortable manufactured home with ample and new kitchen, 3 bedrooms, 2 full bath, wood flooring throughout the house, Bedroom in the back could be used as a Studio. A/C, newer electrical wires and panel insulation all around.
ⓘ Source: listings_history table (triggers on properties + properties_extension) + one-shot
backfill from property_details.listing_events for pre-trigger history.
Climate risk First Street
- Flood 1/10 Low FEMA zone X (unshaded) · 0% chance over 30 yrs
- Wildfire 1/10 Low
- Heat 3/10 Moderate 7 d/yr ≥92°F today · 15 d/yr by 30 yrs out
- Wind 1/10 Low
- Air quality 10/10 Extreme 18 unhealthy d/yr today · 20 by 30 yrs out
Nearby sold comps map
Loading sold comps map…
Walkable amenities ~0.75 mi
Loading nearby amenities…
Taxation est. · year 1
- Rental income
- $22,006
- − Mortgage interest
- −$7,002
- − Property taxes
- −$1,875
- − Insurance
- −$625
- − Repairs & maintenance
- −$1,760
- − Management
- −$1,760
- − Depreciation
- −$3,636
- Taxable income
- $5,347
- Est. tax owed @ 24.0%
- −$1,283
- After-tax cash flow
- $5,735/yr
For passive investors: Depreciation is non-cash, so a rental often shows a tax loss while cash-flowing — sheltering income. Rental losses are passive: they offset passive income freely, and up to $25,000/yr can offset ordinary (W-2) income if you actively participate and your MAGI is under $100k (phasing out to $0 by $150k); unused losses carry forward. On sale, claimed depreciation is recaptured at up to 25%, and gains may owe capital-gains tax (a 1031 exchange can defer both). Figures are a year-1 estimate at your 24.0% rate — not tax advice; consult a CPA.
Schools (NCES district)
- District
- North Clackamas SD 12
- NCES district ID
- 4108830
- Math proficiency
- 29% ▼ -14.00%
- Reading proficiency
- 43% ▼ -13.00%
- Median HH income
- $60,217
- Composite
- 32.1/100
- National rank
- #5807
- State rank
- #22 of 58 in OR
Livability — Portland
- Score
- 77/100
- State rank
- #72
- US rank
- #3256
Category grades
Schools grade is shown separately in the Schools card above.
Census & demographics
- County
- Clackamas County · 361,406 people
- City population
- 774,334
- Metro
- Portland-Vancouver-Hillsboro, OR-WA
- Population (ZIP)
- 36,398
- Household income
- $83,119
- Rent vs Own
- Severe rent burden
- 1823.0
Population outlook (Clackamas County) Hauer SSP2
- Today (2025)
- 458,456 people
- By 2030
- 485,185 · +5.8%
- By 2040
- 532,932 · +16.2%
- By 2050
- 574,445 · +25.3%
- By 2075
- 665,497 · +45.2%
- By 2100
- 697,488 · +52.1%
Race, ethnicity, and origin ACS 2023
- Neighborhood character
- Predominantly White (75%)
- Race & ethnicity
- White 75% Hispanic / Latino 13% Two or more races 12% Asian 3% Black 1%
- Hispanic origin (detail)
- Mexican 8% Puerto Rican 1%
- Common ancestry
- Slovak 3% Italian 3% Portuguese 3%
- Foreign-born
- 7% · Canada
- Languages at home
- 89% English-only · Spanish 6% Russian/Polish/Slavic 2% Arabic 1%
Political lean MEDSL · Clackamas
- 2024 margin
- Lean D (+9.7) · D 53.4% · R 43.6% · Other 3.0%
- 2008→2024 swing
- -0.6pp no change · 2008: 10.4pp · 2024: 9.7pp
- All cycles
- 2024: D+9.7 2020: D+11.1 2016: D+6.1 2012: D+3.5 2008: D+10.4
Not yet ingested
- Civics
- —
Market trends
- HPI YoY
- ▼ -447.07%
- Current HPI
- 306.8458
- Rent YoY
- ▼ -0.82%
- Metro
- Portland-Vancouver-Hillsboro, OR-WA
- State GDP YoY
- ▲ 2.05%
- F500 in state
- 2
Industry mix (Fortune 500 HQ in OR)
| Industry | F500 HQs | Revenue |
|---|---|---|
| Consumer Goods | 1 | $51B |
|
||
Price history
1 event — show timeline
- 2026-02-19 Listed $125,000 RMLS
Property tax history
+3.2%/yrLatest (2018): $188 · +10.9% YoY. Source: county tax records.
Cash-flow waterfall
monthlySold comps — $/sqft
last 12 mo · ≤1 miLoading sold comps…