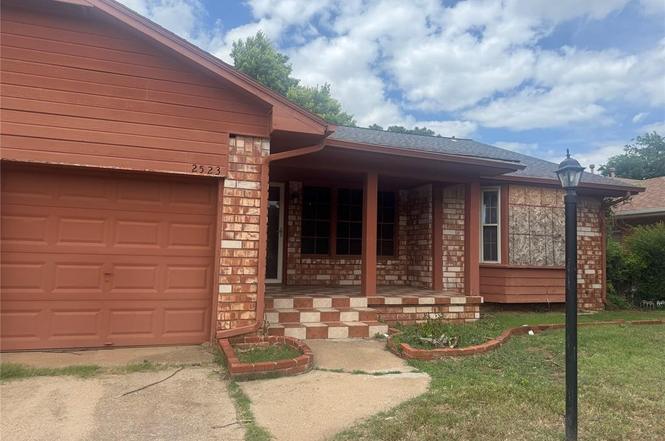
2523 NW 44th St · Oklahoma City, OK
Flood risk 1/10 · Minimal
- FEMA flood zone
- X (unshaded)
- Chance of flooding over 30 yrs
- 0.0%
- Est. flood insurance / yr
- $507 – $1,088
Fire risk 1/10 · Minimal
- Est. fire insurance / yr
- $2,463 – $4,575
Heat risk 6/10 · Moderate
- Hot days now (above 107°F)
- 7 days/yr
- Hot days in 30 yrs
- 19 days/yr
Wind risk 2/10 · Minimal
- Chance of severe wind over 30 yrs
- 3.0%
Air-quality risk 2/10 · Minimal
- Unhealthy air days now
- 1 days/yr
- Unhealthy air days in 30 yrs
- 2 days/yr
Risk factors via First Street. Map © Google.
Why this score? — see what drove the C- grade
The composite is a weighted blend of 9 inputs, each scored 0–100. Each bar is that input's sub-score; the figure is the points it added to the 100-point composite (weight × sub-score).
- Cash flow +22.3/30.0
- ARV discount +7.5/15.0
- DSCR +7.2/10.0
- 1% rule +4.8/10.0
- Livability +4.0/5.0
- Rent growth +3.7/5.0
- Condition / age +2.5/5.0
- Schools +0.7/10.0
- Appreciation +0.0/10.0
$150,000
🖨 Deal sheet 📄 Offer letter ✓ Due diligence
Listing remarks MLS
Charming home with great curb appeal!! Fantastic neighborhood near Smitty Park; newer AC unit, wood floors, siding, & tile on back patio since '04. Second living could be fabulous master with huge FP & picture window overlooking the private treed backyard; Hurry to see!!
Key facts
- 8,398 sq ft lot
- 2 garage spots
- Built 1958
Property features AI
Finance
- Other: Located in Liberty Heights addition; Directions: SW of 50th and May; Owner is an associate of the brokerage
- Financial info: Not assumable; Financing qualification allowed
- HOA & community: No mandatory association dues
Exterior
- Parking: 2-car garage
- Security: No storm shelter
- Utilities: No flood insurance required (per listing); No additional utility details provided
- Home design: Single family residence; One level; Existing property
- Construction: Brick and frame construction; Shingle roof; Conventional foundation; Living area reported as 1,559 (source: assessor)
- Exterior features: Interior lot; No additional exterior features listed
Interior
- Kitchen: No kitchen appliance details provided
- Bedrooms: 3 bedrooms
- Flooring: No flooring details provided
- Bathrooms: 2 full bathrooms
- Heating & cooling: No heating or cooling details provided
- Interior features: One living area; Gas log fireplace; No in-law plan indicated
- Laundry & utility: No laundry details provided
Neighborhood map
What this means for you Summary
Snapshot
- This is a 3-bed/2.0-bath other listed at $150k.
Deal economics
- At list price, monthly cash flow is $248 ($3k/yr) — positive.
- The deal already cash-flows at list — no discount required.
- To meet the 1% rule (rent ≥ 1% of price), the offer needs to be $146k (2.3% below list).
- Recommended offer: $146k (2.3% below list) — sets the bar for 1% rule.
- Cap rate 8.3% vs local median 3.7% in Oklahoma City — top-decile yield for the area; either an underpriced asset or a hidden risk that comps aren't pricing in. Stress-test before assuming the spread holds.
Location & tenants
- Location reads 80/100 on livability (#3 in OK, #1,635 nationally) — a professional / high-income tenant draw. Strengths: amenities A+, commute A+, cost of living A+; Watch: crime F.
- Oklahoma City (urban): math 7% / reading 10% proficiency, ranked #254 of 270 in OK (top 94%) — low school quality limits family demand, transient renter base, plan for 1-2y turnover; 82% free/reduced lunch — lower-income household profile, screen leases tightly.
- Zoned schools: Monroe Es (math 12% / reading 12%, grade F, #667 of 845 statewide, top 82%, 323 students, 0% FRL); Northwest Classen Hs (math 5% / reading 10%, grade F, #420 of 447 statewide, top 95%, 1,702 students, 0% FRL) — zoned schools average 0% FRL vs 82% district-wide (82 pts lower); this property's tenant base skews higher-income than the district average.
- Market conditions: Rents rising fast (+4.8%/yr); 192 active listings in the ZIP; 40 comparable units currently listed for rent nearby; rentals at typical pace (median 21d on market — plan ~3-4 weeks tenant-placement turnaround); 5,365 units permitted in Oklahoma County in 2024 (569 in 5+ unit buildings).
- This rent runs 30% of the median local income ($58k/yr) — at the standard rent-burdened threshold; future hikes will face affordability resistance.
Forward outlook
- Local home prices are declining (-3.0%/yr); year-one equity from $1k of loan paydown is wiped out by about $4k of value loss. Plan a longer hold.
- Oklahoma County population projected at +41% by 2050 — long-run rental-demand tailwind backs the buy-and-hold thesis.
Negotiation context
- Only 7 days on market — expect competitive offers; lowballing is unlikely to land.
- 3 sale attempts since 24y ago with the ask held roughly flat each time — persistent listings suggest the price (not the market) is what's stuck; bring a comps-based counter.
- Current owner paid $125k; 20% above their basis — modest negotiation headroom, anchor on the comps not their cost.
Risks & watch-outs
- Watch-outs: built in 1958 — expect roof / HVAC / electrical / plumbing capex.
- Climate carrying-cost: extreme-heat days projected 7→19/yr by 2055 (HVAC capex compounding) — expect insurance premiums to compound above CPI over the hold.
Questions for the listing agent
- Built in 1958 — when were the roof, HVAC, electrical panel, plumbing, and water heater last replaced?
- Is there a deadline driving the sale (1031 exchange, divorce, estate, relocation)? That informs how much negotiation room exists.
- Schools are F-rated, which usually means shorter tenancies and higher turnover. Who's the typical renter profile here, and what's been the actual vacancy rate?
- Crime grade is F in this area — have there been break-ins, vandalism, or insurance claims at this property in the last 3 years? What carrier currently insures it and at what premium?
- What's the average days-on-market for RENTAL listings here right now (not sales)? A rising rental-DOM trend means longer vacancies and softer asking-rent achievability than the comps imply.
- What's the recent tenant-quality profile in this submarket — average credit score on applications, eviction rate, late-payment / NSF rate, and stable-employment percentage? A property-management company in the area should have these aggregated.
- How much new for-sale + rental construction is in the pipeline within 1–3 miles? Heavy new supply typically softens prices + rents 12–24 months out; constrained supply supports both.
Investment metrics
- 1% rule
- 0.98% ✗
- Cap rate
- 8.28%
- Cash-on-cash
- 7.08%
- DSCR
- 1.32
- GRM
- 8.5
CMA / ARV
No comps found within radius.
Projected returns pro-forma
-3.0% appreciation · 4.8% rent growth · sell at horizon
- IRR
- -3.7%
- Equity multiple
- 0.86×
- Total profit
- $-5,877
- Equity at exit
- $22,365
- IRR
- 7.8%
- Equity multiple
- 1.63×
- Total profit
- $26,477
- Equity at exit
- $12,969
Cash invested: $42,000 (down + closing). Projections, not guarantees.
Landlord ↔ Tenant lean methodology
- Overall (STATE)
- 83 Strongly Landlord-Friendly
- State Oklahoma
- 83 Strongly Landlord-Friendly · R+20
- County
- — inherits STATE
- City
- — inherits STATE
ZIP-level market 73112
- Rents YoY
- 4.8%
- Active inventory
- 192
- Price-to-rent
- 8.5×
Monthly cashflow live
- Estimated rent
- $1,465 high interval (Pro) →
- Mortgage (P&I)
- −$787
- Tax from tax record
- −$60 /mo · $725/yr
- Insurance
- −$62
- HOA
- −$0
- Vacancy / Maint / Mgmt
- −$308
- Net cashflow
- $248
Break-even live
UW: 25.0% down · 7.5% · 30yr · 1.5% tax · 5.0% vac · 8.0% maint · 8.0% mgmt
Financing live
Cash to close
- Down payment
- $37,500
- Closing costs
- $4,500
- Reserves months
- —
- Total cash needed
- —
Loan-product check · same deal, 3 products live
Conventional
25% down · 7.5% · 30yr
- Down + closing
- —
- Monthly P&I
- —
- Monthly cashflow
- —
- DSCR
- —
- Eligible?
- —
Personal DTI + credit; lowest rate.
DSCR
20% down · 8.5% · 30yr
- Down + closing
- —
- Monthly P&I
- —
- Monthly cashflow
- —
- DSCR
- —
- Eligible?
- —
No personal income docs; deal must DSCR.
Hard money
10% down · 12.0% · 12mo
- Down + closing
- —
- Monthly P&I
- —
- Monthly cashflow
- —
- DSCR
- —
- Eligible?
- —
Short-term bridge; refi at stabilization.
Rent comps 40 comps
| Address | Beds | Baths | Sqft | Rent | $/sqft | DOM | Units | Dist |
|---|---|---|---|---|---|---|---|---|
| 2507 NW 44th St Oklahoma City, OK | 2.0 | 2.0 | 1379 | $1,550 | $1.12 | 2d | 1 | 0.07mi |
| 2449 NW 42nd St Oklahoma City, OK | 3.0 | 1.0 | 1070 | $1,200 | $1.12 | 43d | 1 | 0.12mi |
| 4501 N Youngs Blvd Oklahoma City, OK | 2.0 | 2.0 | 1665 | $1,550 | $0.93 | 43d | 1 | 0.31mi |
| 4211 N Youngs Blvd Unit 216 Oklahoma City, OK | 2.0 | 2.0 | 1100 | $950 | $0.86 | 23d | 1 | 0.36mi |
| 4211 N Youngs Blvd Unit 217 Oklahoma City, OK | 2.0 | 2.0 | 1100 | $1,050 | $0.95 | 3d | 1 | 0.36mi |
| 2701 NW 48th St Oklahoma City, OK | 3.0 | 2.0 | 1949 | $1,875 | $0.96 | 21d | 1 | 0.37mi |
| 2424 NW 39th St Oklahoma City, OK | 2.0 | 1.0–1.5 | 787 | $850 | $1.08 | 3d | 4 | 0.42mi |
| 4301 N Pennsylvania Ave Unit M 200 Oklahoma City, OK | 2.0 | 1.5 | 1100 | $1,195 | $1.09 | 23d | 1 | 0.57mi |
| 2225 NW 50th St Oklahoma City, OK | 3.0 | 2.5 | 1330 | $1,445 | $1.09 | 23d | 1 | 0.58mi |
| 5200 N Oak St Oklahoma City, OK | 3.0 | 1.0–2.5 | 1080 | $3,979 | $3.68 | 1d | 64 | 0.61mi |
| 2037 NW 46th St Oklahoma City, OK | 3.0 | 2.0 | 1336 | $1,535 | $1.15 | 2d | 1 | 0.65mi |
| 2029 NW 46th St Oklahoma City, OK | 3.0 | 2.0 | 1109 | $1,550 | $1.40 | 2d | 1 | 0.67mi |
| 2025 NW 46th St Oklahoma City, OK | 3.0 | 1.5 | 1080 | $1,495 | $1.38 | 21d | 1 | 0.68mi |
| 3915 N Pennsylvania Ave Oklahoma City, OK | 2.0 | 2.0 | 1065 | $1,495 | $1.40 | 43d | 1 | 0.69mi |
| 3633 N Youngs Blvd Oklahoma City, OK | 3.0 | 2.5 | 1404 | $1,450 | $1.03 | 4d | 1 | 0.70mi |
| 5113 N Brookline Ave Oklahoma City, OK | 2.0 | 1.0 | 1100 | $1,000 | $0.91 | 2d | 1 | 0.76mi |
| 3160 Nimitz Blvd Oklahoma City, OK | 3.0 | 1.0 | 1068 | $1,195 | $1.12 | 44d | 1 | 0.87mi |
| 5320 N Drexel Blvd Oklahoma City, OK | 3.0 | 2.5 | 1982 | $1,980 | $1.00 | 2d | 1 | 0.90mi |
| 3221 NW 39th Ter Oklahoma City, OK | 3.0 | 1.0 | 1073 | $1,350 | $1.26 | 17d | 1 | 0.90mi |
| 1809 NW 39th St Oklahoma City, OK | 3.0 | 2.0 | 1318 | $1,625 | $1.23 | 2d | 1 | 0.92mi |
| 4009 N Indiana Ave Oklahoma City, OK | 4.0 | 3.0 | 2132 | $2,695 | $1.26 | 43d | 1 | 0.94mi |
| 3617 1/2 N Drexel Blvd Oklahoma City, OK | 2.0 | 1.5 | 1343 | $1,150 | $0.86 | 2d | 1 | 0.96mi |
| 3609 N Drexel Blvd Unit 3611 Oklahoma City, OK | 2.0 | 2.0 | 1375 | $1,200 | $0.87 | 23d | 1 | 0.98mi |
| 3611 N Drexel Blvd Oklahoma City, OK | 2.0 | 2.0 | 1375 | $1,200 | $0.87 | 23d | 1 | 0.98mi |
| 3312 NW 45th Ter Oklahoma City, OK | 3.0 | 1.5 | 1422 | $1,425 | $1.00 | 11d | 1 | 0.98mi |
| 2928 NW 33rd St Oklahoma City, OK | 3.0 | 2.0 | 1450 | $1,600 | $1.10 | 43d | 1 | 0.99mi |
| 3235 NW 50th St Oklahoma City, OK | 2.0 | 2.0 | 1216 | $1,120 | $0.92 | 4d | 1 | 1.02mi |
| 2037 NW 32nd Ter Oklahoma City, OK | 2.0 | 1.5 | 1053 | $1,100 | $1.04 | 43d | 1 | 1.05mi |
| 1606 NW 45th St Oklahoma City, OK | 3.0 | 2.0 | 1325 | $1,700 | $1.28 | 43d | 1 | 1.06mi |
| 3608 N Independence Ave Oklahoma City, OK | 3.0 | 2.0 | 1597 | $1,600 | $1.00 | 23d | 1 | 1.08mi |
| 4861 N Blackwelder Ave Oklahoma City, OK | 1.0–2.0 | 1.0–2.0 | 975 | $985 | $1.01 | 4d | 6 | 1.09mi |
| 2109 NW 31st St Oklahoma City, OK | 3.0 | 1.0 | 1289 | $1,350 | $1.05 | 2d | 1 | 1.10mi |
| 3100 Northwest Expy Oklahoma City, OK | 1.0–3.0 | 1.0–2.5 | 1029 | $1,437 | $1.40 | 1d | 57 | 1.11mi |
| 2400 NW 30th St Oklahoma City, OK | 2.0 | 2.0 | 1078 | $1,289 | $1.20 | 43d | 1 | 1.12mi |
| 2400 NW 30th St Oklahoma City, OK | 1.0–2.0 | 1.0–2.0 | 801 | $1,279 | $1.60 | 2d | 11 | 1.13mi |
| 1600 NW 38th St Oklahoma City, OK | 3.0 | 2.0 | 1850 | $2,400 | $1.30 | 2d | 1 | 1.16mi |
| 1832 NW 33rd St Oklahoma City, OK | 4.0 | 2.0 | 1464 | $1,700 | $1.16 | 43d | 1 | 1.17mi |
| 3407 NW 39th St Oklahoma City, OK | 3.0 | 2.0 | 1400 | $1,240 | $0.89 | 23d | 1 | 1.17mi |
| 1731 NW 32nd St Unit 15 Oklahoma City, OK | 3.0 | 2.0 | 1200 | $1,175 | $0.98 | 21d | 1 | 1.27mi |
| 2518 NW 62nd St Oklahoma City, OK | 3.0 | 2.0 | 1953 | $1,695 | $0.87 | 43d | 1 | 1.27mi |
Listing history 6 events
-
2026-06-18days on market $150,000 Active 7 DOM
-
2026-06-17days on market $150,000 Active 6 DOM
-
2026-06-16days on market $150,000 Active 5 DOM
-
2026-06-15days on market $150,000 Active 4 DOM
-
2026-06-13remarks 571-char remark
-
2026-06-13$150,000 Active 2 DOM
ⓘ Source: listings_history table (triggers on properties + properties_extension) + one-shot
backfill from property_details.listing_events for pre-trigger history.
Tax reassessment forecast OK · Resets to sale price
- Current annual tax
- $725 · $60/mo
- Projected year-2 tax
- $1,350 · $112/mo
- Expected delta
- +$625/yr (+$52/mo · 86.3%)
ⓘ Screening estimate from a state-policy table — verify with the county assessor before closing.
Climate risk First Street
- Flood 1/10 Low FEMA zone X (unshaded) · 0% chance over 30 yrs
- Wildfire 1/10 Low
- Heat 6/10 Major 7 d/yr ≥107°F today · 19 d/yr by 30 yrs out
- Wind 2/10 Low 3% chance of damaging wind over 30 yrs
- Air quality 2/10 Low 1 unhealthy d/yr today · 2 by 30 yrs out
Nearby sold comps map
Loading sold comps map…
Walkable amenities ~0.75 mi
Loading nearby amenities…
Taxation est. · year 1
- Rental income
- $17,580
- − Mortgage interest
- −$8,402
- − Property taxes
- −$725
- − Insurance
- −$750
- − Repairs & maintenance
- −$1,406
- − Management
- −$1,406
- − Depreciation
- −$4,364
- Taxable income
- $526
- Est. tax owed @ 24.0%
- −$126
- After-tax cash flow
- $2,848/yr
For passive investors: Depreciation is non-cash, so a rental often shows a tax loss while cash-flowing — sheltering income. Rental losses are passive: they offset passive income freely, and up to $25,000/yr can offset ordinary (W-2) income if you actively participate and your MAGI is under $100k (phasing out to $0 by $150k); unused losses carry forward. On sale, claimed depreciation is recaptured at up to 25%, and gains may owe capital-gains tax (a 1031 exchange can defer both). Figures are a year-1 estimate at your 24.0% rate — not tax advice; consult a CPA.
Schools (NCES district)
- District
- Oklahoma City
- NCES district ID
- 4022770
- Math proficiency
- 7% ▼ -5.00%
- Reading proficiency
- 10% ▼ -6.00%
- Median HH income
- $35,606
- Composite
- 7.0/100
- National rank
- #9970
- State rank
- #254 of 270 in OK
Livability — Oklahoma City
- Score
- 80/100
- State rank
- #3
- US rank
- #1635
Category grades
Schools grade is shown separately in the Schools card above.
Census & demographics
- Census place
- Oklahoma City, OK
- County
- Oklahoma County · 771,644 people
- City population
- 498,656
- Metro
- Oklahoma City, OK
- Population (ZIP)
- 30,372
- Household income
- $58,419
- Rent vs Own
- Severe rent burden
- 1555.0
Population outlook (Oklahoma County) Hauer SSP2
- Today (2025)
- 911,875 people
- By 2030
- 982,413 · +7.7%
- By 2040
- 1,130,468 · +24.0%
- By 2050
- 1,288,422 · +41.3%
- By 2075
- 1,711,482 · +87.7%
- By 2100
- 2,088,448 · +129.0%
Race, ethnicity, and origin ACS 2023
- Neighborhood character
- Diverse neighborhood (Simpson 0.65)
- Race & ethnicity
- White 55% Hispanic / Latino 18% Black 13% Two or more races 12% Asian 4% Native American 3%
- Hispanic origin (detail)
- Mexican 12%
- Common ancestry
- Italian 3% Lithuanian 2% Slovak 2%
- Foreign-born
- 12% · Canada, Vietnam, China
- Languages at home
- 82% English-only · Spanish 12% Other Indo-European 1% Vietnamese 1%
Political lean MEDSL · Oklahoma
- 2024 margin
- Toss-up / Even · D 48.0% · R 49.7% · Other 2.3%
- 2008→2024 swing
- +15.1pp toward D · 2008: -16.8pp · 2024: -1.7pp
- All cycles
- 2024: R+1.7 2020: R+1.1 2016: R+10.5 2012: R+16.7 2008: R+16.8
Not yet ingested
- Civics
- —
Market trends
- HPI YoY
- ▼ -283.17%
- Current HPI
- 253.682
- Rent YoY
- ▲ 4.80%
- Metro
- Oklahoma City, OK
- State GDP YoY
- ▲ 1.55%
- F500 in state
- 6
Industry mix (Fortune 500 HQ in OK)
| Industry | F500 HQs | Revenue |
|---|---|---|
| Energy | 3 | $48B |
|
||
Price history
+105.5% since first listed9 events — show timeline
- 2026-06-08 Listed $150,000 MLSOK
- 2007-07-10 Sold (Public Records) $125,000 Public Records
- 2007-05-25 Sold (MLS) $125,000 MLSOK
- 2007-04-20 Listed $129,000 MLSOK
- 2002-10-09 Sold (Public Records) $89,000 Public Records
- 2002-10-09 Sold (MLS) $89,000 MLSOK
- 2002-08-26 Listed $91,000 MLSOK
- 1987-11-30 Sold (Public Records) $63,000 Public Records
- 1982-01-01 Sold (Public Records) $73,000 Public Records
Property tax history
-5.7%/yrLatest (2025): $725 · -0.8% YoY. Source: county tax records.
Cash-flow waterfall
monthlySold comps — $/sqft
last 12 mo · ≤1 miLoading sold comps…