 🏷️ Likely Rental
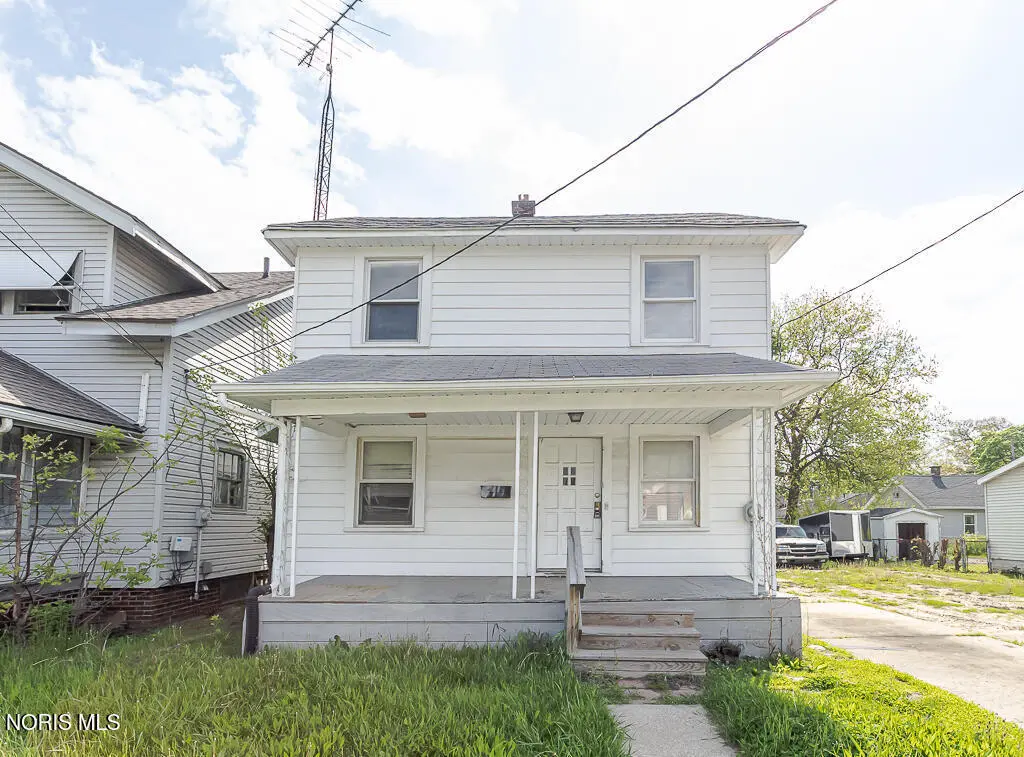
3340 Upton Ave · Toledo, OH
Flood risk 1/10 · Minimal
- FEMA flood zone
- X (unshaded)
- Chance of flooding over 30 yrs
- 0.0%
- Est. flood insurance / yr
- $473 – $860
Fire risk 1/10 · Minimal
- Est. fire insurance / yr
- $713 – $1,323
Heat risk 3/10 · Minor
- Hot days now (above 101°F)
- 7 days/yr
- Hot days in 30 yrs
- 16 days/yr
Wind risk 2/10 · Minimal
- Chance of severe wind over 30 yrs
- —
Air-quality risk 2/10 · Minimal
- Unhealthy air days now
- 1 days/yr
- Unhealthy air days in 30 yrs
- 3 days/yr
Risk factors via First Street. Map © Google.
Why this score? — see what drove the B- grade
The composite is a weighted blend of 9 inputs, each scored 0–100. Each bar is that input's sub-score; the figure is the points it added to the 100-point composite (weight × sub-score).
- Cash flow +30.0/30.0
- 1% rule +10.0/10.0
- DSCR +10.0/10.0
- ARV discount +7.5/15.0
- Rent growth +3.3/5.0
- Livability +3.3/5.0
- Condition / age +2.5/5.0
- Schools +1.6/10.0
- Appreciation +0.0/10.0
$39,900
🖨 Deal sheet (PDF) 📄 Offer letter ✓ Due diligence
Listing remarks MLS
Affordable housing ,Currently, tenant occupied month to month .rminor repairs are being made. Very spacious large living and dining. Breakfast nook Kitchen with lots of cupboards, maintenance-free siding, 2 car garage with opener. basement with rec room. A great buy. There is a vacant lot next door. Maybe bundled with 2 others for added discount 60937871656 Shady Dr & 6093791-3703 Jackman
Key facts
- 3,500 sq ft lot
- Garage
- Built 1927
Property features AI
Finance
- Other: Living area reported as 1,024 (source: public records); Lot approximately 0.08 acres (3,500 sq ft)
Exterior
- Parking: Detached garage with storage; Approximately 1.5 garage spaces; Total parking for 3 vehicles
- Utilities: Public water; Public sewer; Other utilities
- Home design: Residential single-family house; Detached (no common walls); Two levels / 2 stories; Entry facing not specified
- Construction: Vinyl siding; Block foundation; Built with typical house construction materials
- Exterior features: Storage; Shingle roof; Garage(s) as an additional structure; City street frontage; Asphalt road surface
Interior
- Kitchen: Kitchen on main level (16 x 7); Appliances: Other
- Bedrooms: Bedroom 2 on the upper level; Additional upper-level room (17 x 11)
- Flooring: Wood flooring
- Bathrooms: 1 full bathroom
- Heating & cooling: Forced air heating; Ceiling fans for cooling; Has heating and cooling
- Interior features: Five total rooms; Basement (block); Storage; Other interior features
- Laundry & utility: Laundry located in basement
Neighborhood map
What this means for you Summary
Snapshot
- This is a 2-bed/1.0-bath single-family listed at $40k.
Deal economics
- At list price, monthly cash flow is $540 ($6k/yr) — positive.
- The deal already cash-flows at list — no discount required.
- Meets the 1% rule at list price ($1k rent vs $40k).
- Cap rate 22.5% vs local median 7.6% in Toledo — top-decile yield for the area; either an underpriced asset or a hidden risk that comps aren't pricing in. Stress-test before assuming the spread holds.
Location & tenants
- Location reads 66/100 on livability (#645 in OH) — a middle-class / working-renter tenant base. Strengths: cost of living A+, housing A+, health & safety A+; Watch: amenities C-, crime F, commute F.
- Toledo City (urban): math 15% / reading 24% proficiency, ranked #634 of 656 in OH (top 97%) — low school quality limits family demand, transient renter base, plan for 1-2y turnover; 72% free/reduced lunch — lower-income household profile, screen leases tightly.
- Zoned schools: Mckinley Stemm Academy (math 2% / reading 12%, grade F, #1,527 of 1,584 statewide, top 98%, 279 students, 0% FRL); Start High School (math 11% / reading 33%, grade F, #672 of 781 statewide, top 86%, 1,242 students, 50% FRL) — zoned schools average 25% FRL vs 72% district-wide (47 pts lower); this property's tenant base skews higher-income than the district average.
- Market conditions: Rents rising (+3.3%/yr); 111 active listings in the ZIP; 40 comparable units currently listed for rent nearby; rentals lingering (median 44d on market — plan ~5-8 weeks vacancy on turnover, expect pricing pressure); 52% of comp listings sitting > 30 days — soft ceiling on asking rent; 415 units permitted in Lucas County in 2024 (122 in 5+ unit buildings).
Forward outlook
- Local home prices are declining (-3.0%/yr); year-one equity from $276 of loan paydown is wiped out by about $1k of value loss. Plan a longer hold.
- Lucas County population projected at -16% by 2050 — secular population decline; favor cash flow + early exit over multi-decade hold.
- At projected returns (-3.0% appreciation + 3.3% rent growth), your $11k cash investment doubles in ~2 years — after that, you're playing with house money.
Negotiation context
- Only 7 days on market — expect competitive offers; lowballing is unlikely to land.
- 2 sale attempts since 11y ago; this cycle's ask has dropped $33k (45%) from the opening price — seller is motivated, your offer sets the floor, not the list.
Risks & watch-outs
- Watch-outs: built in 1927 — expect roof / HVAC / electrical / plumbing capex.
Questions for the listing agent
- Built in 1927 — when were the roof, HVAC, electrical panel, plumbing, and water heater last replaced?
- Is there a deadline driving the sale (1031 exchange, divorce, estate, relocation)? That informs how much negotiation room exists.
- Schools are D-rated, which usually means shorter tenancies and higher turnover. Who's the typical renter profile here, and what's been the actual vacancy rate?
- Crime grade is F in this area — have there been break-ins, vandalism, or insurance claims at this property in the last 3 years? What carrier currently insures it and at what premium?
- What's the average days-on-market for RENTAL listings here right now (not sales)? A rising rental-DOM trend means longer vacancies and softer asking-rent achievability than the comps imply.
- What's the recent tenant-quality profile in this submarket — average credit score on applications, eviction rate, late-payment / NSF rate, and stable-employment percentage? A property-management company in the area should have these aggregated.
- How much new for-sale + rental construction is in the pipeline within 1–3 miles? Heavy new supply typically softens prices + rents 12–24 months out; constrained supply supports both.
Investment metrics
- 1% rule
- 2.66% ✓
- Cap rate
- 22.52%
- Cash-on-cash
- 57.97%
- DSCR
- 3.58
- GRM
- 3.1
CMA / ARV
- ARV (on-the-fly)
- $84,992
- Comps found
- 12
Show comp detail 12 sales within ~0.75 mi
| Address | Dist | Beds/Ba | Sqft | Sold | Price | $/sf | Match |
|---|---|---|---|---|---|---|---|
| 1822 Stahlwood Ave | 0.19mi | 2/1.0 | 1,047 (+2%) | 2mo | $74,000 | $71 | 85 |
| 1929 Marlow Rd | 0.13mi | 2/1.0 | 1,072 (+5%) | 2mo | $108,000 | $101 | 85 |
| 2040 Fairfax Rd | 0.23mi | 3/1.0 (+1) | 1,068 (+4%) | 2mo | $85,000 | $80 | 75 |
| 1811 Giant St | 0.27mi | 3/1.0 (+1) | 1,069 (+4%) | 1mo | $70,000 | $65 | 75 |
| 1804 Loxley Rd | 0.26mi | 3/1.5 (+1) | 1,056 (+3%) | 1mo | $81,290 | $77 | 75 |
| 1822 Wychwood St | 0.07mi | 3/1.0 (+1) | 1,162 (+14%) | 1mo | $84,000 | $72 | 68 |
| 3628 Wallwerth Dr | 0.41mi | 2/1.0 | 935 (-9%) | 2mo | $123,000 | $132 | 64 |
| 2014 Barrows St | 0.49mi | 3/1.0 (+1) | 1,069 (+4%) | 1mo | $110,000 | $103 | 64 |
| 1936 Mansfield St | 0.21mi | 3/1.0 (+1) | 1,168 (+14%) | 1mo | $79,900 | $68 | 61 |
| 1734 Barrows St | 0.48mi | 2/1.0 | 912 (-11%) | 1mo | $90,000 | $99 | 58 |
| 3621 Sherbrooke Rd | 0.50mi | 3/2.0 (+1) | 1,119 (+9%) | 1mo | $92,500 | $83 | 51 |
| 3515 Watson Ave | 0.60mi | 3/2.0 (+1) | 1,157 (+13%) | 0mo | $150,000 | $130 | 41 |
Match score weights: distance 35% · size 25% · config 20% · recency 20%. Top-matched comps best support the ARV.
Projected returns pro-forma
-3.0% appreciation · 3.3% rent growth · sell at horizon
- IRR
- 56.9%
- Equity multiple
- 3.53×
- Total profit
- $28,260
- Equity at exit
- $5,949
- IRR
- 61.9%
- Equity multiple
- 7.29×
- Total profit
- $70,318
- Equity at exit
- $3,450
Cash invested: $11,172 (down + closing). Projections, not guarantees.
Landlord ↔ Tenant lean methodology
- Overall (STATE)
- 73 Landlord-Friendly
- State Ohio
- 73 Landlord-Friendly · R+6
- County
- — inherits STATE
- City
- — inherits STATE
ZIP-level market 43613
- Home prices YoY
- -20.7%
- Rents YoY
- 3.3%
- Active inventory
- 111
- Price-to-rent
- 3.1×
Monthly cashflow live
- Estimated rent
- $1,061 high interval (Pro) →
- Mortgage (P&I)
- −$209
- Tax from tax record
- −$73 /mo · $874/yr
- Insurance
- −$17
- HOA
- −$0
- Vacancy / Maint / Mgmt
- −$223
- Net cashflow
- $540
Break-even live
Sensitivity live
| Price | -10% $562 | -5% $551 | +0% $540 | +5% $528 | +10% $517 |
|---|---|---|---|---|---|
| Rent | -10% $456 | -5% $498 | +0% $540 | +5% $582 | +10% $624 |
| Rate | -1.0pp $560 | -0.5pp $550 | base $540 | +0.5pp $529 | +1.0pp $519 |
UW: 25.0% down · 7.5% · 30yr · 1.5% tax · 5.0% vac · 8.0% maint · 8.0% mgmt
Financing live
Cash to close
- Down payment
- $9,975
- Closing costs
- $1,197
- Reserves months
- —
- Total cash needed
- —
Loan-product check · same deal, 3 products live
Conventional
25% down · 7.5% · 30yr
- Down + closing
- —
- Monthly P&I
- —
- Monthly cashflow
- —
- DSCR
- —
- Eligible?
- —
Personal DTI + credit; lowest rate.
DSCR
20% down · 8.5% · 30yr
- Down + closing
- —
- Monthly P&I
- —
- Monthly cashflow
- —
- DSCR
- —
- Eligible?
- —
No personal income docs; deal must DSCR.
Hard money
10% down · 12.0% · 12mo
- Down + closing
- —
- Monthly P&I
- —
- Monthly cashflow
- —
- DSCR
- —
- Eligible?
- —
Short-term bridge; refi at stabilization.
Rent comps 40 comps
| Address | Beds | Baths | Sqft | Rent | $/sqft | DOM | Units | Dist |
|---|---|---|---|---|---|---|---|---|
| 1731 Mansfield Rd Toledo, OH | 3.0 | 1.0 | 1138 | $1,195 | $1.05 | 24d | 1 | 0.22mi |
| 1838 Giant St Toledo, OH | 3.0 | 1.0 | 962 | $1,200 | $1.25 | 14d | 1 | 0.23mi |
| 1846 Loxley Rd Toledo, OH | 2.0 | 1.0 | 876 | $900 | $1.03 | 44d | 1 | 0.24mi |
| 1705 Marlow Rd Toledo, OH | 2.0 | 1.0 | 738 | $1,000 | $1.36 | 24d | 1 | 0.24mi |
| 1951 Loxley Rd Toledo, OH | 2.0 | 1.0 | 804 | $975 | $1.21 | 24d | 1 | 0.25mi |
| 3683 Upton Ave Toledo, OH | 3.0 | 1.0 | 1119 | $1,100 | $0.98 | 44d | 1 | 0.28mi |
| 1804 Bigelow St Toledo, OH | 3.0 | 1.0 | 995 | $937 | $0.94 | 44d | 1 | 0.30mi |
| 1718 Giant St Toledo, OH | 3.0 | 1.0 | 1080 | $1,395 | $1.29 | 14d | 1 | 0.30mi |
| 1732 Talbot St Toledo, OH | 2.0 | 1.0 | 840 | $995 | $1.18 | 24d | 1 | 0.34mi |
| 3801 Torrance Dr Unit 3801 4 Toledo, OH | 1.0 | 1.0 | 750 | $600 | $0.80 | 24d | 1 | 0.53mi |
| 1573 Jermain Dr Toledo, OH | 3.0 | 1.0 | 1254 | $1,195 | $0.95 | 14d | 1 | 0.55mi |
| 3835 Monroe St Toledo, OH | 2.0 | 1.0 | 1002 | $950 | $0.95 | 44d | 1 | 0.59mi |
| 3803 Monroe St Toledo, OH | 2.0 | 1.0 | 942 | $850 | $0.90 | 44d | 1 | 0.62mi |
| 1489 Berdan Ave Toledo, OH | 3.0 | 1.0 | 1068 | $1,250 | $1.17 | 44d | 1 | 0.63mi |
| 3817 Burton Ave Toledo, OH | 3.0 | 1.0 | 754 | $1,015 | $1.35 | 21d | 1 | 0.63mi |
| 2716 Hoehler Dr Toledo, OH | 1.0 | 1.0 | 720 | $600 | $0.83 | 44d | 1 | 0.65mi |
| 3430 Anderson Pkwy Toledo, OH | 3.0 | 2.0 | 1372 | $1,650 | $1.20 | 24d | 1 | 0.68mi |
| 3901 Leybourn Ave Toledo, OH | 3.0 | 1.0 | 840 | $1,150 | $1.37 | 24d | 1 | 0.72mi |
| 3433 Douglas Rd Unit 3 Toledo, OH | 1.0 | 1.0 | 750 | $755 | $1.01 | 14d | 1 | 0.77mi |
| 3713 Hazelhurst Ave Toledo, OH | 3.0 | 1.5 | 1352 | $1,700 | $1.26 | 44d | 1 | 0.78mi |
| 3640 Douglas Rd Toledo, OH | 1.0 | 1.0 | 720 | $784 | $1.09 | 44d | 1 | 0.79mi |
| 2802 Gunckel Blvd Toledo, OH | 2.0 | 1.0 | 860 | $1,100 | $1.28 | 44d | 1 | 0.79mi |
| 2244 W Sylvania Ave Unit 6 Toledo, OH | 2.0 | 1.0 | 800 | $795 | $0.99 | 44d | 1 | 0.81mi |
| 3644 Harley Rd Toledo, OH | 2.0 | 1.0 | 1025 | $975 | $0.95 | 24d | 1 | 0.84mi |
| 3725 Hoiles Ave Toledo, OH | 3.0 | 1.0 | 1180 | $1,245 | $1.06 | 24d | 1 | 0.85mi |
| 3805 Hoiles Ave Toledo, OH | 3.0 | 1.0 | 1370 | $1,025 | $0.75 | 24d | 1 | 0.86mi |
| 4038 Lyman Ave Toledo, OH | 3.0 | 1.0 | 1175 | $1,395 | $1.19 | 44d | 1 | 0.87mi |
| 3022 Letchworth Pkwy Toledo, OH | 2.0 | 1.0 | 800 | $970 | $1.21 | 44d | 1 | 0.87mi |
| 2734 Powhattan Pkwy Toledo, OH | 2.0 | 1.0 | 1144 | $900 | $0.79 | 44d | 1 | 0.89mi |
| 3541 Willys Pkwy Toledo, OH | 3.0 | 1.0 | 1113 | $1,400 | $1.26 | 44d | 1 | 0.91mi |
| 4120 Parrakeet Ave Toledo, OH | 3.0 | 2.0 | 1410 | $1,450 | $1.03 | 44d | 1 | 0.97mi |
| 4315 Garden Park Dr Toledo, OH | 3.0 | 1.0 | 1268 | $1,423 | $1.12 | 24d | 1 | 0.97mi |
| 1919 Ottawa Dr Unit 7 Toledo, OH | 2.0 | 1.0 | 900 | $800 | $0.89 | 44d | 1 | 1.02mi |
| 2356 Torrey Hill Dr Unit 11 Toledo, OH | 2.0 | 1.0 | 1050 | $800 | $0.76 | 44d | 1 | 1.03mi |
| 3915 Willys Pkwy Unit 3915 Toledo, OH | 3.0 | 1.0 | 1080 | $800 | $0.74 | 21d | 1 | 1.03mi |
| 4290 Monroe St Unit 4 Toledo, OH | 1.0 | 1.0 | 850 | $695 | $0.82 | 44d | 1 | 1.09mi |
| 2322 Upton Ave Toledo, OH | 3.0 | 1.0 | 1000 | $1,300 | $1.30 | 44d | 1 | 1.09mi |
| 4223 Birchall Rd Toledo, OH | 3.0 | 1.0 | 1338 | $1,395 | $1.04 | 24d | 1 | 1.10mi |
| 4435 Jackman Rd Toledo, OH | 1.0–2.0 | 1.0 | 725 | $922 | $1.27 | 14d | 3 | 1.11mi |
| 2347 Rosedale Ave Toledo, OH | 2.0 | 1.0 | 767 | $875 | $1.14 | 44d | 1 | 1.12mi |
Listing history 9 events
-
2026-06-15status $39,900 Pending 7 DOM
-
2026-06-15days on market $39,900 Active 7 DOM
-
2026-06-14days on market $39,900 Active 5 DOM
-
2026-06-10days on market $39,900 Active 2 DOM
-
2026-06-08statusdays on market $39,900 Active 1 DOM
-
2026-06-07days on market $39,900 Coming Soon 4 DOM
-
2026-06-05remarks 508-char remark
-
2026-06-03remarks 484-char remark
-
2026-06-03$39,900 Coming Soon 1 DOM
ⓘ Source: listings_history table (triggers on properties + properties_extension) + one-shot
backfill from property_details.listing_events for pre-trigger history.
Tax reassessment forecast OH · Partial reset (capped growth)
- Current annual tax
- $874 · $73/mo
- Projected year-2 tax
- $874 · $73/mo
- Expected delta
- $0/yr ($0/mo · 0.0%)
ⓘ Screening estimate from a state-policy table — verify with the county assessor before closing.
Climate risk First Street
- Flood 1/10 Low FEMA zone X (unshaded) · 0% chance over 30 yrs
- Wildfire 1/10 Low
- Heat 3/10 Moderate 7 d/yr ≥101°F today · 16 d/yr by 30 yrs out
- Wind 2/10 Low
- Air quality 2/10 Low 1 unhealthy d/yr today · 3 by 30 yrs out
Nearby sold comps map
Loading sold comps map…
Walkable amenities ~0.75 mi
Loading nearby amenities…
Taxation est. · year 1
- Rental income
- $12,736
- − Mortgage interest
- −$2,235
- − Property taxes
- −$874
- − Insurance
- −$200
- − Repairs & maintenance
- −$1,019
- − Management
- −$1,019
- − Depreciation
- −$1,161
- Taxable income
- $6,228
- Est. tax owed @ 24.0%
- −$1,495
- After-tax cash flow
- $4,982/yr
For passive investors: Depreciation is non-cash, so a rental often shows a tax loss while cash-flowing — sheltering income. Rental losses are passive: they offset passive income freely, and up to $25,000/yr can offset ordinary (W-2) income if you actively participate and your MAGI is under $100k (phasing out to $0 by $150k); unused losses carry forward. On sale, claimed depreciation is recaptured at up to 25%, and gains may owe capital-gains tax (a 1031 exchange can defer both). Figures are a year-1 estimate at your 24.0% rate — not tax advice; consult a CPA.
Schools (NCES district)
- District
- Toledo City
- NCES district ID
- 3904490
- Math proficiency
- 15% ▼ -16.00%
- Reading proficiency
- 24% ▼ -13.00%
- Median HH income
- $32,137
- Composite
- 15.76/100
- National rank
- #9276
- State rank
- #634 of 656 in OH
Livability — Toledo
- Score
- 66/100
- State rank
- #645
- US rank
- #11442
Category grades
Schools grade is shown separately in the Schools card above.
Census & demographics
- Census place
- Toledo, OH
- County
- Lucas County · 380,724 people
- City population
- 280,811
- Metro
- Toledo, OH
- Population (ZIP)
- 30,780
- Household income
- $64,384
- Rent vs Own
- Severe rent burden
- 917.0
Population outlook (Lucas County) Hauer SSP2
- Today (2025)
- 420,751 people
- By 2030
- 410,187 · -2.5%
- By 2040
- 384,019 · -8.7%
- By 2050
- 355,125 · -15.6%
- By 2075
- 291,683 · -30.7%
- By 2100
- 233,670 · -44.5%
Race, ethnicity, and origin ACS 2023
- Neighborhood character
- Predominantly White (71%)
- Race & ethnicity
- White 71% Black 15% Two or more races 10% Hispanic / Latino 7%
- Hispanic origin (detail)
- Mexican 5%
- Common ancestry
- Romanian 9% Lithuanian 3% Slovak 1%
- Foreign-born
- 2% · Canada
- Languages at home
- 95% English-only · Spanish 3% Arabic 1%
Political lean MEDSL · Lucas
- 2024 margin
- D (+12.6) · D 55.8% · R 43.2%
- 2008→2024 swing
- -18.9pp toward R · 2008: 31.4pp · 2024: 12.6pp
- All cycles
- 2024: D+12.6 2020: D+16.8 2016: D+17.4 2012: D+30.4 2008: D+31.4
Not yet ingested
- Civics
- —
Market trends
- HPI YoY
- ▼ -62.37%
- Current HPI
- 239.1345
- Rent YoY
- ▲ 3.30%
- Metro
- Toledo, OH
- State GDP YoY
- ▲ 1.98%
- F500 in state
- 48
Industry mix (Fortune 500 HQ in OH)
| Industry | F500 HQs | Revenue |
|---|---|---|
| Insurance | 3 | $145B |
|
||
| Industrial Machinery | 3 | $49B |
|
||
| Financial Services | 3 | $24B |
|
||
| Consumer Goods | 2 | $93B |
|
||
| Aerospace / Defense | 2 | $47B |
|
||
| Utilities | 2 | $33B |
|
||
Price history
+50.6% since first listed14 events — show timeline
- 2026-06-03 Coming Soon $39,900 NORIS
- 2025-10-14 Price Changed $50,000 NORIS
- 2025-10-14 Price Changed $20,000 NORIS
- 2022-12-28 Sold (Public Records) $50,000 Public Records
- 2022-12-16 Sold (MLS) $50,000 NORIS
- 2022-12-04 Pending — NORIS
- 2022-10-31 Contingent — NORIS
- 2022-10-17 Price Changed $58,000 NORIS
- 2022-10-06 Price Changed $69,900 NORIS
- 2022-09-30 Listed $72,900 NORIS
- 2017-02-20 Sold (MLS) $20,000 NORIS
- 2016-01-01 Price Changed $29,900 NORIS
- 2015-08-12 Listed $29,900 NORIS
- 1995-07-31 Sold (Public Records) $26,500 Public Records
Property tax history
+0.9%/yrLatest (2025): $874 · +1.6% YoY. Source: county tax records.
Cash-flow waterfall
monthlySold comps — $/sqft
last 12 mo · ≤1 miLoading sold comps…