 🏷️ Likely Rental
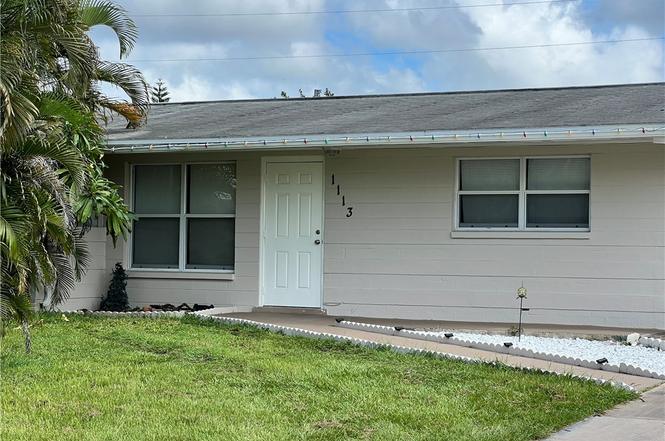
1113 Vineyard Pl · Lehigh Acres, FL
Flood risk 3/10 · Minor
- FEMA flood zone
- X (unshaded)
- Chance of flooding over 30 yrs
- 0.2%
- Est. flood insurance / yr
- $507 – $1,088
Fire risk 1/10 · Minimal
- Est. fire insurance / yr
- $947 – $1,759
Heat risk 10/10 · Severe
- Hot days now (above 107°F)
- 7 days/yr
- Hot days in 30 yrs
- 29 days/yr
Wind risk 10/10 · Severe
- Chance of severe wind over 30 yrs
- 99.0%
Air-quality risk 2/10 · Minimal
- Unhealthy air days now
- 1 days/yr
- Unhealthy air days in 30 yrs
- 2 days/yr
Risk factors via First Street. Map © Google.
Why this score? — see what drove the C- grade
The composite is a weighted blend of 9 inputs, each scored 0–100. Each bar is that input's sub-score; the figure is the points it added to the 100-point composite (weight × sub-score).
- Cash flow +15.6/30.0
- ARV discount +15.0/15.0
- DSCR +4.8/10.0
- 1% rule +4.2/10.0
- Schools +4.1/10.0
- Livability +3.0/5.0
- Condition / age +2.5/5.0
- Rent growth +2.3/5.0
- Appreciation +0.0/10.0
$150,000
🖨 Deal sheet (PDF) 📄 Offer letter ✓ Due diligence
Listing remarks MLS
CASH INVESTORS ONLY!! Cozy 1/1 duplex style with carport already with a tenant in place. approximately 3 blocks away from Homestead Blvd, close to supermarkets, post office, restaurants. Make an offer!!
Key facts
- Close to restaurants
- Close to post office
- Close to banks
Tags
Property features AI
Finance
- Financial info: Pets allowed
- HOA & community: Non-gated community; No association fee
Exterior
- Parking: Attached carport; Driveway (paved); 1 covered parking space; 1-car carport
- Security: Smoke detector(s)
- Utilities: Public water; Public sewer; Cable available
- Home design: Single-story; Entry level 1; Faces south; Resale property; Has property attached
- Construction: Block, concrete and stucco construction; Shingle roof
- Exterior features: Open patio and porch; Patio; Porch; Guest house attached; Rectangular lot; Public maintained road; North exposure
Interior
- Kitchen: Electric cooktop; Microwave; Refrigerator; Freezer; Dishwasher
- Flooring: Tile
- Bathrooms: 1 full bathroom
- Heating & cooling: Central heating (electric); Central air conditioning (electric)
- Interior features: Pantry; Separate shower; Shower only; Cable TV; Split bedrooms; Double-hung windows; Unfurnished
- Laundry & utility: Washer; Dryer
Neighborhood map
What this means for you Summary
Snapshot
- This is a 1-bed/1.0-bath single-family listed at $150k.
Deal economics
- At list price, monthly cash flow is $62 ($749/yr) — positive.
- The deal already cash-flows at list — no discount required.
- To meet the 1% rule (rent ≥ 1% of price), the offer needs to be $138k (8.3% below list).
- Recommended offer: $132k (12.0% below list) — sets the bar for market timing.
- Cap rate 6.8% vs local median 4.7% in Lehigh Acres — top-decile yield for the area; either an underpriced asset or a hidden risk that comps aren't pricing in. Stress-test before assuming the spread holds.
Location & tenants
- Location reads 59/100 on livability (#826 in FL) — a working-class tenant base; expect higher turnover. Strengths: cost of living A+, housing A+; Watch: crime C-, employment D+, amenities F.
- Lee (suburban): math 47% / reading 50% proficiency, ranked #42 of 73 in FL (top 58%) — families likely to look elsewhere, expect single-tenant / working-renter base with shorter leases.
- Zoned schools: Veterans Park Academy For The Arts (math 41% / reading 45%, grade F, #1,366 of 2,144 statewide, top 64%, 2,133 students, 36% FRL); Oak Hammock Middle School (math 43% / reading 41%, grade D-, #340 of 571 statewide, top 61%, 1,563 students, 56% FRL); Lehigh Senior High School (math 23% / reading 45%, grade F, #394 of 667 statewide, top 60%, 2,476 students, 57% FRL).
- Market conditions: Rents soft (-0.8%/yr); 644 active listings in the ZIP; 37 comparable units currently listed for rent nearby; rentals at typical pace (median 23d on market — plan ~3-4 weeks tenant-placement turnaround); 15,411 units permitted in Lee County in 2024 (4,686 in 5+ unit buildings).
- This rent runs 32% of the median local income ($51k/yr) — at the standard rent-burdened threshold; future hikes will face affordability resistance.
Forward outlook
- Local home prices are declining (-3.0%/yr); year-one equity from $1k of loan paydown is wiped out by about $4k of value loss. Plan a longer hold.
- Lee County population projected at +44% by 2050 — long-run rental-demand tailwind backs the buy-and-hold thesis.
Negotiation context
- It's been on market 216 days — a 12% lower offer ($132k) is reasonable based on typical stale-listing flexibility.
- 5 sale attempts since 26y ago; this cycle's ask has dropped $10k (6%) from the opening price — seller is motivated, your offer sets the floor, not the list.
- Current owner paid $115k; 30% above their basis — modest negotiation headroom, anchor on the comps not their cost.
Risks & watch-outs
- Climate carrying-cost: severe wind risk, 99% chance of damaging wind over 30y; extreme-heat days projected 7→29/yr by 2055 (HVAC capex compounding) — expect insurance premiums to compound above CPI over the hold.
Questions for the listing agent
- It's been on market 216 days. Have you received any prior offers? Is the seller open to a 12% concession, seller financing, or rate buy-down credit?
- Built in 1966 — when were the roof, HVAC, electrical panel, plumbing, and water heater last replaced?
- Why hasn't it sold? Are there any deal-killer items the seller is aware of (foundation, flood, title, zoning, code violations)?
- Is there a deadline driving the sale (1031 exchange, divorce, estate, relocation)? That informs how much negotiation room exists.
- Schools are D-rated, which usually means shorter tenancies and higher turnover. Who's the typical renter profile here, and what's been the actual vacancy rate?
- What's the average days-on-market for RENTAL listings here right now (not sales)? A rising rental-DOM trend means longer vacancies and softer asking-rent achievability than the comps imply.
- What's the recent tenant-quality profile in this submarket — average credit score on applications, eviction rate, late-payment / NSF rate, and stable-employment percentage? A property-management company in the area should have these aggregated.
- How much new for-sale + rental construction is in the pipeline within 1–3 miles? Heavy new supply typically softens prices + rents 12–24 months out; constrained supply supports both.
Investment metrics
- 1% rule
- 0.92% ✗
- Cap rate
- 6.79%
- Cash-on-cash
- 1.78%
- DSCR
- 1.08
- GRM
- 9.1
CMA / ARV
- ARV (on-the-fly)
- $189,756
- Comps found
- 5
Show comp detail 5 sales within ~0.75 mi
| Address | Dist | Beds/Ba | Sqft | Sold | Price | $/sf | Match |
|---|---|---|---|---|---|---|---|
| 1104 Wesley St | 0.08mi | 2/2.0 (+1) | 708 (-6%) | 16mo | $179,000 | $253 | 63 |
| 3 Vineyard St | 0.07mi | 1/1.0 | 645 (-15%) | 21mo | $169,900 | $263 | 55 |
| 18 Alabama Rd N | 0.16mi | 2/1.0 (+1) | 863 (+14%) | 14mo | $140,000 | $162 | 53 |
| 715 Leeland Heights Blvd W | 0.46mi | 2/1.0 (+1) | 816 (+8%) | 24mo | $205,000 | $251 | 40 |
| 44 Tangelo Ct | 0.60mi | 2/2.0 (+1) | 812 (+7%) | 17mo | $100,000 | $123 | 37 |
Match score weights: distance 35% · size 25% · config 20% · recency 20%. Top-matched comps best support the ARV.
Projected returns pro-forma
-3.0% appreciation · 0.0% rent growth · sell at horizon
- IRR
- -16.8%
- Equity multiple
- 0.42×
- Total profit
- $-24,350
- Equity at exit
- $22,365
- IRR
- -15.4%
- Equity multiple
- 0.25×
- Total profit
- $-31,615
- Equity at exit
- $12,969
Cash invested: $42,000 (down + closing). Projections, not guarantees.
Landlord ↔ Tenant lean methodology
- Overall (STATE)
- 87 Strongly Landlord-Friendly
- State Florida
- 87 Strongly Landlord-Friendly · R+3
- County
- — inherits STATE
- City
- — inherits STATE
ZIP-level market 33936
- Home prices YoY
- -19.9%
- Rents YoY
- -0.8%
- Active inventory
- 644
- Price-to-rent
- 9.1×
Monthly cashflow live
- Estimated rent
- $1,376 high interval (Pro) →
- Mortgage (P&I)
- −$787
- Tax from tax record
- −$176 /mo · $2,108/yr
- Insurance
- −$62
- HOA
- −$0
- Vacancy / Maint / Mgmt
- −$289
- Net cashflow
- $62
Break-even live
Sensitivity live
| Price | -10% $147 | -5% $105 | +0% $62 | +5% $20 | +10% $-22 |
|---|---|---|---|---|---|
| Rent | -10% $-46 | -5% $8 | +0% $62 | +5% $117 | +10% $171 |
| Rate | -1.0pp $138 | -0.5pp $101 | base $62 | +0.5pp $24 | +1.0pp $-16 |
UW: 25.0% down · 7.5% · 30yr · 1.5% tax · 5.0% vac · 8.0% maint · 8.0% mgmt
Financing live
Cash to close
- Down payment
- $37,500
- Closing costs
- $4,500
- Reserves months
- —
- Total cash needed
- —
Loan-product check · same deal, 3 products live
Conventional
25% down · 7.5% · 30yr
- Down + closing
- —
- Monthly P&I
- —
- Monthly cashflow
- —
- DSCR
- —
- Eligible?
- —
Personal DTI + credit; lowest rate.
DSCR
20% down · 8.5% · 30yr
- Down + closing
- —
- Monthly P&I
- —
- Monthly cashflow
- —
- DSCR
- —
- Eligible?
- —
No personal income docs; deal must DSCR.
Hard money
10% down · 12.0% · 12mo
- Down + closing
- —
- Monthly P&I
- —
- Monthly cashflow
- —
- DSCR
- —
- Eligible?
- —
Short-term bridge; refi at stabilization.
Rent comps 37 comps
| Address | Beds | Baths | Sqft | Rent | $/sqft | DOM | Units | Dist |
|---|---|---|---|---|---|---|---|---|
| 1120 Vineyard St Lehigh Acres, FL | 2.0 | 1.0 | 1028 | $1,300 | $1.26 | 25d | 1 | 0.10mi |
| 26 Alabama Rd S Lehigh Acres, FL | 2.0 | 1.0 | 920 | $1,650 | $1.79 | 23d | 1 | 0.25mi |
| 9137 Aegean Cir Lehigh Acres, FL | 2.0 | 2.0 | 1120 | $1,474 | $1.32 | 25d | 1 | 0.25mi |
| 9137 Aegean Cir Lehigh Acres, FL | 2.0 | 2.0 | 1120 | $1,474 | $1.32 | 5d | 1 | 0.25mi |
| 9161 Aegean Cir Lehigh Acres, FL | 2.0 | 2.0 | 1120 | $1,650 | $1.47 | 15d | 1 | 0.26mi |
| 907 Laredo Ave Lehigh Acres, FL | 1.0 | 1.0 | 636 | $1,000 | $1.57 | 25d | 1 | 0.27mi |
| 9123 Aegean Cir Lehigh Acres, FL | 2.0 | 2.0 | 1120 | $1,474 | $1.32 | 4d | 1 | 0.28mi |
| 9099 Aegean Cir Lehigh Acres, FL | 2.0 | 2.0 | 1120 | $1,499 | $1.34 | 25d | 1 | 0.33mi |
| 11 California Rd Lehigh Acres, FL | 1.0 | 1.0 | 683 | $1,450 | $2.12 | 25d | 1 | 0.37mi |
| 28 Cosmopolitan Dr #13 Lehigh Acres, FL | 2.0 | 2.0 | 973 | $1,375 | $1.41 | 16d | 1 | 0.48mi |
| 704 W Cleveland Ln Lehigh Acres, FL | 2.0 | 1.0 | 816 | $1,400 | $1.72 | 25d | 1 | 0.50mi |
| 10 Beth Stacey Blvd #206 Lehigh Acres, FL | 2.0 | 2.0 | 1012 | $1,100 | $1.09 | 5d | 1 | 0.51mi |
| 18461 Copperhead Ct N #444 Lehigh Acres, FL | 2.0 | 2.0 | 1120 | $2,300 | $2.05 | 25d | 1 | 0.55mi |
| 3 Desert Candle Cir Lehigh Acres, FL | 2.0 | 2.0 | 853 | $1,200 | $1.41 | 25d | 1 | 0.56mi |
| 1423 Caywood Cir S Lehigh Acres, FL | 2.0 | 2.0 | 960 | $1,376 | $1.43 | 5d | 1 | 0.56mi |
| 111 Yellowtail Loop #3 Lehigh Acres, FL | 2.0 | 2.0 | 1100 | $1,750 | $1.59 | 25d | 1 | 0.60mi |
| 44 Tangelo Ct Lehigh Acres, FL | 2.0 | 2.0 | 812 | $1,150 | $1.42 | 5d | 1 | 0.62mi |
| 18411 Copperhead Dr #346 Lehigh Acres, FL | 2.0 | 2.0 | 1061 | $1,695 | $1.60 | 23d | 1 | 0.63mi |
| 9 Hamlin Ct Lehigh Acres, FL | 1.0 | 1.5 | 807 | $950 | $1.18 | 5d | 1 | 0.64mi |
| 47 Tangelo Ct Lehigh Acres, FL | 2.0 | 2.0 | 812 | $1,150 | $1.42 | 25d | 1 | 0.64mi |
| 6 Aztec Lily Ln Lehigh Acres, FL | 2.0 | 2.0 | 853 | $1,500 | $1.76 | 21d | 1 | 0.66mi |
| 6 Aztec Lily Ln Lehigh Acres, FL | 2.0 | 2.0 | 853 | $2,600 | $3.05 | 25d | 1 | 0.66mi |
| 219 Beth Stacey Blvd Lehigh Acres, FL | 2.0 | 2.0 | 997 | $1,300 | $1.30 | 23d | 1 | 0.66mi |
| 10525 Putnam Ct Lehigh Acres, FL | 2.0 | 2.0 | 1014 | $1,250 | $1.23 | 21d | 1 | 0.66mi |
| 10554 Quincy Ct Lehigh Acres, FL | 2.0 | 2.0 | 1004 | $1,300 | $1.29 | 21d | 1 | 0.67mi |
| 102 Connecticut Rd Lehigh Acres, FL | 2.0 | 1.0 | 816 | $1,300 | $1.59 | 25d | 1 | 0.68mi |
| 46 Hamlin Ct Lehigh Acres, FL | 2.0 | 2.0 | 812 | $1,050 | $1.29 | 25d | 1 | 0.68mi |
| 10578 Quincy Ct Unit 1 Lehigh Acres, FL | 2.0 | 2.0 | 899 | $1,275 | $1.42 | 25d | 1 | 0.71mi |
| 10 Tangerine Ct Lehigh Acres, FL | 2.0 | 2.0 | 812 | $1,200 | $1.48 | 21d | 1 | 0.73mi |
| 305 Bougainvillea Rd W Lehigh Acres, FL | 1.0 | 1.0 | 742 | $1,295 | $1.75 | 25d | 1 | 0.90mi |
| 1407 Juddale St E Lehigh Acres, FL | 2.0 | 1.0 | 997 | $1,450 | $1.45 | 5d | 1 | 0.94mi |
| 18451 Copperhead Dr #522 Lehigh Acres, FL | 2.0 | 2.0 | 1120 | $1,895 | $1.69 | 25d | 1 | 0.98mi |
| 1112 Gifford Ave S Lehigh Acres, FL | 2.0 | 2.0 | 880 | $1,350 | $1.53 | 25d | 1 | 1.00mi |
| 1112 Gifford Ave S Lehigh Acres, FL | 2.0 | 2.0 | 880 | $1,350 | $1.53 | 5d | 1 | 1.00mi |
| 106 Leeland Heights Blvd W Lehigh Acres, FL | 1.0 | 1.0 | 794 | $1,450 | $1.83 | 25d | 1 | 1.02mi |
| 1507 Markdale St E Lehigh Acres, FL | 2.0 | 1.0 | 997 | $1,300 | $1.30 | 5d | 1 | 1.04mi |
| 1232 Village Lakes Blvd Lehigh Acres, FL | 1.0–2.0 | 1.0–2.0 | 734 | $1,127 | $1.54 | 16d | 17 | 1.45mi |
Listing history 25 events
-
2026-06-02days on market $150,000 Active 216 DOM
-
2026-06-01days on market $150,000 Active 215 DOM
-
2026-06-01days on market $150,000 Active 214 DOM
-
2026-03-30price $150,000
-
2026-01-31price $155,000
-
2025-10-25$160,000 Active
-
2022-09-07soldstatus $115,000
-
2022-09-06soldstatus $105,000 Closed 202-char remark
Show marketing remark (202 chars)
CASH INVESTORS ONLY!! Cozy 1/1 duplex style with carport already with a tenant in place. approximately 3 blocks away from Homestead Blvd, close to supermarkets, post office, restaurants. Make an offer!!
-
2022-08-04status Pending 202-char remark
Show marketing remark (202 chars)
CASH INVESTORS ONLY!! Cozy 1/1 duplex style with carport already with a tenant in place. approximately 3 blocks away from Homestead Blvd, close to supermarkets, post office, restaurants. Make an offer!!
-
2022-07-24$115,000 Active 202-char remark
Show marketing remark (202 chars)
CASH INVESTORS ONLY!! Cozy 1/1 duplex style with carport already with a tenant in place. approximately 3 blocks away from Homestead Blvd, close to supermarkets, post office, restaurants. Make an offer!!
-
2018-09-12soldstatus $72,000
-
2018-08-31soldstatus $72,000 172-char remark
Show marketing remark (172 chars)
A completely remodeled home in growing Lehigh Acres in a quiet street. Newer A/C, granite, and new cabinets. Currently tenant occupied but easy to show with an appointment.
-
2018-06-09$75,000 172-char remark
Show marketing remark (172 chars)
A completely remodeled home in growing Lehigh Acres in a quiet street. Newer A/C, granite, and new cabinets. Currently tenant occupied but easy to show with an appointment.
-
2017-08-21historical
-
2017-06-14$59,000
-
2015-03-02price $15,000
-
2015-03-02price $13,500
-
2012-09-03soldstatus $15,000
-
2012-08-29soldstatus $15,100
-
2007-12-20soldstatus $60,000
-
2007-11-21soldstatus $60,000
-
2007-10-23price $69,900
-
2000-04-17soldstatus $24,500
-
2000-04-17soldstatus $24,500
-
2000-02-22$24,500
ⓘ Source: listings_history table (triggers on properties + properties_extension) + one-shot
backfill from property_details.listing_events for pre-trigger history.
Tax reassessment forecast FL · Resets to sale price
- Current annual tax
- $2,108 · $176/mo
- Projected year-2 tax
- $2,108 · $176/mo
- Expected delta
- $0/yr ($0/mo · 0.0%)
ⓘ Screening estimate from a state-policy table — verify with the county assessor before closing.
Climate risk First Street
- Flood 3/10 Moderate FEMA zone X (unshaded) · 20% chance over 30 yrs
- Wildfire 1/10 Low
- Heat 10/10 Extreme 7 d/yr ≥107°F today · 29 d/yr by 30 yrs out
- Wind 10/10 Extreme 99% chance of damaging wind over 30 yrs
- Air quality 2/10 Low 1 unhealthy d/yr today · 2 by 30 yrs out
Nearby sold comps map
Loading sold comps map…
Walkable amenities ~0.75 mi
Loading nearby amenities…
Taxation est. · year 1
- Rental income
- $16,514
- − Mortgage interest
- −$8,402
- − Property taxes
- −$2,108
- − Insurance
- −$750
- − Repairs & maintenance
- −$1,321
- − Management
- −$1,321
- − Depreciation
- −$4,364
- Taxable loss
- −$1,752
- Est. tax savings @ 24.0%
- +$420
- After-tax cash flow
- $1,170/yr
For passive investors: Depreciation is non-cash, so a rental often shows a tax loss while cash-flowing — sheltering income. Rental losses are passive: they offset passive income freely, and up to $25,000/yr can offset ordinary (W-2) income if you actively participate and your MAGI is under $100k (phasing out to $0 by $150k); unused losses carry forward. On sale, claimed depreciation is recaptured at up to 25%, and gains may owe capital-gains tax (a 1031 exchange can defer both). Figures are a year-1 estimate at your 24.0% rate — not tax advice; consult a CPA.
Schools (NCES district)
- District
- Lee
- NCES district ID
- 1201080
- Math proficiency
- 47% ▼ -11.00%
- Reading proficiency
- 50% ▼ -4.00%
- Median HH income
- $49,518
- Composite
- 41.49/100
- National rank
- #3458
- State rank
- #42 of 73 in FL
Livability — Lehigh Acres
- Score
- 59/100
- State rank
- #826
- US rank
- #20055
Category grades
Schools grade is shown separately in the Schools card above.
Census & demographics
- Census place
- Lehigh Acres, FL
- County
- Lee County · 788,662 people
- City population
- 130,638
- Metro
- Cape Coral-Fort Myers, FL
- Population (ZIP)
- 27,967
- Household income
- $51,417
- Rent vs Own
- Severe rent burden
- 1027.0
Population outlook (Lee County) Hauer SSP2
- Today (2025)
- 871,946 people
- By 2030
- 955,468 · +9.6%
- By 2040
- 1,113,587 · +27.7%
- By 2050
- 1,256,891 · +44.1%
- By 2075
- 1,560,270 · +78.9%
- By 2100
- 1,726,848 · +98.0%
Race, ethnicity, and origin ACS 2023
- Neighborhood character
- Diverse neighborhood (Simpson 0.63)
- Race & ethnicity
- Hispanic / Latino 44% White 41% Two or more races 21% Black 9% Asian 1%
- Hispanic origin (detail)
- Mexican 7% Puerto Rican 9% Cuban 18% Dominican 2%
- Common ancestry
- Hispanic 3% Romanian 2% Lithuanian 1%
- Foreign-born
- 28% · Canada, Jamaica
- Languages at home
- 59% English-only · Spanish 36% French/Haitian/Cajun 3% Tagalog/Filipino 1%
Political lean MEDSL · Lee
- 2024 margin
- Strong R (+28.4) · D 35.5% · R 63.9%
- 2008→2024 swing
- -18.0pp toward R · 2008: -10.4pp · 2024: -28.4pp
- All cycles
- 2024: R+28.4 2020: R+19.2 2016: R+20.4 2012: R+16.6 2008: R+10.4
Not yet ingested
- Civics
- —
Market trends
- HPI YoY
- ▼ -86.78%
- Current HPI
- 348.8631
- Rent YoY
- ▼ -0.77%
- Metro
- Cape Coral-Fort Myers, FL
- State GDP YoY
- ▲ 3.28%
- F500 in state
- 36
Industry mix (Fortune 500 HQ in FL)
| Industry | F500 HQs | Revenue |
|---|---|---|
| Industrial Technology | 2 | $29B |
|
||
| Insurance | 2 | $17B |
|
||
| Retail | 1 | $60B |
|
||
| Technology Distribution | 1 | $58B |
|
||
| Homebuilding | 1 | $35B |
|
||
| Technology Manufacturing | 1 | $35B |
|
||
Price history
+512.2% since first listed22 events — show timeline
- 2026-03-30 Price Changed $150,000 FORTMLS
- 2026-01-31 Price Changed $155,000 FORTMLS
- 2025-10-25 Listed $160,000 FORTMLS
- 2022-09-07 Sold (Public Records) $115,000 Public Records
- 2022-09-06 Sold (MLS) $105,000 FORTMLS
- 2022-08-04 Pending — FORTMLS
- 2022-07-24 Listed $115,000 FORTMLS
- 2018-09-12 Sold (Public Records) $72,000 Public Records
- 2018-08-31 Sold (MLS) $72,000 MARMLS
- 2018-06-09 Listed $75,000 MARMLS
- 2017-08-21 Listing Removed — MARMLS
- 2017-06-14 Listed $59,000 MARMLS
- 2015-03-02 Price Changed $15,000 FORTMLS
- 2015-03-02 Price Changed $13,500 FORTMLS
- 2012-09-03 Sold (MLS) $15,000 FORTMLS
- 2012-08-29 Sold (MLS) $15,100 FORTMLS
- 2007-12-20 Sold (Public Records) $60,000 Public Records
- 2007-11-21 Sold (MLS) $60,000 FORTMLS
- 2007-10-23 Price Changed $69,900 FORTMLS
- 2000-04-17 Sold (Public Records) $24,500 Public Records
- 2000-04-17 Sold (Public Records) $24,500 Public Records
- 2000-02-22 Listed $24,500 FORTMLS
Property tax history
+11.6%/yrLatest (2025): $2,108 · +5.2% YoY. Source: county tax records.
Cash-flow waterfall
monthlySold comps — $/sqft
last 12 mo · ≤1 miLoading sold comps…