 Duplex
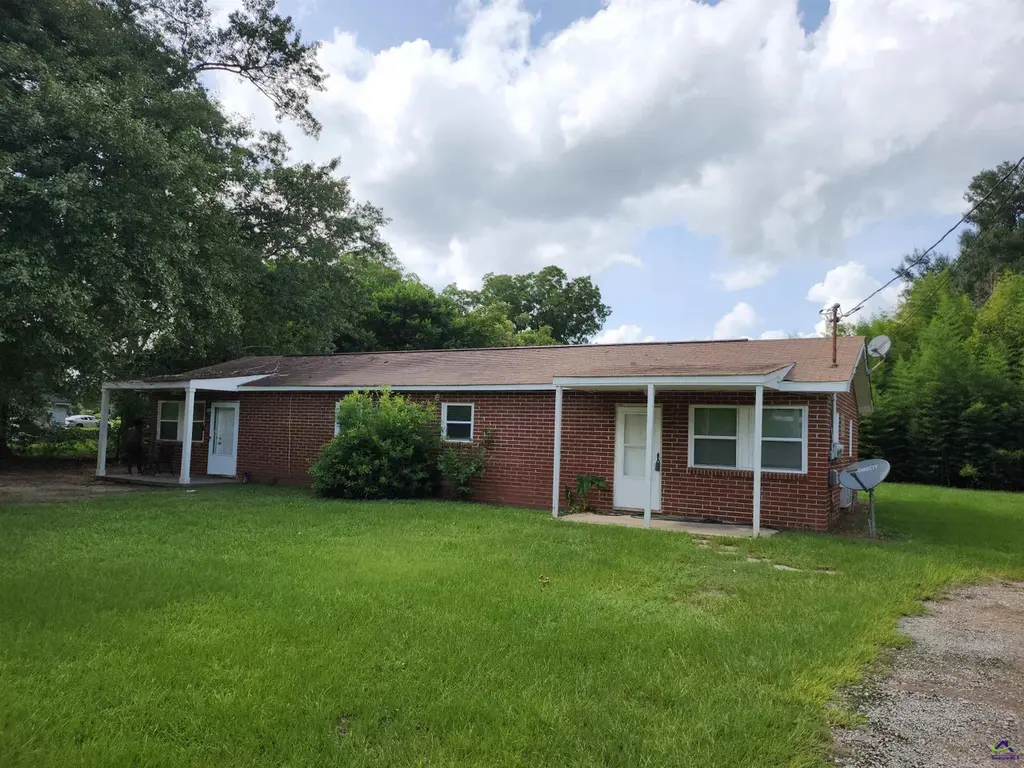
103 Virginia Dare Dr · Warner Robins, GA
Flood risk 1/10 · Minimal
- FEMA flood zone
- X (unshaded)
- Chance of flooding over 30 yrs
- 0.0%
- Est. flood insurance / yr
- $507 – $1,088
Fire risk 3/10 · Minor
- Est. fire insurance / yr
- $963 – $1,789
Heat risk 7/10 · Major
- Hot days now (above 108°F)
- 7 days/yr
- Hot days in 30 yrs
- 18 days/yr
Wind risk 8/10 · Major
- Chance of severe wind over 30 yrs
- 80.0%
Air-quality risk 3/10 · Minor
- Unhealthy air days now
- 2 days/yr
- Unhealthy air days in 30 yrs
- 4 days/yr
Risk factors via First Street. Map © Google.
Why this score? — see what drove the C+ grade
The composite is a weighted blend of 9 inputs, each scored 0–100. Each bar is that input's sub-score; the figure is the points it added to the 100-point composite (weight × sub-score).
- Cash flow +27.7/30.0
- DSCR +9.7/10.0
- ARV discount +7.5/15.0
- 1% rule +6.3/10.0
- Schools +3.9/10.0
- Livability +3.2/5.0
- Rent growth +2.9/5.0
- Condition / age +2.5/5.0
- Appreciation +0.0/10.0
$215,000
🖨 Deal sheet (PDF) 📄 Offer letter ✓ Due diligence
Multi-family units
County records classify this as Multi-Family (2-4 Unit). Listing-text estimate: 2 units. confirmed
Listing remarks MLS
Completely updated 2 bedroom 1 bath duplex.
Key facts
- 0.41 acre lot
- 2 parking spots
- Built 1960
Neighborhood map
What this means for you Summary
Snapshot
- This is a 2 × 2-bed/1-bath units multifamily listed at $215k.
Deal economics
- At list price, monthly cash flow is $646 ($8k/yr) — positive. Per door: $323/mo.
- The deal already cash-flows at list — no discount required.
- Meets the 1% rule at list price ($2k rent vs $215k).
- Recommended offer: $189k (12.0% below list) — sets the bar for market timing.
- Cap rate 9.9% vs local median 4.9% in Warner Robins — top-decile yield for the area; either an underpriced asset or a hidden risk that comps aren't pricing in. Stress-test before assuming the spread holds.
Location & tenants
- Location reads 65/100 on livability (#227 in GA) — a middle-class / working-renter tenant base. Strengths: cost of living A+, housing A+, health & safety A+; Watch: employment D+, crime F, amenities F.
- Houston County (urban): math 43% / reading 46% proficiency, ranked #23 of 174 in GA (top 13%) — families likely to look elsewhere, expect single-tenant / working-renter base with shorter leases.
- Zoned schools: C. B. Watson Primary School (557 students, 84% FRL); Huntington Middle School (math 23% / reading 32%, grade F, #268 of 470 statewide, top 57%, 827 students, 84% FRL); Warner Robins High School (math 7% / reading 21%, grade F, #322 of 424 statewide, top 76%, 1,816 students, 84% FRL) — zoned schools average 84% FRL vs 46% district-wide (38 pts higher); higher-poverty schools than district average — tighter screening recommended.
- Zoned-school proficiency averages 21% at this address vs 44% district-wide (-24 pts) — the specific schools serving this property underperform the Houston County average; the district grade overstates school quality for this exact location.
- Market conditions: Rents rising (+1.7%/yr); 295 active listings in the ZIP; 7 comparable units currently listed for rent nearby; rentals lingering (median 45d on market — plan ~5-8 weeks vacancy on turnover, expect pricing pressure); 57% of comp listings sitting > 30 days — soft ceiling on asking rent; solid renter incomes; 1,545 units permitted in Houston County in 2024 (336 in 5+ unit buildings).
- This rent runs 35% of the median local income ($83k/yr) — at the standard rent-burdened threshold; future hikes will face affordability resistance.
Forward outlook
- Local home prices are declining (-3.0%/yr); year-one equity from $1k of loan paydown is wiped out by about $6k of value loss. Plan a longer hold.
- Houston County population projected at +22% by 2050 — long-run rental-demand tailwind backs the buy-and-hold thesis.
Negotiation context
- It's been on market 259 days — a 12% lower offer ($189k) is reasonable based on typical stale-listing flexibility.
- 6 sale attempts since 4y ago; this cycle's ask is 19445% above the opening price — seller raised mid-cycle; expect resistance to lowballs.
Risks & watch-outs
- Climate carrying-cost: severe wind risk, 80% chance of damaging wind over 30y; extreme-heat days projected 7→18/yr by 2055 (HVAC capex compounding) — expect insurance premiums to compound above CPI over the hold.
Questions for the listing agent
- It's been on market 259 days. Have you received any prior offers? Is the seller open to a 12% concession, seller financing, or rate buy-down credit?
- Can we see the unit-by-unit rent roll, current vacancy, and any below-market leases? What's the average tenancy length?
- What capital expenditures (roof, boiler, parking lot, exteriors) have been made in the last 5 years, and what's planned in the next 2?
- Built in 1960 — when were the roof, HVAC, electrical panel, plumbing, and water heater last replaced?
- Why hasn't it sold? Are there any deal-killer items the seller is aware of (foundation, flood, title, zoning, code violations)?
- Is there a deadline driving the sale (1031 exchange, divorce, estate, relocation)? That informs how much negotiation room exists.
- Schools are D-rated, which usually means shorter tenancies and higher turnover. Who's the typical renter profile here, and what's been the actual vacancy rate?
- Crime grade is F in this area — have there been break-ins, vandalism, or insurance claims at this property in the last 3 years? What carrier currently insures it and at what premium?
- What's the average days-on-market for RENTAL listings here right now (not sales)? A rising rental-DOM trend means longer vacancies and softer asking-rent achievability than the comps imply.
- What's the recent tenant-quality profile in this submarket — average credit score on applications, eviction rate, late-payment / NSF rate, and stable-employment percentage? A property-management company in the area should have these aggregated.
- How much new apartment / multifamily construction is in the pipeline within 1–3 miles? Heavy new supply (>2% of stock underway) typically softens rents 12–24 months out; light construction supports rent growth.
Investment metrics
- 1% rule
- 1.13% ✓
- Cap rate
- 9.90%
- Cash-on-cash
- 12.88%
- DSCR
- 1.57
- GRM
- 7.4
CMA / ARV
- ARV (median comp)
- $122,607
- List price
- $215,000
- Delta
- 75.36%
- Verdict
- OVERPRICED
- Comps
- 4 within 1.0 mi
Show comp detail 1 sale within ~0.75 mi
| Address | Dist | Beds/Ba | Sqft | Sold | Price | $/sf | Match |
|---|---|---|---|---|---|---|---|
| 1093 Booth Rd | 0.39mi | —/— | 1,308 (-12%) | 11mo | $72,000 | $55 | 53 |
Match score weights: distance 35% · size 25% · config 20% · recency 20%. Top-matched comps best support the ARV.
Projected returns pro-forma
-3.0% appreciation · 1.67% rent growth · sell at horizon
- IRR
- 1.3%
- Equity multiple
- 1.05×
- Total profit
- $3,026
- Equity at exit
- $32,057
- IRR
- 9.7%
- Equity multiple
- 1.71×
- Total profit
- $42,467
- Equity at exit
- $18,589
Cash invested: $60,200 (down + closing). Projections, not guarantees.
Landlord ↔ Tenant lean methodology
- Overall (STATE)
- 90 Strongly Landlord-Friendly
- State Georgia
- 90 Strongly Landlord-Friendly · R+3
- County
- — inherits STATE
- City
- — inherits STATE
ZIP-level market 31088
- Rents YoY
- 1.7%
- Active inventory
- 295
- Price-to-rent
- 14.8×
Monthly cashflow live
- Estimated rent
- $2,419 high interval (Pro) →
- Mortgage (P&I)
- −$1,127
- Tax from tax record
- −$48 /mo · $572/yr
- Insurance
- −$90
- HOA
- −$0
- Vacancy / Maint / Mgmt
- −$508
- Net cashflow
- $646
Break-even live
Sensitivity live
| Price | -10% $768 | -5% $707 | +0% $646 | +5% $585 | +10% $525 |
|---|---|---|---|---|---|
| Rent | -10% $455 | -5% $551 | +0% $646 | +5% $742 | +10% $837 |
| Rate | -1.0pp $755 | -0.5pp $701 | base $646 | +0.5pp $591 | +1.0pp $534 |
2-unit breakdown (identical units grouped — click to expand)
| Units | Beds | Baths | Est. rent |
|---|---|---|---|
| 2× units | 2 | 1 | $2,418 |
| #1 | 2 | 1 | $1,209 |
| #2 | 2 | 1 | $1,209 |
| Total (2 units) | $2,419 | ||
UW: 25.0% down · 7.5% · 30yr · 1.5% tax · 5.0% vac · 8.0% maint · 8.0% mgmt
Financing live
Cash to close
- Down payment
- $53,750
- Closing costs
- $6,450
- Reserves months
- —
- Total cash needed
- —
Loan-product check · same deal, 3 products live
Conventional
25% down · 7.5% · 30yr
- Down + closing
- —
- Monthly P&I
- —
- Monthly cashflow
- —
- DSCR
- —
- Eligible?
- —
Personal DTI + credit; lowest rate.
DSCR
20% down · 8.5% · 30yr
- Down + closing
- —
- Monthly P&I
- —
- Monthly cashflow
- —
- DSCR
- —
- Eligible?
- —
No personal income docs; deal must DSCR.
Hard money
10% down · 12.0% · 12mo
- Down + closing
- —
- Monthly P&I
- —
- Monthly cashflow
- —
- DSCR
- —
- Eligible?
- —
Short-term bridge; refi at stabilization.
Rent comps 7 comps
| Address | Beds | Baths | Sqft | Rent | $/sqft | DOM | Units | Dist |
|---|---|---|---|---|---|---|---|---|
| 108 Corinth St Warner Robins, GA | 3.0 | 1.0 | 1200 | $1,400 | $1.17 | 45d | 1 | 0.39mi |
| 305 Sparta St Warner Robins, GA | 3.0 | 1.0 | 1198 | $1,200 | $1.00 | 45d | 1 | 0.59mi |
| 611 Links View Dr Bonaire, GA | 3.0 | 2.0 | 1696 | $1,900 | $1.12 | 22d | 1 | 1.02mi |
| 605 S Pleasant Hill Rd Warner Robins, GA | 3.0 | 1.0 | 1326 | $1,150 | $0.87 | 45d | 1 | 1.20mi |
| 605 S Pleasant Hill Rd Warner Robins, GA | 3.0 | 1.0 | 1326 | $1,150 | $0.87 | 22d | 1 | 1.20mi |
| 210 Southland Station Dr Warner Robins, GA | 1.0–3.0 | 1.0–2.0 | 1135 | $1,208 | $1.06 | 15d | 15 | 1.39mi |
| 1311 Alma Ave Warner Robins, GA | 3.0 | 1.0 | 1073 | $1,150 | $1.07 | 45d | 1 | 1.41mi |
Listing history 33 events
-
2026-06-21days on market $215,000 Active 259 DOM
-
2026-06-19days on market $215,000 Active 257 DOM
-
2026-06-18days on market $215,000 Active 256 DOM
-
2026-06-17days on market $215,000 Active 255 DOM
-
2026-06-16days on market $215,000 Active 254 DOM
-
2026-06-15days on market $215,000 Active 253 DOM
-
2026-06-14days on market $215,000 Active 251 DOM
-
2026-06-13days on market $215,000 Active 250 DOM
-
2026-06-10days on market $215,000 Active 248 DOM
-
2026-06-09days on market $215,000 Active 247 DOM
-
2026-06-08days on market $215,000 Active 246 DOM
-
2026-06-07days on market $215,000 Active 245 DOM
-
2026-06-05days on market $215,000 Active 242 DOM
-
2026-06-03days on market $215,000 Active 241 DOM
-
2026-06-02days on market $215,000 Active 240 DOM
-
2026-06-01days on market $215,000 Active 239 DOM
-
2026-05-31days on market $215,000 Active 238 DOM
-
2026-05-30days on market $215,000 Active 237 DOM
-
2026-02-09historical $1,100
-
2025-10-22$1,100
-
2025-10-05$215,000 Active 43-char remark
Show marketing remark (43 chars)
Completely updated 2 bedroom 1 bath duplex.
-
2024-12-24historical $1,100
-
2024-12-05$1,100
-
2024-07-31historical $1,100
-
2024-07-25$1,100
-
2024-05-18historical $1,100
-
2024-02-07$1,100
-
2023-03-21soldstatus $205,000
-
2022-06-28soldstatus $276,000 529-char remark
Show marketing remark (529 chars)
3 Duplexes, All units are 2 Bedrooms 1 Bath, 744 square feet. The duplexes are 100 % occupied with long time tenants. No city property taxes. Gross rent is $28,000 per year Duplexes are located off Russell Parkway close to RAFB, Anchor Glass, Walmart, Zaxby's and many other businesses. Units have gas furnaces. Roof on 103 & 105 was replaced 5 years ago and roof on 107 was replaced about 8 years ago. Tenants are responsible for all utilities, appliances and A/C units. Units have gas furnaces. Call BOE for school zones.
-
2022-02-15$281,250 529-char remark
Show marketing remark (529 chars)
3 Duplexes, All units are 2 Bedrooms 1 Bath, 744 square feet. The duplexes are 100 % occupied with long time tenants. No city property taxes. Gross rent is $28,000 per year Duplexes are located off Russell Parkway close to RAFB, Anchor Glass, Walmart, Zaxby's and many other businesses. Units have gas furnaces. Roof on 103 & 105 was replaced 5 years ago and roof on 107 was replaced about 8 years ago. Tenants are responsible for all utilities, appliances and A/C units. Units have gas furnaces. Call BOE for school zones.
-
2005-08-19soldstatus $45,000
-
2004-02-26soldstatus $40,000
-
1995-07-21soldstatus $31,250
ⓘ Source: listings_history table (triggers on properties + properties_extension) + one-shot
backfill from property_details.listing_events for pre-trigger history.
Tax reassessment forecast GA · Resets to sale price
- Current annual tax
- $572 · $48/mo
- Projected year-2 tax
- $1,978 · $165/mo
- Expected delta
- +$1,406/yr (+$117/mo · 245.6%)
ⓘ Screening estimate from a state-policy table — verify with the county assessor before closing.
Climate risk First Street
- Flood 1/10 Low FEMA zone X (unshaded) · 0% chance over 30 yrs
- Wildfire 3/10 Moderate
- Heat 7/10 Severe 7 d/yr ≥108°F today · 18 d/yr by 30 yrs out
- Wind 8/10 Severe 80% chance of damaging wind over 30 yrs
- Air quality 3/10 Moderate 2 unhealthy d/yr today · 4 by 30 yrs out
Nearby sold comps map
Loading sold comps map…
Walkable amenities ~0.75 mi
Loading nearby amenities…
Taxation est. · year 1
- Rental income
- $29,028
- − Mortgage interest
- −$12,043
- − Property taxes
- −$572
- − Insurance
- −$1,075
- − Repairs & maintenance
- −$2,322
- − Management
- −$2,322
- − Depreciation
- −$6,255
- Taxable income
- $4,438
- Est. tax owed @ 24.0%
- −$1,065
- After-tax cash flow
- $6,690/yr
For passive investors: Depreciation is non-cash, so a rental often shows a tax loss while cash-flowing — sheltering income. Rental losses are passive: they offset passive income freely, and up to $25,000/yr can offset ordinary (W-2) income if you actively participate and your MAGI is under $100k (phasing out to $0 by $150k); unused losses carry forward. On sale, claimed depreciation is recaptured at up to 25%, and gains may owe capital-gains tax (a 1031 exchange can defer both). Figures are a year-1 estimate at your 24.0% rate — not tax advice; consult a CPA.
Schools (NCES district)
- District
- Houston County
- NCES district ID
- 1302880
- Math proficiency
- 43% ▼ -7.00%
- Reading proficiency
- 46% ▼ -2.00%
- Median HH income
- $54,823
- Composite
- 38.68/100
- National rank
- #4144
- State rank
- #23 of 174 in GA
Livability — Warner Robins
- Score
- 65/100
- State rank
- #227
- US rank
- #13290
Category grades
Schools grade is shown separately in the Schools card above.
Census & demographics
- County
- Houston County · 157,321 people
- City population
- 92,102
- Metro
- Warner Robins, GA
- Population (ZIP)
- 58,585
- Household income
- $83,082
- Rent vs Own
- Severe rent burden
- 1668.0
Population outlook (Houston County) Hauer SSP2
- Today (2025)
- 169,502 people
- By 2030
- 178,486 · +5.3%
- By 2040
- 194,642 · +14.8%
- By 2050
- 207,119 · +22.2%
- By 2075
- 231,480 · +36.6%
- By 2100
- 235,034 · +38.7%
Race, ethnicity, and origin ACS 2023
- Neighborhood character
- Diverse neighborhood (Simpson 0.63)
- Race & ethnicity
- White 51% Black 32% Two or more races 9% Hispanic / Latino 7% Asian 4%
- Hispanic origin (detail)
- Mexican 4%
- Common ancestry
- Romanian 2% Slovak 2% Lithuanian 2%
- Foreign-born
- 9% · Canada, Vietnam, Jamaica
- Languages at home
- 90% English-only · Spanish 5% Other Asian/Pacific 2% Vietnamese 2%
Political lean MEDSL · Houston
- 2024 margin
- R (+11.3) · D 44.0% · R 55.3%
- 2008→2024 swing
- +8.9pp toward D · 2008: -20.2pp · 2024: -11.3pp
- All cycles
- 2024: R+11.3 2020: R+12.4 2016: R+21.6 2012: R+20.7 2008: R+20.2
Not yet ingested
- Civics
- —
Market trends
- HPI YoY
- ▼ -135.75%
- Current HPI
- 219.8261
- Rent YoY
- ▲ 1.67%
- Metro
- Warner Robins, GA
- State GDP YoY
- ▲ 2.66%
- F500 in state
- 28
Industry mix (Fortune 500 HQ in GA)
| Industry | F500 HQs | Revenue |
|---|---|---|
| Paper / Packaging | 2 | $29B |
|
||
| Retail | 1 | $160B |
|
||
| Transportation / Logistics | 1 | $91B |
|
||
| Airlines | 1 | $62B |
|
||
| Consumer Goods | 1 | $47B |
|
||
| Utilities | 1 | $25B |
|
||
Price history
-96.5% since first listed15 events — show timeline
- 2026-02-09 Rental Removed $1,100 CGMLS
- 2025-10-22 Listed for Rent $1,100 CGMLS
- 2025-10-05 Listed $215,000 CGMLS
- 2024-12-24 Rental Removed $1,100 CGMLS
- 2024-12-05 Listed for Rent $1,100 CGMLS
- 2024-07-31 Rental Removed $1,100 CGMLS
- 2024-07-25 Listed for Rent $1,100 CGMLS
- 2024-05-18 Rental Removed $1,100 CGMLS
- 2024-02-07 Listed for Rent $1,100 CGMLS
- 2023-03-21 Sold (Public Records) $205,000 Public Records
- 2022-06-28 Sold (MLS) $276,000 CGMLS
- 2022-02-15 Listed $281,250 CGMLS
- 2005-08-19 Sold (Public Records) $45,000 Public Records
- 2004-02-26 Sold (Public Records) $40,000 Public Records
- 1995-07-21 Sold (Public Records) $31,250 Public Records
Property tax history
+2.3%/yrLatest (2025): $572 · +11.8% YoY. Source: county tax records.
Cash-flow waterfall
monthlySold comps — $/sqft
last 12 mo · ≤1 miLoading sold comps…