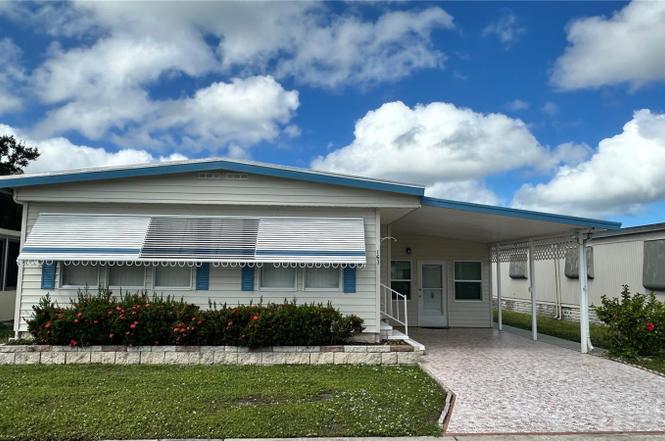
5619 Bayshore Rd #163 · Memphis, FL
Flood risk 3/10 · Minor
- FEMA flood zone
- X (unshaded)
- Chance of flooding over 30 yrs
- 0.12%
- Est. flood insurance / yr
- $507 – $1,088
Fire risk 1/10 · Minimal
- Est. fire insurance / yr
- $947 – $1,759
Heat risk 10/10 · Severe
- Hot days now (above 107°F)
- 7 days/yr
- Hot days in 30 yrs
- 30 days/yr
Wind risk 10/10 · Severe
- Chance of severe wind over 30 yrs
- 99.0%
Air-quality risk 3/10 · Minor
- Unhealthy air days now
- 2 days/yr
- Unhealthy air days in 30 yrs
- 3 days/yr
Risk factors via First Street. Map © Google.
Why this score? — see what drove the C+ grade
The composite is a weighted blend of 9 inputs, each scored 0–100. Each bar is that input's sub-score; the figure is the points it added to the 100-point composite (weight × sub-score).
- Cash flow +30.0/30.0
- 1% rule +10.0/10.0
- DSCR +10.0/10.0
- Schools +4.4/10.0
- Livability +3.2/5.0
- Condition / age +2.5/5.0
- Rent growth +1.8/5.0
- ARV discount +1.1/15.0
- Appreciation +0.0/10.0
$129,000
🖨 Deal sheet (PDF) 📄 Offer letter ✓ Due diligence
Listing remarks
Experience easy Florida living in the land-owned 55+ community of Terra Ceia Manor! This well-maintained home offers both comfort and charm inside and out and is turnkey! Step into a spacious living area with beautiful laminate flooring, filled with natural light from the home’s recently updated windows. The layout features two nicely sized bedrooms with spacious walk-in closets, providing plenty of room for relaxation or visiting guests. A newer roof offers peace of mind, while the home’s thoughtful updates ensure it’s move-in ready. You’ll find a large enclosed sitting area—perfect for enjoying Florida’s breezy afternoons—and a convenient storage
Key facts
- Clubhouse
- Updated windows
- Newer roof
Tags
Property features AI
Finance
- Other: Directions: Heading North on 41, turn left on Bayshore Rd, left into Terra Ceia Manor, continue on 1st St to home on left
- Financial info: Lease restrictions apply; Turnkey (furnished); Total annual fees reported as $2,256
- HOA & community: Monthly association fee of $188 (includes structure maintenance, sewer, trash, water); Association approval required; Buyer approval required; Clubhouse; Community mailbox; Deed restrictions; Golf carts allowed; Community pool; Senior community; Pets allowed
Exterior
- Parking: Carport (1 space)
- Utilities: Public water; Public sewer; Electricity connected; Water connected; Sewer connected
- Home design: Manufactured home (double wide); One story; East-facing; Entry on one level
- Construction: Vinyl siding; Metal roof; Crawlspace foundation; Building area about 2,190 sq ft
- Exterior features: Storage; Asphalt road frontage
Interior
- Kitchen: Dishwasher; Range; Refrigerator; Electric water heater
- Bedrooms: 2 bedrooms
- Flooring: Carpet; Laminate
- Bathrooms: 2 full bathrooms
- Heating & cooling: Central heating; Central air conditioning
- Interior features: Living room and dining room combo; Thermostat; Walk-in closet(s); Window treatments
- Laundry & utility: Outdoor laundry area; Dryer
Neighborhood map
What this means for you Summary
Snapshot
- This is a 2-bed/1.0-bath manufactured listed at $129k.
Deal economics
- At list price, monthly cash flow is $546 ($7k/yr) — positive.
- The deal already cash-flows at list — no discount required.
- Meets the 1% rule at list price ($2k rent vs $129k).
- Recommended offer: $114k (12.0% below list) — sets the bar for market timing.
- Cap rate 11.4% vs local median 4.5% in Memphis — top-decile yield for the area; either an underpriced asset or a hidden risk that comps aren't pricing in. Stress-test before assuming the spread holds.
Location & tenants
- Location reads 63/100 on livability (#745 in FL) — a middle-class / working-renter tenant base. Strengths: cost of living A+, housing A+; Watch: employment D+, schools F, amenities F.
- Manatee (suburban): math 54% / reading 50% proficiency, ranked #26 of 73 in FL (top 36%) — acceptable for families but not a draw, mixed tenant base, ~2y average lease.
- Market conditions: Rents soft (-3.0%/yr); 1160 active listings in the ZIP; 3 comparable units currently listed for rent nearby; rentals at typical pace (median 24d on market — plan ~3-4 weeks tenant-placement turnaround); solid renter incomes; 7,472 units permitted in Manatee County in 2024 (1,782 in 5+ unit buildings).
- This rent runs 31% of the median local income ($78k/yr) — at the standard rent-burdened threshold; future hikes will face affordability resistance.
Forward outlook
- Local home prices are declining (-3.0%/yr); year-one equity from $892 of loan paydown is wiped out by about $4k of value loss. Plan a longer hold.
- Manatee County population projected at +43% by 2050 — long-run rental-demand tailwind backs the buy-and-hold thesis.
- At projected returns (-3.0% appreciation + 0.0% rent growth), your $36k cash investment doubles in ~10 years — after that, you're playing with house money.
Negotiation context
- It's been on market 252 days — a 12% lower offer ($114k) is reasonable based on typical stale-listing flexibility.
- Current owner paid $70k; list at $129k implies a 84% gain — meaningful room to come down on a strong offer.
Risks & watch-outs
- Climate carrying-cost: severe wind risk, 99% chance of damaging wind over 30y; extreme-heat days projected 7→30/yr by 2055 (HVAC capex compounding) — expect insurance premiums to compound above CPI over the hold.
Questions for the listing agent
- It's been on market 252 days. Have you received any prior offers? Is the seller open to a 12% concession, seller financing, or rate buy-down credit?
- What does the HOA fee cover, when was the last increase, and are there any pending special assessments or reserve-fund shortfalls?
- Why hasn't it sold? Are there any deal-killer items the seller is aware of (foundation, flood, title, zoning, code violations)?
- Is there a deadline driving the sale (1031 exchange, divorce, estate, relocation)? That informs how much negotiation room exists.
- Schools are F-rated, which usually means shorter tenancies and higher turnover. Who's the typical renter profile here, and what's been the actual vacancy rate?
- What's the average days-on-market for RENTAL listings here right now (not sales)? A rising rental-DOM trend means longer vacancies and softer asking-rent achievability than the comps imply.
- What's the recent tenant-quality profile in this submarket — average credit score on applications, eviction rate, late-payment / NSF rate, and stable-employment percentage? A property-management company in the area should have these aggregated.
- How much new for-sale + rental construction is in the pipeline within 1–3 miles? Heavy new supply typically softens prices + rents 12–24 months out; constrained supply supports both.
Investment metrics
- 1% rule
- 1.54% ✓
- Cap rate
- 11.37%
- Cash-on-cash
- 18.13%
- DSCR
- 1.81
- GRM
- 5.4
CMA / ARV
- ARV (on-the-fly)
- $112,896
- Comps found
- 3
Show comp detail 3 sales within ~0.75 mi
| Address | Dist | Beds/Ba | Sqft | Sold | Price | $/sf | Match |
|---|---|---|---|---|---|---|---|
| 5619 Bayshore Rd #164 | 0.02mi | 2/2.0 | 1,224 (+6%) | 2mo | $120,000 | $98 | 82 |
| 5619 Bayshore Rd #142 | 0.11mi | 2/2.0 | 1,056 (-8%) | 2mo | $125,000 | $118 | 75 |
| 420 49th St E #48 | 0.46mi | 3/2.0 (+1) | 1,296 (+12%) | 2mo | $110,000 | $85 | 47 |
Match score weights: distance 35% · size 25% · config 20% · recency 20%. Top-matched comps best support the ARV.
Projected returns pro-forma
-3.0% appreciation · 0.0% rent growth · sell at horizon
- IRR
- 6.0%
- Equity multiple
- 1.22×
- Total profit
- $8,124
- Equity at exit
- $19,234
- IRR
- 12.2%
- Equity multiple
- 1.82×
- Total profit
- $29,721
- Equity at exit
- $11,154
Cash invested: $36,120 (down + closing). Projections, not guarantees.
Landlord ↔ Tenant lean methodology
- Overall (STATE)
- 87 Strongly Landlord-Friendly
- State Florida
- 87 Strongly Landlord-Friendly · R+3
- County
- — inherits STATE
- City
- — inherits STATE
ZIP-level market 34221
- Rents YoY
- -3.0%
- Active inventory
- 1160
- Price-to-rent
- 5.4×
Monthly cashflow live
- Estimated rent
- $1,992 medium interval (Pro) →
- Mortgage (P&I)
- −$676
- Tax from tax record
- −$110 /mo · $1,321/yr
- Insurance
- −$54
- HOA
- −$188
- Vacancy / Maint / Mgmt
- −$418
- Net cashflow
- $546
Break-even live
Sensitivity live
| Price | -10% $619 | -5% $582 | +0% $546 | +5% $509 | +10% $473 |
|---|---|---|---|---|---|
| Rent | -10% $388 | -5% $467 | +0% $546 | +5% $624 | +10% $703 |
| Rate | -1.0pp $611 | -0.5pp $578 | base $546 | +0.5pp $512 | +1.0pp $478 |
UW: 25.0% down · 7.5% · 30yr · 1.5% tax · 5.0% vac · 8.0% maint · 8.0% mgmt
Financing live
Cash to close
- Down payment
- $32,250
- Closing costs
- $3,870
- Reserves months
- —
- Total cash needed
- —
Loan-product check · same deal, 3 products live
Conventional
25% down · 7.5% · 30yr
- Down + closing
- —
- Monthly P&I
- —
- Monthly cashflow
- —
- DSCR
- —
- Eligible?
- —
Personal DTI + credit; lowest rate.
DSCR
20% down · 8.5% · 30yr
- Down + closing
- —
- Monthly P&I
- —
- Monthly cashflow
- —
- DSCR
- —
- Eligible?
- —
No personal income docs; deal must DSCR.
Hard money
10% down · 12.0% · 12mo
- Down + closing
- —
- Monthly P&I
- —
- Monthly cashflow
- —
- DSCR
- —
- Eligible?
- —
Short-term bridge; refi at stabilization.
Rent comps 3 comps
| Address | Beds | Baths | Sqft | Rent | $/sqft | DOM | Units | Dist |
|---|---|---|---|---|---|---|---|---|
| 4721 1st Ave E #4721 Palmetto, FL | 3.0 | 2.0 | 1460 | $2,000 | $1.37 | 24d | 1 | 0.69mi |
| 515 45th St E Palmetto, FL | 2.0 | 2.0 | 900 | $2,100 | $2.33 | 24d | 1 | 0.87mi |
| 709 45th St E Palmetto, FL | 2.0 | 2.0 | 1000 | $1,550 | $1.55 | 3d | 1 | 0.94mi |
HOA detail
- Monthly dues
- $188 · $2,256/yr
Listing history 19 events
-
2026-06-18days on market $129,000 Active 252 DOM
-
2026-06-17days on market $129,000 Active 251 DOM
-
2026-06-16days on market $129,000 Active 250 DOM
-
2026-06-15days on market $129,000 Active 249 DOM
-
2026-06-13days on market $129,000 Active 247 DOM
-
2026-06-13days on market $129,000 Active 246 DOM
-
2026-06-10days on market $129,000 Active 244 DOM
-
2026-06-09days on market $129,000 Active 243 DOM
-
2026-06-08days on market $129,000 Active 242 DOM
-
2026-06-08days on market $129,000 Active 241 DOM
-
2026-06-03days on market $129,000 Active 237 DOM
-
2026-06-02days on market $129,000 Active 236 DOM
-
2026-06-01days on market $129,000 Active 235 DOM
-
2026-05-31days on market $129,000 Active 234 DOM
-
2026-05-19price $129,000
-
2026-04-02price $149,000
-
2026-01-19price $160,000
-
2025-10-09$165,000 Active
-
2014-04-21soldstatus $70,000
ⓘ Source: listings_history table (triggers on properties + properties_extension) + one-shot
backfill from property_details.listing_events for pre-trigger history.
Tax reassessment forecast FL · Resets to sale price
- Current annual tax
- $1,321 · $110/mo
- Projected year-2 tax
- $1,321 · $110/mo
- Expected delta
- $0/yr ($0/mo · 0.0%)
ⓘ Screening estimate from a state-policy table — verify with the county assessor before closing.
Climate risk First Street
- Flood 3/10 Moderate FEMA zone X (unshaded) · 12% chance over 30 yrs
- Wildfire 1/10 Low
- Heat 10/10 Extreme 7 d/yr ≥107°F today · 30 d/yr by 30 yrs out
- Wind 10/10 Extreme 99% chance of damaging wind over 30 yrs
- Air quality 3/10 Moderate 2 unhealthy d/yr today · 3 by 30 yrs out
Nearby sold comps map
Loading sold comps map…
Walkable amenities ~0.75 mi
Loading nearby amenities…
Taxation est. · year 1
- Rental income
- $23,908
- − Mortgage interest
- −$7,226
- − Property taxes
- −$1,321
- − Insurance
- −$645
- − Repairs & maintenance
- −$1,913
- − Management
- −$1,913
- − HOA
- −$2,256
- − Depreciation
- −$3,753
- Taxable income
- $4,882
- Est. tax owed @ 24.0%
- −$1,172
- After-tax cash flow
- $5,376/yr
For passive investors: Depreciation is non-cash, so a rental often shows a tax loss while cash-flowing — sheltering income. Rental losses are passive: they offset passive income freely, and up to $25,000/yr can offset ordinary (W-2) income if you actively participate and your MAGI is under $100k (phasing out to $0 by $150k); unused losses carry forward. On sale, claimed depreciation is recaptured at up to 25%, and gains may owe capital-gains tax (a 1031 exchange can defer both). Figures are a year-1 estimate at your 24.0% rate — not tax advice; consult a CPA.
Schools (NCES district)
- District
- Manatee
- NCES district ID
- 1201230
- Math proficiency
- 54% ▼ -6.00%
- Reading proficiency
- 50% ▼ -2.00%
- Median HH income
- $49,607
- Composite
- 44.43/100
- National rank
- #2806
- State rank
- #26 of 73 in FL
Livability — Memphis
- Score
- 63/100
- State rank
- #745
- US rank
- #16072
Category grades
Schools grade is shown separately in the Schools card above.
Census & demographics
- County
- Manatee County · 416,364 people
- Metro
- North Port-Sarasota-Bradenton, FL
- Population (ZIP)
- 56,208
- Household income
- $77,712
- Rent vs Own
- Severe rent burden
- 1193.0
Population outlook (Manatee County) Hauer SSP2
- Today (2025)
- 447,342 people
- By 2030
- 488,911 · +9.3%
- By 2040
- 567,934 · +27.0%
- By 2050
- 637,995 · +42.6%
- By 2075
- 781,970 · +74.8%
- By 2100
- 848,272 · +89.6%
Race, ethnicity, and origin ACS 2023
- Neighborhood character
- Diverse neighborhood (Simpson 0.58)
- Race & ethnicity
- White 59% Hispanic / Latino 22% Black 14% Two or more races 11%
- Hispanic origin (detail)
- Mexican 14% Puerto Rican 3%
- Common ancestry
- Romanian 2% Lithuanian 2% Italian 2%
- Foreign-born
- 10% · Canada, Dominican Republic, Jamaica
- Languages at home
- 81% English-only · Spanish 16% Other Indo-European 1%
Political lean MEDSL · Manatee
- 2024 margin
- Strong R (+23.5) · D 37.9% · R 61.4%
- 2008→2024 swing
- -16.5pp toward R · 2008: -7.0pp · 2024: -23.5pp
- All cycles
- 2024: R+23.5 2020: R+16.1 2016: R+17.1 2012: R+12.5 2008: R+7.0
Not yet ingested
- Civics
- —
Market trends
- HPI YoY
- ▼ -383.53%
- Current HPI
- 302.1458
- Rent YoY
- ▼ -2.98%
- Metro
- North Port-Sarasota-Bradenton, FL
- State GDP YoY
- ▲ 3.28%
- F500 in state
- 36
Industry mix (Fortune 500 HQ in FL)
| Industry | F500 HQs | Revenue |
|---|---|---|
| Industrial Technology | 2 | $29B |
|
||
| Insurance | 2 | $17B |
|
||
| Retail | 1 | $60B |
|
||
| Technology Distribution | 1 | $58B |
|
||
| Homebuilding | 1 | $35B |
|
||
| Technology Manufacturing | 1 | $35B |
|
||
Price history
+84.3% since first listed5 events — show timeline
- 2026-05-19 Price Changed $129,000 Stellar MLS as Distributed by MLS Grid
- 2026-04-02 Price Changed $149,000 Stellar MLS as Distributed by MLS Grid
- 2026-01-19 Price Changed $160,000 Stellar MLS as Distributed by MLS Grid
- 2025-10-09 Listed $165,000 Stellar MLS as Distributed by MLS Grid
- 2014-04-21 Sold (Public Records) $70,000 Public Records
Property tax history
+11.2%/yrLatest (2025): $1,321 · -7.7% YoY. Source: county tax records.
Cash-flow waterfall
monthlySold comps — $/sqft
last 12 mo · ≤1 miLoading sold comps…