 14-Plex
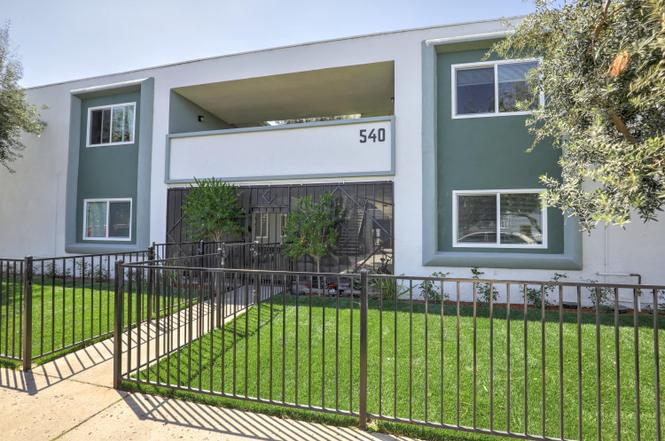
540 Cuesta Del Mar Dr · Oxnard, CA
Flood risk 1/10 · Minimal
- FEMA flood zone
- X (shaded)
- Chance of flooding over 30 yrs
- 0.0%
- Est. flood insurance / yr
- $507 – $1,088
Fire risk 4/10 · Minor
- Est. fire insurance / yr
- $659 – $1,223
Heat risk 4/10 · Minor
- Hot days now (above 82°F)
- 7 days/yr
- Hot days in 30 yrs
- 17 days/yr
Wind risk 1/10 · Minimal
- Chance of severe wind over 30 yrs
- —
Air-quality risk 5/10 · Moderate
- Unhealthy air days now
- 6 days/yr
- Unhealthy air days in 30 yrs
- 7 days/yr
Risk factors via First Street. Map © Google.
Why this score? — see what drove the B- grade
The composite is a weighted blend of 9 inputs, each scored 0–100. Each bar is that input's sub-score; the figure is the points it added to the 100-point composite (weight × sub-score).
- Cash flow +30.0/30.0
- DSCR +10.0/10.0
- 1% rule +9.7/10.0
- ARV discount +7.5/15.0
- Livability +2.7/5.0
- Rent growth +2.5/5.0
- Schools +2.5/10.0
- Condition / age +2.5/5.0
- Appreciation +0.0/10.0
$3,100,000
🖨 Deal sheet (PDF) 📄 Offer letter ✓ Due diligence
Multi-family units
County records classify this as Multi-Family (5+ Unit). Listing-text estimate: 14 units. confirmed
5+ unit building — per-unit beds/baths from public records are typically unavailable; the breakdown below (if shown) is an estimate from the listing text.
Listing remarks MLS
This 14 unit apartment community in South Oxnard presents a compelling opportunity for investors seeking strong cash flow, stable operations, and long term value growth. Priced at $3,100,000 (approximately $221,430 per unit), the property generates an estimated $315,000 in annual gross income, resulting in a highly attractive Gross Rent Multiplier (GRM) of 9.9. The unit mix includes 10 one-bedroom units, 2 two-bedroom units, and 2 three-bedroom units, all surrounding a welcoming central courtyard. Over the past several years, the property has undergone approximately $263,300 in capital improvements, including the recent installation of bathroom exhaust fans in every unit to reduce moisture and improve long term durability. With major upgrades already completed and minimal property deferred maintenance, the next owner can expect stable operations and continued financial performance.
Key facts
- Central courtyard
- 0.26 acre lot
- Parking
Tags
Property features AI
Finance
- Financial info: Unit-level rents reported: ten 1-bed units at $1,761 each, two 2-bed units at $1,860 each, two 3-bed units at $2,420 each; Monthly rent totals reported by unit group: $17,610 (1-bed group), $3,720 (2-bed group), $4,840 (3-bed group)
Exterior
- Parking: Carport
- Utilities: Heating available
- Home design: Multi-family property
- Exterior features: Zoned R-4
Interior
- Bedrooms: Ten 1-bedroom units; Two 2-bedroom units; Two 3-bedroom units
- Bathrooms: One bathroom in each unit (total bathrooms correspond to unit counts listed)
- Heating & cooling: Wall furnaces for heating
- Interior features: Multi-family building with 14 total units; Units include a mix of 1-, 2-, and 3-bedroom apartments
Neighborhood map
What this means for you Summary
Snapshot
- This is a 14 × 20-bed/14.0-bath units multifamily listed at $3.10M.
Deal economics
- At list price, monthly cash flow is $15k ($184k/yr) — positive. Per door: $1k/mo.
- The deal already cash-flows at list — no discount required.
- Meets the 1% rule at list price ($45k rent vs $3.10M).
- Cap rate 12.2% vs local median 2.5% in Oxnard — top-decile yield for the area; either an underpriced asset or a hidden risk that comps aren't pricing in. Stress-test before assuming the spread holds.
Location & tenants
- Location reads 54/100 on livability (#905 in CA) — a working-class tenant base; expect higher turnover. Strengths: employment A-, health & safety A-, housing B; Watch: schools F, crime F, amenities D-.
- Hueneme Elementary (urban): math 17% / reading 30% proficiency, ranked #1,163 of 1,400 in CA (top 83%) — low school quality limits family demand, transient renter base, plan for 1-2y turnover; 70% free/reduced lunch — lower-income household profile, screen leases tightly.
- Market conditions: Rents flat; 31 active listings in the ZIP; solid renter incomes; 1,759 units permitted in Ventura County in 2024 (1,196 in 5+ unit buildings).
- At $45,463/mo this rent would consume 625% of the median local household income ($87k/yr) (locally 1968% of renters already pay >50% of income on rent) — very limited rent-growth headroom before tenants either downsize or default.
Forward outlook
- Local home prices are declining (-3.0%/yr); year-one equity from $21k of loan paydown is wiped out by about $93k of value loss. Plan a longer hold.
- Ventura County population projected at +4% by 2050 — modest demand growth; plan on rents tracking national, not racing it.
- At projected returns (-3.0% appreciation + 0.0% rent growth), your $868k cash investment doubles in ~8 years — after that, you're playing with house money.
Negotiation context
- Only 1 days on market — expect competitive offers; lowballing is unlikely to land.
- 19 sale attempts since 33y ago with the ask held roughly flat each time — persistent listings suggest the price (not the market) is what's stuck; bring a comps-based counter.
- Current owner paid $2.60M; 19% above their basis — modest negotiation headroom, anchor on the comps not their cost.
Questions for the listing agent
- Can we see the unit-by-unit rent roll, current vacancy, and any below-market leases? What's the average tenancy length?
- What capital expenditures (roof, boiler, parking lot, exteriors) have been made in the last 5 years, and what's planned in the next 2?
- Built in 1964 — when were the roof, HVAC, electrical panel, plumbing, and water heater last replaced?
- Is there a deadline driving the sale (1031 exchange, divorce, estate, relocation)? That informs how much negotiation room exists.
- Schools are F-rated, which usually means shorter tenancies and higher turnover. Who's the typical renter profile here, and what's been the actual vacancy rate?
- Crime grade is F in this area — have there been break-ins, vandalism, or insurance claims at this property in the last 3 years? What carrier currently insures it and at what premium?
- What's the average days-on-market for RENTAL listings here right now (not sales)? A rising rental-DOM trend means longer vacancies and softer asking-rent achievability than the comps imply.
- What's the recent tenant-quality profile in this submarket — average credit score on applications, eviction rate, late-payment / NSF rate, and stable-employment percentage? A property-management company in the area should have these aggregated.
- How much new apartment / multifamily construction is in the pipeline within 1–3 miles? Heavy new supply (>2% of stock underway) typically softens rents 12–24 months out; light construction supports rent growth.
Investment metrics
- 1% rule
- 1.47% ✓
- Cap rate
- 12.23%
- Cash-on-cash
- 21.19%
- DSCR
- 1.94
- GRM
- 5.7
CMA / ARV
No comps found within radius.
Projected returns pro-forma
-3.0% appreciation · 0.01% rent growth · sell at horizon
- IRR
- 10.3%
- Equity multiple
- 1.39×
- Total profit
- $341,306
- Equity at exit
- $462,220
- IRR
- 16.9%
- Equity multiple
- 2.20×
- Total profit
- $1,041,673
- Equity at exit
- $268,031
Cash invested: $868,000 (down + closing). Projections, not guarantees.
Landlord ↔ Tenant lean methodology
- Overall (STATE)
- 18 Strongly Tenant-Friendly
- State California
- 18 Strongly Tenant-Friendly · D+13
- County
- — inherits STATE
- City
- — inherits STATE
ZIP-level market 93033
- Rents YoY
- 0.0%
- Active inventory
- 31
- Price-to-rent
- 79.6×
Monthly cashflow live
- Estimated rent
- $45,463 medium interval (Pro) →
- Mortgage (P&I)
- −$16,257
- Tax from tax record
- −$3,039 /mo · $36,468/yr
- Insurance
- −$1,292
- HOA
- −$0
- Vacancy / Maint / Mgmt
- −$9,547
- Net cashflow
- $15,328
Break-even live
Sensitivity live
| Price | -10% $17,083 | -5% $16,206 | +0% $15,328 | +5% $14,451 | +10% $13,573 |
|---|---|---|---|---|---|
| Rent | -10% $11,737 | -5% $13,533 | +0% $15,328 | +5% $17,124 | +10% $18,920 |
| Rate | -1.0pp $16,889 | -0.5pp $16,117 | base $15,328 | +0.5pp $14,525 | +1.0pp $13,708 |
14-unit breakdown (identical units grouped — click to expand)
| Units | Beds | Baths | Est. rent |
|---|---|---|---|
| 14× units | 20 | 14 | $45,458 |
| #1 | 20 | 14 | $3,247 |
| #2 | 20 | 14 | $3,247 |
| #3 | 20 | 14 | $3,247 |
| #4 | 20 | 14 | $3,247 |
| #5 | 20 | 14 | $3,247 |
| #6 | 20 | 14 | $3,247 |
| #7 | 20 | 14 | $3,247 |
| #8 | 20 | 14 | $3,247 |
| #9 | 20 | 14 | $3,247 |
| #10 | 20 | 14 | $3,247 |
| #11 | 20 | 14 | $3,247 |
| #12 | 20 | 14 | $3,247 |
| #13 | 20 | 14 | $3,247 |
| #14 | 20 | 14 | $3,247 |
| Total (14 units) | $45,463 | ||
UW: 25.0% down · 7.5% · 30yr · 1.5% tax · 5.0% vac · 8.0% maint · 8.0% mgmt
Financing live
Cash to close
- Down payment
- $775,000
- Closing costs
- $93,000
- Reserves months
- —
- Total cash needed
- —
Loan-product check · same deal, 3 products live
Conventional
25% down · 7.5% · 30yr
- Down + closing
- —
- Monthly P&I
- —
- Monthly cashflow
- —
- DSCR
- —
- Eligible?
- —
Personal DTI + credit; lowest rate.
DSCR
20% down · 8.5% · 30yr
- Down + closing
- —
- Monthly P&I
- —
- Monthly cashflow
- —
- DSCR
- —
- Eligible?
- —
No personal income docs; deal must DSCR.
Hard money
10% down · 12.0% · 12mo
- Down + closing
- —
- Monthly P&I
- —
- Monthly cashflow
- —
- DSCR
- —
- Eligible?
- —
Short-term bridge; refi at stabilization.
Listing history 2 events
-
2026-06-17remarks 607-char remark
Show marketing remark (895 chars)
This 14 unit apartment community in South Oxnard presents a compelling opportunity for investors seeking strong cash flow, stable operations, and long term value growth. Priced at $3,100,000 (approximately $221,430 per unit), the property generates an estimated $315,000 in annual gross income, resulting in a highly attractive Gross Rent Multiplier (GRM) of 9.9. The unit mix includes 10 one-bedroom units, 2 two-bedroom units, and 2 three-bedroom units, all surrounding a welcoming central courtyard. Over the past several years, the property has undergone approximately $263,300 in capital improvements, including the recent installation of bathroom exhaust fans in every unit to reduce moisture and improve long term durability. With major upgrades already completed and minimal property deferred maintenance, the next owner can expect stable operations and continued financial performance.
-
2026-06-17$3,100,000 Active 1 DOM
Show marketing remark (895 chars)
This 14 unit apartment community in South Oxnard presents a compelling opportunity for investors seeking strong cash flow, stable operations, and long term value growth. Priced at $3,100,000 (approximately $221,430 per unit), the property generates an estimated $315,000 in annual gross income, resulting in a highly attractive Gross Rent Multiplier (GRM) of 9.9. The unit mix includes 10 one-bedroom units, 2 two-bedroom units, and 2 three-bedroom units, all surrounding a welcoming central courtyard. Over the past several years, the property has undergone approximately $263,300 in capital improvements, including the recent installation of bathroom exhaust fans in every unit to reduce moisture and improve long term durability. With major upgrades already completed and minimal property deferred maintenance, the next owner can expect stable operations and continued financial performance.
ⓘ Source: listings_history table (triggers on properties + properties_extension) + one-shot
backfill from property_details.listing_events for pre-trigger history.
Tax reassessment forecast CA · Resets to sale price
- Current annual tax
- $36,468 · $3,039/mo
- Projected year-2 tax
- $36,468 · $3,039/mo
- Expected delta
- $0/yr ($0/mo · 0.0%)
ⓘ Screening estimate from a state-policy table — verify with the county assessor before closing.
Climate risk First Street
- Flood 1/10 Low FEMA zone X (shaded) · 0% chance over 30 yrs
- Wildfire 4/10 Moderate
- Heat 4/10 Moderate 7 d/yr ≥82°F today · 17 d/yr by 30 yrs out
- Wind 1/10 Low
- Air quality 5/10 Major 6 unhealthy d/yr today · 7 by 30 yrs out
Nearby sold comps map
Loading sold comps map…
Walkable amenities ~0.75 mi
Loading nearby amenities…
Taxation est. · year 1
- Rental income
- $545,556
- − Mortgage interest
- −$173,648
- − Property taxes
- −$36,468
- − Insurance
- −$15,500
- − Repairs & maintenance
- −$43,644
- − Management
- −$43,644
- − Depreciation
- −$90,182
- Taxable income
- $142,469
- Est. tax owed @ 24.0%
- −$34,192
- After-tax cash flow
- $149,748/yr
For passive investors: Depreciation is non-cash, so a rental often shows a tax loss while cash-flowing — sheltering income. Rental losses are passive: they offset passive income freely, and up to $25,000/yr can offset ordinary (W-2) income if you actively participate and your MAGI is under $100k (phasing out to $0 by $150k); unused losses carry forward. On sale, claimed depreciation is recaptured at up to 25%, and gains may owe capital-gains tax (a 1031 exchange can defer both). Figures are a year-1 estimate at your 24.0% rate — not tax advice; consult a CPA.
Schools (NCES district)
- District
- Hueneme Elementary
- NCES district ID
- 0617850
- Math proficiency
- 17% ▼ -1.00%
- Reading proficiency
- 30% ▲ 2.00%
- Median HH income
- $57,897
- Composite
- 24.64/100
- National rank
- #13046
- State rank
- #1163 of 1400 in CA
Livability — Oxnard
- Score
- 54/100
- State rank
- #905
- US rank
- #24028
Category grades
Schools grade is shown separately in the Schools card above.
Census & demographics
- Census place
- Oxnard, CA
- County
- Ventura County · 829,955 people
- City population
- 213,176
- Metro
- Oxnard-Thousand Oaks-Ventura, CA
- Population (ZIP)
- 78,737
- Household income
- $87,309
- Rent vs Own
- Severe rent burden
- 1968.0
Population outlook (Ventura County) Hauer SSP2
- Today (2025)
- 895,754 people
- By 2030
- 912,134 · +1.8%
- By 2040
- 931,454 · +4.0%
- By 2050
- 934,609 · +4.3%
- By 2075
- 924,899 · +3.3%
- By 2100
- 864,712 · -3.5%
Race, ethnicity, and origin ACS 2023
- Neighborhood character
- Predominantly Hispanic (86%)
- Race & ethnicity
- Hispanic / Latino 86% Two or more races 36% Asian 7% White 5% Native American 4%
- Hispanic origin (detail)
- Mexican 82%
- Foreign-born
- 41% · Canada, Vietnam
- Languages at home
- 20% English-only · Spanish 72% Tagalog/Filipino 4%
Political lean MEDSL · Ventura
- 2024 margin
- D (+15.1) · D 56.1% · R 41.0% · Other 2.9%
- 2008→2024 swing
- +2.8pp toward D · 2008: 12.3pp · 2024: 15.1pp
- All cycles
- 2024: D+15.1 2020: D+21.1 2016: D+16.8 2012: D+5.3 2008: D+12.3
Not yet ingested
- Civics
- —
Market trends
- HPI YoY
- ▼ -824.11%
- Current HPI
- 348.9793
- Rent YoY
- ▬ 0.01%
- Metro
- Oxnard-Thousand Oaks-Ventura, CA
- State GDP YoY
- ▲ 3.21%
- F500 in state
- 116
Industry mix (Fortune 500 HQ in CA)
| Industry | F500 HQs | Revenue |
|---|---|---|
| Technology | 27 | $1,492B |
|
||
| Financial Services | 3 | $174B |
|
||
| Retail | 3 | $44B |
|
||
| Insurance | 3 | $26B |
|
||
| Media / Entertainment | 2 | $115B |
|
||
| Pharmaceuticals / Biotech | 2 | $62B |
|
||
Price history
+313.3% since first listed50 events — show timeline
- 2026-06-17 Listed $3,100,000 CRMLS
- 2026-06-17 Listed $3,100,000 SBMLS
- 2017-01-02 Sold (MLS) $2,600,000 SDMLS
- 2017-01-02 Sold (MLS) $2,600,000 CRMLS
- 2017-01-02 Sold (MLS) $2,600,000 SBMLS
- 2016-12-29 Sold (Public Records) $2,600,000 Public Records
- 2016-10-18 Pending — SBMLS
- 2016-10-18 Pending — CRMLS
- 2016-10-12 Listed $2,650,000 SBMLS
- 2016-10-12 Listed $2,650,000 CRMLS
- 2016-10-12 Listed $2,650,000 SDMLS
- 2016-05-02 Listing Removed — SDMLS
- 2016-05-02 Listing Removed — CRMLS
- 2016-05-02 Listing Removed — SBMLS
- 2016-01-27 Listed $2,475,000 SBMLS
- 2016-01-27 Listed $2,475,000 CRMLS
- 2016-01-27 Listed $2,475,000 SDMLS
- 2015-01-29 Sold (MLS) $1,700,000 CRMLS
- 2015-01-29 Sold (MLS) $1,700,000 SBMLS
- 2015-01-28 Sold (Public Records) $1,700,000 Public Records
- 2014-12-23 Pending — CRMLS
- 2014-12-10 Pending — CRMLS
- 2014-11-20 Pending — CRMLS
- 2014-11-18 Contingent — SBMLS
- 2014-11-12 Listed $1,700,000 SBMLS
- 2014-11-12 Listed $1,700,000 CRMLS
- 2011-03-17 Listing Removed — CRMLS
- 2011-03-03 Price Changed $1,300,000 CRMLS
- 2010-12-30 Price Changed $1,350,000 CRMLS
- 2010-10-27 Listed $1,350,000 SBMLS
- 2010-10-22 Listed $1,449,000 CRMLS
- 2010-10-03 Listing Removed — CRMLS
- 2010-07-17 Price Changed $1,549,000 CRMLS
- 2010-05-07 Price Changed $1,599,000 CRMLS
- 2010-03-09 Listed $1,620,000 CRMLS
- 2010-03-08 Listed $1,549,000 SBMLS
- 2005-07-25 Sold (MLS) $1,590,000 SBMLS
- 2005-07-13 Sold (Public Records) $1,590,000 Public Records
- 2005-05-23 Listing Removed — SBMLS
- 2005-05-17 Delisted — CRMLS
- 2005-05-04 Listed — CRMLS
- 2005-05-01 Delisted — CRMLS
- 2005-01-19 Listing Removed — SBMLS
- 2005-01-11 Listed $1,695,000 SBMLS
- 2005-01-10 Listed — CRMLS
- 2005-01-10 Listed $1,695,000 SBMLS
- 2004-06-03 Sold (Public Records) $1,425,000 Public Records
- 2002-02-28 Sold (Public Records) $750,000 Public Records
- 1995-09-04 Delisted — CRMLS
- 1993-10-29 Listed — CRMLS
Property tax history
+3.9%/yrLatest (2025): $36,468 · +1.8% YoY. Source: county tax records.
Cash-flow waterfall
monthlySold comps — $/sqft
last 12 mo · ≤1 miLoading sold comps…