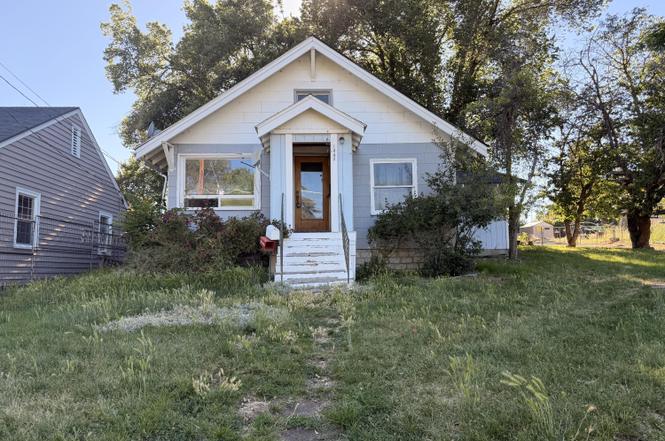
1342 Johnson Ave · Klamath Falls, OR
Flood risk 1/10 · Minimal
- FEMA flood zone
- X
- Chance of flooding over 30 yrs
- 0.0%
- Est. flood insurance / yr
- $507 – $1,088
Fire risk 6/10 · Moderate
- Est. fire insurance / yr
- $498 – $926
Heat risk 3/10 · Minor
- Hot days now (above 91°F)
- 7 days/yr
- Hot days in 30 yrs
- 16 days/yr
Wind risk 1/10 · Minimal
- Chance of severe wind over 30 yrs
- —
Air-quality risk 10/10 · Severe
- Unhealthy air days now
- 29 days/yr
- Unhealthy air days in 30 yrs
- 31 days/yr
Risk factors via First Street. Map © Google.
Why this score? — see what drove the C- grade
The composite is a weighted blend of 9 inputs, each scored 0–100. Each bar is that input's sub-score; the figure is the points it added to the 100-point composite (weight × sub-score).
- Cash flow +16.7/30.0
- ARV discount +15.0/15.0
- DSCR +5.2/10.0
- 1% rule +4.1/10.0
- Livability +3.9/5.0
- Rent growth +3.3/5.0
- Schools +2.7/10.0
- Condition / age +2.5/5.0
- Appreciation +0.0/10.0
$165,000
🖨 Deal sheet 📄 Offer letter ✓ Due diligence
Listing remarks
Roll up your sleeves and make this charming home shine again! 1376 sq ft plus a large loft upstairs ready to make into flex space or tons of storage, this home has hardwoods floors throughout and has a functional layout making it feel larger than it is. 3 bedrooms, 1 bathroom, large living area open to kitchen and dining plus separate laundry area and large linen/storage closet. Forced air furnace, one half of roof was replaced a few years ago. Situated at end of dead-end street, perched atop the hill with views of surrounding mountains and landscape. No neighbors behind for peace and quiet. Large, fenced yard with detached garage with workshop area and separate storage room. Plenty of room
Key facts
- Large loft upstairs
- Workshop area
- Large fenced yard
Tags
Property features AI
Finance
- Other: Property type: Residential; Property subtype: Single family residence; Accessory dwelling unit: No; Zoning: MD
- Financial info: Not rented
- HOA & community: No CCRs listed
Exterior
- Parking: Detached 2-car garage; Driveway parking; RV access/parking; Workshop in garage
- Security: No audio or video surveillance listed
- Utilities: Public water; Public sewer; Public utilities
- Home design: Single family residence; One story; Facing information not provided
- Construction: Built in 1920; Frame construction; Composition roof; Concrete perimeter foundation
- Exterior features: Fenced yard; Level and sloped areas; Paved road access; Storage structure; Additional outbuilding
Interior
- Kitchen: Oven; Range; Refrigerator
- Bedrooms: 3 bedrooms
- Flooring: Hardwood; Vinyl
- Bathrooms: 1 full bathroom
- Heating & cooling: Forced air heating; Wall/window unit(s) for cooling
- Interior features: Built-in features; Ceiling fan(s); Linen closet; Shower/tub combo; Living room; Dining room; Laundry; Other room
- Laundry & utility: Laundry room
Neighborhood map
What this means for you Summary
Snapshot
- This is a 3-bed/1.0-bath single-family listed at $165k.
Deal economics
- At list price, monthly cash flow is $103 ($1k/yr) — positive.
- The deal already cash-flows at list — no discount required.
- To meet the 1% rule (rent ≥ 1% of price), the offer needs to be $149k (9.4% below list).
- Recommended offer: $149k (9.4% below list) — sets the bar for 1% rule.
- Cap rate 7.0% vs local median 3.4% in Klamath Falls — top-decile yield for the area; either an underpriced asset or a hidden risk that comps aren't pricing in. Stress-test before assuming the spread holds.
Location & tenants
- Location reads 78/100 on livability (#67 in OR, #2,703 nationally) — a middle-class / working-renter tenant base. Strengths: commute A+, cost of living A+, housing A+; Watch: crime F, employment F.
- Klamath Falls City Schools (town): math 26% / reading 40% proficiency, ranked #36 of 58 in OR (top 62%) — families likely to look elsewhere, expect single-tenant / working-renter base with shorter leases; 62% free/reduced lunch — lower-income household profile, screen leases tightly.
- Zoned schools: Roosevelt Elementary School (math 54% / reading 34%, grade F, #143 of 412 statewide, top 38%, 316 students, 88% FRL); Ponderosa Middle School (math 27% / reading 41%, grade F, #71 of 128 statewide, top 56%, 565 students, 88% FRL); Klamath Union High School (math 15% / reading 64%, grade F, #69 of 143 statewide, top 54%, 645 students, 89% FRL) — zoned schools average 89% FRL vs 62% district-wide (27 pts higher); higher-poverty schools than district average — tighter screening recommended.
- Market conditions: Rents rising (+3.1%/yr); 493 active listings in the ZIP; 8 comparable units currently listed for rent nearby; rentals lingering (median 44d on market — plan ~5-8 weeks vacancy on turnover, expect pricing pressure); 100% of comp listings sitting > 30 days — soft ceiling on asking rent; 232 units permitted in Klamath County in 2024 (72 in 5+ unit buildings).
- This rent runs 35% of the median local income ($52k/yr) — at the standard rent-burdened threshold; future hikes will face affordability resistance.
Forward outlook
- Local home prices are declining (-3.0%/yr); year-one equity from $1k of loan paydown is wiped out by about $5k of value loss. Plan a longer hold.
- Klamath County population projected at -12% by 2050 — secular population decline; favor cash flow + early exit over multi-decade hold.
Negotiation context
- Only 2 days on market — expect competitive offers; lowballing is unlikely to land.
- Current owner paid $40k; list at $165k implies a 318% gain — meaningful room to come down on a strong offer.
Risks & watch-outs
- Watch-outs: built in 1920 — expect roof / HVAC / electrical / plumbing capex.
- Climate carrying-cost: major wildfire risk — expect insurance premiums to compound above CPI over the hold.
Questions for the listing agent
- Built in 1920 — when were the roof, HVAC, electrical panel, plumbing, and water heater last replaced?
- Is there a deadline driving the sale (1031 exchange, divorce, estate, relocation)? That informs how much negotiation room exists.
- Schools are D-rated, which usually means shorter tenancies and higher turnover. Who's the typical renter profile here, and what's been the actual vacancy rate?
- Crime grade is F in this area — have there been break-ins, vandalism, or insurance claims at this property in the last 3 years? What carrier currently insures it and at what premium?
- What's the average days-on-market for RENTAL listings here right now (not sales)? A rising rental-DOM trend means longer vacancies and softer asking-rent achievability than the comps imply.
- What's the recent tenant-quality profile in this submarket — average credit score on applications, eviction rate, late-payment / NSF rate, and stable-employment percentage? A property-management company in the area should have these aggregated.
- How much new for-sale + rental construction is in the pipeline within 1–3 miles? Heavy new supply typically softens prices + rents 12–24 months out; constrained supply supports both.
Investment metrics
- 1% rule
- 0.91% ✗
- Cap rate
- 7.05%
- Cash-on-cash
- 2.69%
- DSCR
- 1.12
- GRM
- 9.2
CMA / ARV
- ARV (on-the-fly)
- $269,696
- Comps found
- 12
Show comp detail 12 sales within ~0.75 mi
| Address | Dist | Beds/Ba | Sqft | Sold | Price | $/sf | Match |
|---|---|---|---|---|---|---|---|
| 1855 Portland St | 0.32mi | 3/2.0 | 1,370 (-0%) | 3mo | $307,900 | $225 | 78 |
| 1180 Crescent Ave | 0.13mi | 3/2.0 | 1,284 (-7%) | 3mo | $252,500 | $197 | 76 |
| 1859 Leroy St | 0.43mi | 3/2.0 | 1,368 (-1%) | 2mo | $312,000 | $228 | 73 |
| 1865 Melrose St | 0.33mi | 3/1.0 | 1,512 (+10%) | 1mo | $100,000 | $66 | 67 |
| 604 N 7th St | 0.43mi | 3/1.0 | 1,262 (-8%) | 0mo | $125,000 | $99 | 66 |
| 1885 Portland St | 0.35mi | 3/1.5 | 1,544 (+12%) | 1mo | $217,500 | $141 | 60 |
| 339 N 9th St | 0.31mi | 2/1.0 (-1) | 1,248 (-9%) | 6mo | $210,000 | $168 | 60 |
| 327 Lincoln St | 0.62mi | 3/2.0 | 1,338 (-3%) | 6mo | $175,000 | $131 | 57 |
| 734 N 10th St | 0.28mi | 2/1.0 (-1) | 1,224 (-11%) | 8mo | $96,200 | $79 | 57 |
| 1436 Siskiyou St | 0.62mi | 3/2.0 | 1,248 (-9%) | 6mo | $260,000 | $208 | 46 |
| 1530 California Ave | 0.71mi | 4/2.5 (+1) | 1,500 (+9%) | 5mo | $294,000 | $196 | 36 |
| 2025 Lawrence St | 0.73mi | 4/2.0 (+1) | 1,530 (+11%) | 9mo | $326,450 | $213 | 31 |
Match score weights: distance 35% · size 25% · config 20% · recency 20%. Top-matched comps best support the ARV.
Projected returns pro-forma
-3.0% appreciation · 3.12% rent growth · sell at horizon
- IRR
- -11.9%
- Equity multiple
- 0.57×
- Total profit
- $-19,982
- Equity at exit
- $24,602
- IRR
- -2.6%
- Equity multiple
- 0.82×
- Total profit
- $-8,237
- Equity at exit
- $14,266
Cash invested: $46,200 (down + closing). Projections, not guarantees.
Landlord ↔ Tenant lean methodology
- Overall (STATE)
- 28 Tenant-Leaning
- State Oregon
- 28 Tenant-Leaning · D+6
- County
- — inherits STATE
- City
- — inherits STATE
ZIP-level market 97601
- Home prices YoY
- -3.7%
- Rents YoY
- 3.1%
- Active inventory
- 493
- Price-to-rent
- 9.2×
Monthly cashflow live
- Estimated rent
- $1,495 high interval (Pro) →
- Mortgage (P&I)
- −$865
- Tax from tax record
- −$143 /mo · $1,720/yr
- Insurance
- −$69
- HOA
- −$0
- Vacancy / Maint / Mgmt
- −$314
- Net cashflow
- $103
Break-even live
UW: 25.0% down · 7.5% · 30yr · 1.5% tax · 5.0% vac · 8.0% maint · 8.0% mgmt
Financing live
Cash to close
- Down payment
- $41,250
- Closing costs
- $4,950
- Reserves months
- —
- Total cash needed
- —
Loan-product check · same deal, 3 products live
Conventional
25% down · 7.5% · 30yr
- Down + closing
- —
- Monthly P&I
- —
- Monthly cashflow
- —
- DSCR
- —
- Eligible?
- —
Personal DTI + credit; lowest rate.
DSCR
20% down · 8.5% · 30yr
- Down + closing
- —
- Monthly P&I
- —
- Monthly cashflow
- —
- DSCR
- —
- Eligible?
- —
No personal income docs; deal must DSCR.
Hard money
10% down · 12.0% · 12mo
- Down + closing
- —
- Monthly P&I
- —
- Monthly cashflow
- —
- DSCR
- —
- Eligible?
- —
Short-term bridge; refi at stabilization.
Rent comps 8 comps
| Address | Beds | Baths | Sqft | Rent | $/sqft | DOM | Units | Dist |
|---|---|---|---|---|---|---|---|---|
| 1670 Portland St Klamath Falls, OR | 2.0 | 2.0 | 1188 | $1,300 | $1.09 | 43d | 1 | 0.17mi |
| 729-731 N 11th St Klamath Falls, OR | 2.0 | 1.0 | 945 | $1,250 | $1.32 | 43d | 1 | 0.20mi |
| 1837 Lexington Ave Klamath Falls, OR | 3.0 | 2.5 | 1460 | $1,850 | $1.27 | 43d | 1 | 0.32mi |
| 527 E Lowell St Klamath Falls, OR | 4.0 | 2.0 | 1697 | $2,000 | $1.18 | 43d | 1 | 0.75mi |
| 69 Pine St Klamath Falls, OR | 3.0 | 2.0 | 1651 | $1,850 | $1.12 | 44d | 1 | 0.87mi |
| 233 Old Fort Rd Klamath Falls, OR | 2.0 | 1.0 | 1050 | $1,250 | $1.19 | 43d | 1 | 0.87mi |
| 2348 Vine Ave Klamath Falls, OR | 2.0 | 1.0 | 1582 | $1,400 | $0.88 | 43d | 1 | 1.30mi |
| 770 Hogue Dr Klamath Falls, OR | 3.0 | 2.5 | 1845 | $2,100 | $1.14 | 43d | 1 | 1.49mi |
Listing history 3 events
-
2026-06-19days on market $165,000 Active 2 DOM
-
2026-06-18remarks 699-char remark
-
2026-06-18$165,000 Active 1 DOM
ⓘ Source: listings_history table (triggers on properties + properties_extension) + one-shot
backfill from property_details.listing_events for pre-trigger history.
Tax reassessment forecast OR · Resets to sale price
- Current annual tax
- $1,720 · $143/mo
- Projected year-2 tax
- $1,720 · $143/mo
- Expected delta
- $0/yr ($0/mo · 0.0%)
ⓘ Screening estimate from a state-policy table — verify with the county assessor before closing.
Climate risk First Street
- Flood 1/10 Low FEMA zone X · 0% chance over 30 yrs
- Wildfire 6/10 Major
- Heat 3/10 Moderate 7 d/yr ≥91°F today · 16 d/yr by 30 yrs out
- Wind 1/10 Low
- Air quality 10/10 Extreme 29 unhealthy d/yr today · 31 by 30 yrs out
Nearby sold comps map
Loading sold comps map…
Walkable amenities ~0.75 mi
Loading nearby amenities…
Taxation est. · year 1
- Rental income
- $17,937
- − Mortgage interest
- −$9,243
- − Property taxes
- −$1,720
- − Insurance
- −$825
- − Repairs & maintenance
- −$1,435
- − Management
- −$1,435
- − Depreciation
- −$4,800
- Taxable loss
- −$1,521
- Est. tax savings @ 24.0%
- +$365
- After-tax cash flow
- $1,607/yr
For passive investors: Depreciation is non-cash, so a rental often shows a tax loss while cash-flowing — sheltering income. Rental losses are passive: they offset passive income freely, and up to $25,000/yr can offset ordinary (W-2) income if you actively participate and your MAGI is under $100k (phasing out to $0 by $150k); unused losses carry forward. On sale, claimed depreciation is recaptured at up to 25%, and gains may owe capital-gains tax (a 1031 exchange can defer both). Figures are a year-1 estimate at your 24.0% rate — not tax advice; consult a CPA.
Schools (NCES district)
- District
- Klamath Falls City Schools
- NCES district ID
- 4107080
- Math proficiency
- 26% ▼ -6.00%
- Reading proficiency
- 40% ▼ -3.00%
- Median HH income
- $34,329
- Composite
- 27.14/100
- National rank
- #7033
- State rank
- #36 of 58 in OR
Livability — Klamath Falls
- Score
- 78/100
- State rank
- #67
- US rank
- #2703
Category grades
Schools grade is shown separately in the Schools card above.
Census & demographics
- Census place
- Klamath Falls, OR
- County
- Klamath County · 56,186 people
- City population
- 56,186
- Metro
- Klamath Falls, OR
- Population (ZIP)
- 22,964
- Household income
- $51,780
- Rent vs Own
- Severe rent burden
- 1323.0
Population outlook (Klamath County) Hauer SSP2
- Today (2025)
- 63,870 people
- By 2030
- 62,279 · -2.5%
- By 2040
- 58,891 · -7.8%
- By 2050
- 56,207 · -12.0%
- By 2075
- 51,239 · -19.8%
- By 2100
- 46,526 · -27.2%
Race, ethnicity, and origin ACS 2023
- Neighborhood character
- Predominantly White (76%)
- Race & ethnicity
- White 76% Hispanic / Latino 12% Two or more races 10% Native American 3% Asian 2%
- Hispanic origin (detail)
- Mexican 9%
- Common ancestry
- Lithuanian 4% Slovak 3% Portuguese 2%
- Foreign-born
- 4% · Canada
- Languages at home
- 92% English-only · Spanish 6%
Political lean MEDSL · Klamath
- 2024 margin
- Solid R (+41.9) · D 27.9% · R 69.8% · Other 2.4%
- 2008→2024 swing
- -8.8pp toward R · 2008: -33.1pp · 2024: -41.9pp
- All cycles
- 2024: R+41.9 2020: R+40.6 2016: R+44.8 2012: R+38.2 2008: R+33.1
Not yet ingested
- Civics
- —
Market trends
- HPI YoY
- ▼ -14.37%
- Current HPI
- 372.5418
- Rent YoY
- ▲ 3.12%
- Metro
- Klamath Falls, OR
- State GDP YoY
- ▲ 2.05%
- F500 in state
- 2
Industry mix (Fortune 500 HQ in OR)
| Industry | F500 HQs | Revenue |
|---|---|---|
| Consumer Goods | 1 | $51B |
|
||
Price history
+317.7% since first listed2 events — show timeline
- 2026-06-17 Listed $165,000 MLSCO
- 1988-11-01 Sold (Public Records) $39,500 Public Records
Property tax history
+4.8%/yrLatest (2025): $1,720 · +2.4% YoY. Source: county tax records.
Cash-flow waterfall
monthlySold comps — $/sqft
last 12 mo · ≤1 miLoading sold comps…