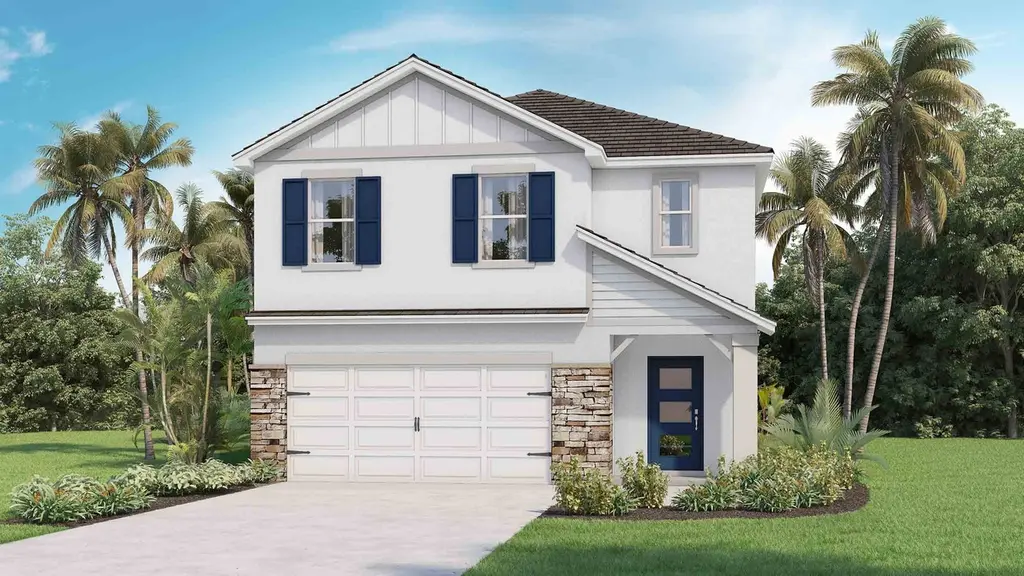
5283 Berry Bay Ave · Wimauma, FL
Flood risk No data
- FEMA flood zone
- —
- Chance of flooding over 30 yrs
- —
- Est. flood insurance / yr
- —
Fire risk No data
- Est. fire insurance / yr
- —
Heat risk No data
- Hot days now (above threshold)
- —
- Hot days in 30 yrs
- —
Wind risk No data
- Chance of severe wind over 30 yrs
- —
Air-quality risk No data
- Unhealthy air days now
- —
- Unhealthy air days in 30 yrs
- —
Risk factors via First Street. Map © Google.
Why this score? — see what drove the D grade
The composite is a weighted blend of 9 inputs, each scored 0–100. Each bar is that input's sub-score; the figure is the points it added to the 100-point composite (weight × sub-score).
- Cash flow +11.2/30.0
- ARV discount +7.5/15.0
- Schools +4.2/10.0
- Appreciation +3.8/10.0
- DSCR +3.3/10.0
- Livability +3.2/5.0
- 1% rule +2.6/10.0
- Condition / age +2.5/5.0
- Rent growth +1.9/5.0
$389,990
🖨 Deal sheet 📄 Offer letter ✓ Due diligence
Listing remarks MLS
The property is located at 5283 BERRY BAY AVE WIMAUMA FL 33598 priced at 393990, the square foot and stories are 2447, 2.The number of bath is 3, halfbath is 0 there are 5 bedrooms and 2 garages. For more details please, call or email.
Key facts
- Quartz countertops
- Smart home system
- 5,625 sq ft lot
Tags
Neighborhood map
What this means for you Summary
Snapshot
- This is a 5-bed/3.0-bath land listed at $390k.
Deal economics
- At list price, monthly cash flow is $-147 ($-2k/yr) — negative.
- To cash-flow at today's rent, offer at most $364k (6.7% below list).
- To meet the 1% rule (rent ≥ 1% of price), the offer needs to be $298k (23.6% below list).
- Recommended offer: $298k (23.6% below list) — sets the bar for 1% rule.
- Cap rate 5.8% vs local median 4.5% in Wimauma — meaningfully above typical; check what's discounted (condition, days-on-market, listing class) to confirm the premium yield is real.
Location & tenants
- Location reads 64/100 on livability (#699 in FL) — a middle-class / working-renter tenant base. Strengths: commute A, cost of living A-, crime B; Watch: schools F, amenities F, employment D-.
- Hillsborough (suburban): math 47% / reading 50% proficiency, ranked #41 of 73 in FL (top 56%) — families likely to look elsewhere, expect single-tenant / working-renter base with shorter leases.
- Market conditions: Rents soft (-2.5%/yr); 674 active listings in the ZIP; 5 comparable units currently listed for rent nearby; rentals at typical pace (median 24d on market — plan ~3-4 weeks tenant-placement turnaround); solid renter incomes; 9,053 units permitted in Hillsborough County in 2024 (4,555 in 5+ unit buildings).
- This rent runs 37% of the median local income ($98k/yr) — at the standard rent-burdened threshold; future hikes will face affordability resistance.
Forward outlook
- Local home prices are declining (-2.4%/yr); year-one equity from $3k of loan paydown is wiped out by about $9k of value loss. Plan a longer hold.
- Hillsborough County population projected at +37% by 2050 — long-run rental-demand tailwind backs the buy-and-hold thesis.
Negotiation context
- It's been on market 59 days — a 3% lower offer ($378k) is reasonable based on typical stale-listing flexibility.
- 2 sale attempts with the ask held roughly flat each time — persistent listings suggest the price (not the market) is what's stuck; bring a comps-based counter.
Questions for the listing agent
- What do current leases actually rent for vs. the listed asking? Can we see a recent rent roll and the last 12 months of T-12 income?
- It's been on market 59 days. Have you received any prior offers? Is the seller open to a 24% concession, seller financing, or rate buy-down credit?
- What does the HOA fee cover, when was the last increase, and are there any pending special assessments or reserve-fund shortfalls?
- Is there a deadline driving the sale (1031 exchange, divorce, estate, relocation)? That informs how much negotiation room exists.
- Schools are F-rated, which usually means shorter tenancies and higher turnover. Who's the typical renter profile here, and what's been the actual vacancy rate?
- The area grade is low — what's the realistic commute time and amenity access for the typical tenant pool here? Any planned neighborhood developments (good or bad) we should know about?
- What's the average days-on-market for RENTAL listings here right now (not sales)? A rising rental-DOM trend means longer vacancies and softer asking-rent achievability than the comps imply.
- What's the recent tenant-quality profile in this submarket — average credit score on applications, eviction rate, late-payment / NSF rate, and stable-employment percentage? A property-management company in the area should have these aggregated.
- How much new for-sale + rental construction is in the pipeline within 1–3 miles? Heavy new supply typically softens prices + rents 12–24 months out; constrained supply supports both.
Investment metrics
- 1% rule
- 0.76% ✗
- Cap rate
- 5.84%
- Cash-on-cash
- -1.61%
- DSCR
- 0.93
- GRM
- 10.9
CMA / ARV
No comps found within radius.
Projected returns pro-forma
-2.35% appreciation · 0.0% rent growth · sell at horizon
- IRR
- -17.6%
- Equity multiple
- 0.35×
- Total profit
- $-70,584
- Equity at exit
- $69,603
- IRR
- -15.1%
- Equity multiple
- 0.10×
- Total profit
- $-98,112
- Equity at exit
- $53,727
Cash invested: $109,197 (down + closing). Projections, not guarantees.
Landlord ↔ Tenant lean methodology
- Overall (STATE)
- 87 Strongly Landlord-Friendly
- State Florida
- 87 Strongly Landlord-Friendly · R+3
- County
- — inherits STATE
- City
- — inherits STATE
ZIP-level market 33598
- Home prices YoY
- -0.9%
- Rents YoY
- -2.5%
- Active inventory
- 674
- Price-to-rent
- 10.9×
Monthly cashflow live
- Estimated rent
- $2,979 high interval (Pro) →
- Mortgage (P&I)
- −$2,045
- Tax from tax record
- −$284 /mo · $3,413/yr
- Insurance
- −$162
- HOA
- −$8
- Vacancy / Maint / Mgmt
- −$626
- Net cashflow
- $-147
Break-even live
UW: 25.0% down · 7.5% · 30yr · 1.5% tax · 5.0% vac · 8.0% maint · 8.0% mgmt
Financing live
Cash to close
- Down payment
- $97,498
- Closing costs
- $11,700
- Reserves months
- —
- Total cash needed
- —
Loan-product check · same deal, 3 products live
Conventional
25% down · 7.5% · 30yr
- Down + closing
- —
- Monthly P&I
- —
- Monthly cashflow
- —
- DSCR
- —
- Eligible?
- —
Personal DTI + credit; lowest rate.
DSCR
20% down · 8.5% · 30yr
- Down + closing
- —
- Monthly P&I
- —
- Monthly cashflow
- —
- DSCR
- —
- Eligible?
- —
No personal income docs; deal must DSCR.
Hard money
10% down · 12.0% · 12mo
- Down + closing
- —
- Monthly P&I
- —
- Monthly cashflow
- —
- DSCR
- —
- Eligible?
- —
Short-term bridge; refi at stabilization.
Rent comps 5 comps
| Address | Beds | Baths | Sqft | Rent | $/sqft | DOM | Units | Dist |
|---|---|---|---|---|---|---|---|---|
| 3160 Oyster Cove St Wimauma, FL | 4.0 | 2.5 | 1925 | $2,350 | $1.22 | 23d | 1 | 0.28mi |
| 5517 Blue Azure Dr Wimauma, FL | 4.0 | 2.0 | 1841 | $2,450 | $1.33 | 24d | 1 | 0.37mi |
| 5517 Blue Azure Dr Wimauma, FL | 4.0 | 2.0 | 1841 | $2,450 | $1.33 | 14d | 1 | 0.37mi |
| 5375 Blue Horizon Way Wimauma, FL | 6.0 | 3.0 | 3326 | $3,000 | $0.90 | 1d | 1 | 0.39mi |
| 2881 Silver Scallop Loop Wimauma, FL | 6.0 | 3.0 | 3130 | $2,900 | $0.93 | 24d | 1 | 0.59mi |
HOA detail
- Monthly dues
- $8 · $96/yr
Listing history 14 events
-
2026-06-15status $389,990 Pending 59 DOM
-
2026-06-15days on market $389,990 Active 59 DOM
-
2026-06-13days on market $389,990 Active 57 DOM
-
2026-06-13days on market $389,990 Active 56 DOM
-
2026-06-09days on market $389,990 Active 53 DOM
-
2026-06-08days on market $389,990 Active 52 DOM
-
2026-06-07days on market $389,990 Active 51 DOM
-
2026-06-04days on market $389,990 Active 48 DOM
-
2026-06-03days on market $389,990 Active 47 DOM
-
2026-06-02days on market $389,990 Active 46 DOM
-
2026-06-01days on market $389,990 Active 45 DOM
-
2026-05-31days on market $389,990 Active 44 DOM
-
2026-04-24$393,990 Active 235-char remark
Show marketing remark (235 chars)
The property is located at 5283 BERRY BAY AVE WIMAUMA FL 33598 priced at 393990, the square foot and stories are 2447, 2.The number of bath is 3, halfbath is 0 there are 5 bedrooms and 2 garages. For more details please, call or email.
-
2026-04-17$393,990 Active 1152-char remark
Show marketing remark (1152 chars)
Under Construction. The builder is offering buyers up to $25,000 towards closing costs with the use of a preferred lender and title company. Located off US-301 and showcasing new homes in Wimauma, Berry Bay is one of the newest communities in the area. Just minutes from I-75, providing quick access to St. Pete, Downtown Tampa, Sarasota, as well as the bay. Berry Bay will feature a new homes lineup of our Express and Preferred series throughout the community. Berry Bay features include extended luxury vinyl in the main living and dining area, a stainless-steel appliance package, quartz countertops in the kitchen, all concrete block construction on the 1st and 2nd stories, and Smart Home system. Other inventory options may be available in this community. Please reach out for list of availability. Pictures, photographs, colors, features, and sizes are for illustration purposes only and will vary from homes as built. Home and community information, including pricing, included features, terms, availability, and amenities, are subject to change and prior sale at any time without notice or obligation. Materials may vary based on availability
ⓘ Source: listings_history table (triggers on properties + properties_extension) + one-shot
backfill from property_details.listing_events for pre-trigger history.
Tax reassessment forecast FL · Resets to sale price
- Current annual tax
- $3,413 · $284/mo
- Projected year-2 tax
- $3,413 · $284/mo
- Expected delta
- $0/yr ($0/mo · -0.0%)
ⓘ Screening estimate from a state-policy table — verify with the county assessor before closing.
Nearby sold comps map
Loading sold comps map…
Walkable amenities ~0.75 mi
Loading nearby amenities…
Taxation est. · year 1
- Rental income
- $35,745
- − Mortgage interest
- −$21,846
- − Property taxes
- −$3,413
- − Insurance
- −$1,950
- − Repairs & maintenance
- −$2,860
- − Management
- −$2,860
- − HOA
- −$96
- − Depreciation
- −$11,345
- Taxable loss
- −$8,623
- Est. tax savings @ 24.0%
- +$2,070
- After-tax cash flow
- $308/yr
For passive investors: Depreciation is non-cash, so a rental often shows a tax loss while cash-flowing — sheltering income. Rental losses are passive: they offset passive income freely, and up to $25,000/yr can offset ordinary (W-2) income if you actively participate and your MAGI is under $100k (phasing out to $0 by $150k); unused losses carry forward. On sale, claimed depreciation is recaptured at up to 25%, and gains may owe capital-gains tax (a 1031 exchange can defer both). Figures are a year-1 estimate at your 24.0% rate — not tax advice; consult a CPA.
Schools (NCES district)
- District
- Hillsborough
- NCES district ID
- 1200870
- Math proficiency
- 47% ▼ -8.00%
- Reading proficiency
- 50% ▼ -4.00%
- Median HH income
- $50,622
- Composite
- 41.6/100
- National rank
- #3435
- State rank
- #41 of 73 in FL
Livability — Wimauma
- Score
- 64/100
- State rank
- #699
- US rank
- #14659
Category grades
Schools grade is shown separately in the Schools card above.
Census & demographics
- Census place
- Wimauma, FL
- County
- Hillsborough County · 1,540,968 people
- City population
- 32,820
- Metro
- Tampa-St. Petersburg-Clearwater, FL
- Population (ZIP)
- 32,820
- Household income
- $97,520
- Rent vs Own
- Severe rent burden
- 149.0
Population outlook (Hillsborough County) Hauer SSP2
- Today (2025)
- 1,607,022 people
- By 2030
- 1,733,968 · +7.9%
- By 2040
- 1,979,565 · +23.2%
- By 2050
- 2,203,427 · +37.1%
- By 2075
- 2,667,893 · +66.0%
- By 2100
- 2,891,558 · +79.9%
Race, ethnicity, and origin ACS 2023
- Neighborhood character
- Diverse neighborhood (Simpson 0.67)
- Race & ethnicity
- White 40% Hispanic / Latino 39% Black 14% Two or more races 11% Asian 2%
- Hispanic origin (detail)
- Mexican 26% Puerto Rican 3% Cuban 1%
- Common ancestry
- Romanian 2% Scotch-Irish 2% Lithuanian 1%
- Foreign-born
- 23% · Canada, Jamaica, Guatemala
- Languages at home
- 62% English-only · Spanish 35% Other Indo-European 1% Arabic 1%
Political lean MEDSL · Hillsborough
- 2024 margin
- Toss-up / Even · D 47.8% · R 50.9% · Other 1.3%
- 2008→2024 swing
- -10.2pp toward R · 2008: 7.1pp · 2024: -3.1pp
- All cycles
- 2024: R+3.1 2020: D+6.9 2016: D+6.8 2012: D+6.7 2008: D+7.1
Not yet ingested
- Civics
- —
Market trends
- HPI YoY
- ▼ -2.35%
- Current HPI
- 271.8552
- Rent YoY
- ▼ -2.50%
- Metro
- Tampa-St. Petersburg-Clearwater, FL
- State GDP YoY
- ▲ 3.28%
- F500 in state
- 36
Industry mix (Fortune 500 HQ in FL)
| Industry | F500 HQs | Revenue |
|---|---|---|
| Industrial Technology | 2 | $29B |
|
||
| Insurance | 2 | $17B |
|
||
| Retail | 1 | $60B |
|
||
| Technology Distribution | 1 | $58B |
|
||
| Homebuilding | 1 | $35B |
|
||
| Technology Manufacturing | 1 | $35B |
|
||
Price history
+0.0% since first listed2 events — show timeline
- 2026-04-24 Listed $393,990 Zillow
- 2026-04-17 Listed $393,990 Stellar MLS as Distributed by MLS Grid
Cash-flow waterfall
monthlySold comps — $/sqft
last 12 mo · ≤1 miLoading sold comps…