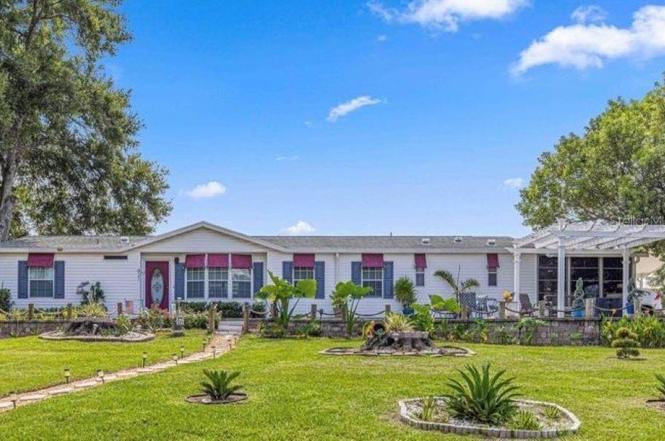
621 SW 79th Ct · Ocala, FL
Flood risk 1/10 · Minimal
- FEMA flood zone
- X (unshaded)
- Chance of flooding over 30 yrs
- 0.0%
- Est. flood insurance / yr
- $507 – $1,088
Fire risk 5/10 · Moderate
- Est. fire insurance / yr
- $947 – $1,759
Heat risk 8/10 · Major
- Hot days now (above 107°F)
- 7 days/yr
- Hot days in 30 yrs
- 22 days/yr
Wind risk 9/10 · Severe
- Chance of severe wind over 30 yrs
- 99.0%
Air-quality risk 3/10 · Minor
- Unhealthy air days now
- 3 days/yr
- Unhealthy air days in 30 yrs
- 3 days/yr
Risk factors via First Street. Map © Google.
Why this score? — see what drove the D+ grade
The composite is a weighted blend of 9 inputs, each scored 0–100. Each bar is that input's sub-score; the figure is the points it added to the 100-point composite (weight × sub-score).
- Cash flow +17.3/30.0
- ARV discount +7.5/15.0
- 1% rule +5.4/10.0
- DSCR +5.4/10.0
- Schools +3.6/10.0
- Livability +3.5/5.0
- Rent growth +2.5/5.0
- Condition / age +2.5/5.0
- Appreciation +0.0/10.0
$189,900
🖨 Deal sheet (PDF) 📄 Offer letter ✓ Due diligence
Listing remarks
BACK ON THE MARKET due to no fault of the property or the sellers. Welcome to this lovely 3-bedroom, 2.5 bath manufactured home on a large corner lot in the 55+ community of The Falls of Ocala, located a short drive from downtown Ocala, I-75, and the famed World Equestrian Center. You own the land - no lot lease - and a HOME WARRANTY is included to provide peace of mind! Relax outside under the pergola while enjoying the sounds of the tranquil waterfall, with a propane fire pit to warm chilly evenings. Step inside to find vaulted ceilings, providing a spacious, open feeling to the combined living and dining areas. The neutral colors and luxury vinyl plank flooring throughout the home comple
Key facts
- Large corner lot
- Vaulted ceilings
- Skylight
Tags
Property features AI
Finance
- Other: Partially furnished; Directions: From I-75 (Exit 352) head west on Hwy 40; in 4 miles turn left onto SW 80th Ave; in 0.4 miles turn left into The Falls of Ocala (SW 5th Place); in 250 ft turn right onto SW 79th Ct.
- Financial info: Total monthly fees $200 (total annual fees $2,400); Lease restrictions apply
- HOA & community: Has HOA (monthly fee $200); Association amenities: clubhouse, fitness center, pool, sauna, shuffleboard court; Association fee includes pool, recreational facilities, and water; Association approval required; Deed restrictions; Association recreation owned; Senior community; Pets allowed with number limit
Exterior
- Parking: Driveway; Parking pad; 1-car carport
- Security: Security lights; Smoke detectors
- Utilities: Public water; Public sewer; Cable connected; Electricity connected; Sewer connected; Underground utilities; Water available
- Home design: Single-family residence (attached property); One story; Faces west; PUD zoning; Located on a corner, oversized, paved lot (approx. 0.31 acres)
- Construction: Vinyl siding and frame construction; Shingle roof; Crawlspace and slab foundation; Built with approx. 2084 total building area
- Exterior features: Rain gutters; Sidewalk; Storage; Workshop; Other exterior features
Interior
- Kitchen: Dishwasher; Disposal; Ice maker; Microwave; Range; Refrigerator; Eat-in kitchen
- Bedrooms: 3 bedrooms
- Flooring: Laminate flooring; Vinyl flooring
- Bathrooms: 2 full baths; 1 half bath
- Heating & cooling: Central heating (electric); Central air
- Interior features: Ceiling fans; Eat-in kitchen; Living room and dining room combo; Split bedroom floorplan; Thermostat; Vaulted ceilings; Walk-in closets; Window treatments; Skylights; Blinds; Drapes
- Laundry & utility: Inside laundry room; Washer; Dryer; Electric water heater
Neighborhood map
What this means for you Summary
Snapshot
- This is a 3-bed/2.5-bath manufactured listed at $190k.
Deal economics
- At list price, monthly cash flow is $140 ($2k/yr) — positive.
- The deal already cash-flows at list — no discount required.
- Meets the 1% rule at list price ($2k rent vs $190k).
- Recommended offer: $167k (12.0% below list) — sets the bar for market timing.
- Cap rate 7.2% vs local median 4.2% in Ocala — top-decile yield for the area; either an underpriced asset or a hidden risk that comps aren't pricing in. Stress-test before assuming the spread holds.
Location & tenants
- Location reads 69/100 on livability (#476 in FL) — a middle-class / working-renter tenant base. Strengths: cost of living A+, housing A+, health & safety A+; Watch: crime F, amenities F, commute F.
- Marion (rural): math 42% / reading 43% proficiency, ranked #61 of 73 in FL (top 84%) — families likely to look elsewhere, expect single-tenant / working-renter base with shorter leases; 61% free/reduced lunch — lower-income household profile, screen leases tightly.
- Zoned schools: College Park Elementary School (math 46% / reading 37%, grade F, #1,437 of 2,144 statewide, top 68%, 840 students, 78% FRL); Liberty Middle School (math 40% / reading 41%, grade F, #360 of 571 statewide, top 64%, 1,365 students, 54% FRL); West Port High School (math 34% / reading 52%, grade F, #255 of 667 statewide, top 39%, 2,906 students, 52% FRL) — zoned schools at 61% FRL track the district average.
- Market conditions: Rents flat; 299 active listings in the ZIP; 2 comparable units currently listed for rent nearby; 7,071 units permitted in Marion County in 2024 (534 in 5+ unit buildings).
- This rent runs 36% of the median local income ($65k/yr) — at the standard rent-burdened threshold; future hikes will face affordability resistance.
Forward outlook
- Local home prices are declining (-3.0%/yr); year-one equity from $1k of loan paydown is wiped out by about $6k of value loss. Plan a longer hold.
- Marion County population projected at +13% by 2050 — modest demand growth; plan on rents tracking national, not racing it.
Negotiation context
- It's been on market 304 days — a 12% lower offer ($167k) is reasonable based on typical stale-listing flexibility.
- 8 sale attempts since 13y ago; this cycle's ask has dropped $35k (16%) from the opening price — seller is motivated, your offer sets the floor, not the list.
- Current owner paid $158k; 20% above their basis — modest negotiation headroom, anchor on the comps not their cost.
Risks & watch-outs
- Climate carrying-cost: severe wind risk, 99% chance of damaging wind over 30y; moderate wildfire risk; extreme-heat days projected 7→22/yr by 2055 (HVAC capex compounding) — expect insurance premiums to compound above CPI over the hold.
Questions for the listing agent
- It's been on market 304 days. Have you received any prior offers? Is the seller open to a 12% concession, seller financing, or rate buy-down credit?
- What does the HOA fee cover, when was the last increase, and are there any pending special assessments or reserve-fund shortfalls?
- Why hasn't it sold? Are there any deal-killer items the seller is aware of (foundation, flood, title, zoning, code violations)?
- Is there a deadline driving the sale (1031 exchange, divorce, estate, relocation)? That informs how much negotiation room exists.
- Crime grade is F in this area — have there been break-ins, vandalism, or insurance claims at this property in the last 3 years? What carrier currently insures it and at what premium?
- The area grade is low — what's the realistic commute time and amenity access for the typical tenant pool here? Any planned neighborhood developments (good or bad) we should know about?
- What's the average days-on-market for RENTAL listings here right now (not sales)? A rising rental-DOM trend means longer vacancies and softer asking-rent achievability than the comps imply.
- What's the recent tenant-quality profile in this submarket — average credit score on applications, eviction rate, late-payment / NSF rate, and stable-employment percentage? A property-management company in the area should have these aggregated.
- How much new for-sale + rental construction is in the pipeline within 1–3 miles? Heavy new supply typically softens prices + rents 12–24 months out; constrained supply supports both.
Investment metrics
- 1% rule
- 1.04% ✓
- Cap rate
- 7.18%
- Cash-on-cash
- 3.15%
- DSCR
- 1.14
- GRM
- 8.0
CMA / ARV
No comps found within radius.
Projected returns pro-forma
-3.0% appreciation · 0.12% rent growth · sell at horizon
- IRR
- -14.8%
- Equity multiple
- 0.49×
- Total profit
- $-27,332
- Equity at exit
- $28,315
- IRR
- -12.4%
- Equity multiple
- 0.37×
- Total profit
- $-33,472
- Equity at exit
- $16,419
Cash invested: $53,172 (down + closing). Projections, not guarantees.
Landlord ↔ Tenant lean methodology
- Overall (STATE)
- 87 Strongly Landlord-Friendly
- State Florida
- 87 Strongly Landlord-Friendly · R+3
- County
- — inherits STATE
- City
- — inherits STATE
ZIP-level market 34474
- Home prices YoY
- -28.4%
- Rents YoY
- 0.1%
- Active inventory
- 299
- Price-to-rent
- 8.0×
Monthly cashflow live
- Estimated rent
- $1,972 medium interval (Pro) →
- Mortgage (P&I)
- −$996
- Tax from tax record
- −$143 /mo · $1,716/yr
- Insurance
- −$79
- HOA
- −$200
- Lot rent leased land?
- −$0
- Vacancy / Maint / Mgmt
- −$414
- Net cashflow
- $140
Break-even live
Sensitivity live
| Price | -10% $247 | -5% $193 | +0% $140 | +5% $86 | +10% $32 |
|---|---|---|---|---|---|
| Rent | -10% $-16 | -5% $62 | +0% $140 | +5% $218 | +10% $295 |
| Rate | -1.0pp $235 | -0.5pp $188 | base $140 | +0.5pp $91 | +1.0pp $40 |
UW: 25.0% down · 7.5% · 30yr · 1.5% tax · 5.0% vac · 8.0% maint · 8.0% mgmt
Financing live
Cash to close
- Down payment
- $47,475
- Closing costs
- $5,697
- Reserves months
- —
- Total cash needed
- —
Loan-product check · same deal, 3 products live
Conventional
25% down · 7.5% · 30yr
- Down + closing
- —
- Monthly P&I
- —
- Monthly cashflow
- —
- DSCR
- —
- Eligible?
- —
Personal DTI + credit; lowest rate.
DSCR
20% down · 8.5% · 30yr
- Down + closing
- —
- Monthly P&I
- —
- Monthly cashflow
- —
- DSCR
- —
- Eligible?
- —
No personal income docs; deal must DSCR.
Hard money
10% down · 12.0% · 12mo
- Down + closing
- —
- Monthly P&I
- —
- Monthly cashflow
- —
- DSCR
- —
- Eligible?
- —
Short-term bridge; refi at stabilization.
Rent comps 2 comps
| Address | Beds | Baths | Sqft | Rent | $/sqft | DOM | Units | Dist |
|---|---|---|---|---|---|---|---|---|
| 7180 SW 19th Pl Ocala, FL | 4.0 | 2.0 | 1940 | $1,900 | $0.98 | 16d | 1 | 1.16mi |
| 7710 NW 14th St Ocala, FL | 3.0 | 3.0 | 1521 | $4,500 | $2.96 | 23d | 1 | 1.31mi |
HOA detail
- Monthly dues
- $200 · $2,400/yr
- Likely covers
- water
Listing history 41 events
-
2026-06-13statusdays on market $189,900 Pending 304 DOM
-
2026-06-10days on market $189,900 Active 302 DOM
-
2026-06-09days on market $189,900 Active 301 DOM
-
2026-06-08days on market $189,900 Active 300 DOM
-
2026-06-07days on market $189,900 Active 299 DOM
-
2026-06-03days on market $189,900 Active 295 DOM
-
2026-06-02days on market $189,900 Active 294 DOM
-
2026-05-31days on market $189,900 Active 292 DOM
-
2026-05-30days on market $189,900 Active 291 DOM
-
2026-05-15status Pending
-
2026-03-30price $189,900
-
2026-03-13price $194,500
-
2026-03-11status Active
-
2026-02-18status Pending
-
2025-11-14price $199,900
-
2025-08-22price $214,900
-
2025-07-22price $219,900
-
2025-07-11$224,900 Active
-
2025-07-10historical
-
2025-06-04price $224,900
-
2025-02-21price $229,900
-
2025-01-30price $234,900
-
2025-01-12$239,900 Active
-
2025-01-08historical
-
2024-12-17price $244,900
-
2024-09-30price $245,000
-
2024-09-16price $249,000
-
2024-08-29price $254,000
-
2024-07-31$259,000 Active
-
2021-12-29soldstatus $158,000 Closed
-
2021-11-17status Pending
-
2021-11-12$189,900 Active
-
2017-01-30soldstatus $31,500
-
2017-01-25historical
-
2017-01-23$31,500
-
2016-10-03$75,000
-
2014-05-16historical
-
2013-05-16$49,900
-
2004-12-27soldstatus $2,750,000
-
2003-12-17soldstatus $600,000
-
1988-07-01soldstatus $47,600
ⓘ Source: listings_history table (triggers on properties + properties_extension) + one-shot
backfill from property_details.listing_events for pre-trigger history.
Tax reassessment forecast FL · Resets to sale price
- Current annual tax
- $1,716 · $143/mo
- Projected year-2 tax
- $1,716 · $143/mo
- Expected delta
- $0/yr ($0/mo · 0.0%)
ⓘ Screening estimate from a state-policy table — verify with the county assessor before closing.
Climate risk First Street
- Flood 1/10 Low FEMA zone X (unshaded) · 0% chance over 30 yrs
- Wildfire 5/10 Major
- Heat 8/10 Severe 7 d/yr ≥107°F today · 22 d/yr by 30 yrs out
- Wind 9/10 Extreme 99% chance of damaging wind over 30 yrs
- Air quality 3/10 Moderate 3 unhealthy d/yr today · 3 by 30 yrs out
Nearby sold comps map
Loading sold comps map…
Walkable amenities ~0.75 mi
Loading nearby amenities…
Taxation est. · year 1
- Rental income
- $23,661
- − Mortgage interest
- −$10,637
- − Property taxes
- −$1,716
- − Insurance
- −$950
- − Repairs & maintenance
- −$1,893
- − Management
- −$1,893
- − HOA
- −$2,400
- − Depreciation
- −$5,524
- Taxable loss
- −$1,352
- Est. tax savings @ 24.0%
- +$324
- After-tax cash flow
- $2,001/yr
For passive investors: Depreciation is non-cash, so a rental often shows a tax loss while cash-flowing — sheltering income. Rental losses are passive: they offset passive income freely, and up to $25,000/yr can offset ordinary (W-2) income if you actively participate and your MAGI is under $100k (phasing out to $0 by $150k); unused losses carry forward. On sale, claimed depreciation is recaptured at up to 25%, and gains may owe capital-gains tax (a 1031 exchange can defer both). Figures are a year-1 estimate at your 24.0% rate — not tax advice; consult a CPA.
Schools (NCES district)
- District
- Marion
- NCES district ID
- 1201260
- Math proficiency
- 42% ▼ -7.00%
- Reading proficiency
- 43% ▼ -4.00%
- Median HH income
- $40,015
- Composite
- 35.61/100
- National rank
- #4890
- State rank
- #61 of 73 in FL
Livability — Ocala
- Score
- 69/100
- State rank
- #476
- US rank
- #8461
Category grades
Schools grade is shown separately in the Schools card above.
Census & demographics
- County
- Marion County · 315,796 people
- City population
- 263,375
- Metro
- Ocala, FL
- Population (ZIP)
- 20,258
- Household income
- $65,291
- Rent vs Own
- Severe rent burden
- 1062.0
Population outlook (Marion County) Hauer SSP2
- Today (2025)
- 365,905 people
- By 2030
- 376,768 · +3.0%
- By 2040
- 396,555 · +8.4%
- By 2050
- 412,723 · +12.8%
- By 2075
- 446,090 · +21.9%
- By 2100
- 436,193 · +19.2%
Race, ethnicity, and origin ACS 2023
- Neighborhood character
- Diverse neighborhood (Simpson 0.64)
- Race & ethnicity
- White 52% Hispanic / Latino 25% Black 13% Two or more races 8% Asian 8%
- Hispanic origin (detail)
- Mexican 2% Puerto Rican 10%
- Common ancestry
- Lithuanian 2% Romanian 2% Slovak 1%
- Foreign-born
- 21% · Canada, Jamaica, Vietnam
- Languages at home
- 71% English-only · Spanish 22% Other Indo-European 4% Vietnamese 1%
Political lean MEDSL · Marion
- 2024 margin
- Solid R (+31.6) · D 33.8% · R 65.5%
- 2008→2024 swing
- -20.0pp toward R · 2008: -11.6pp · 2024: -31.6pp
- All cycles
- 2024: R+31.6 2020: R+25.9 2016: R+26.2 2012: R+16.2 2008: R+11.6
Not yet ingested
- Civics
- —
Market trends
- HPI YoY
- ▼ -78.16%
- Current HPI
- 196.5607
- Rent YoY
- ▲ 0.12%
- Metro
- Ocala, FL
- State GDP YoY
- ▲ 3.28%
- F500 in state
- 36
Industry mix (Fortune 500 HQ in FL)
| Industry | F500 HQs | Revenue |
|---|---|---|
| Industrial Technology | 2 | $29B |
|
||
| Insurance | 2 | $17B |
|
||
| Retail | 1 | $60B |
|
||
| Technology Distribution | 1 | $58B |
|
||
| Homebuilding | 1 | $35B |
|
||
| Technology Manufacturing | 1 | $35B |
|
||
Price history
+298.9% since first listed32 events — show timeline
- 2026-05-15 Pending — Stellar MLS as Distributed by MLS Grid
- 2026-03-30 Price Changed $189,900 Stellar MLS as Distributed by MLS Grid
- 2026-03-13 Price Changed $194,500 Stellar MLS as Distributed by MLS Grid
- 2026-03-11 Relisted — Stellar MLS as Distributed by MLS Grid
- 2026-02-18 Pending — Stellar MLS as Distributed by MLS Grid
- 2025-11-14 Price Changed $199,900 Stellar MLS as Distributed by MLS Grid
- 2025-08-22 Price Changed $214,900 Stellar MLS as Distributed by MLS Grid
- 2025-07-22 Price Changed $219,900 Stellar MLS as Distributed by MLS Grid
- 2025-07-11 Listed $224,900 Stellar MLS as Distributed by MLS Grid
- 2025-07-10 Listing Removed — Stellar MLS as Distributed by MLS Grid
- 2025-06-04 Price Changed $224,900 Stellar MLS as Distributed by MLS Grid
- 2025-02-21 Price Changed $229,900 Stellar MLS as Distributed by MLS Grid
- 2025-01-30 Price Changed $234,900 Stellar MLS as Distributed by MLS Grid
- 2025-01-12 Listed $239,900 Stellar MLS as Distributed by MLS Grid
- 2025-01-08 Listing Removed — Stellar MLS as Distributed by MLS Grid
- 2024-12-17 Price Changed $244,900 Stellar MLS as Distributed by MLS Grid
- 2024-09-30 Price Changed $245,000 Stellar MLS as Distributed by MLS Grid
- 2024-09-16 Price Changed $249,000 Stellar MLS as Distributed by MLS Grid
- 2024-08-29 Price Changed $254,000 Stellar MLS as Distributed by MLS Grid
- 2024-07-31 Listed $259,000 Stellar MLS as Distributed by MLS Grid
- 2021-12-29 Sold (MLS) $158,000 Stellar MLS as Distributed by MLS Grid
- 2021-11-17 Pending — Stellar MLS as Distributed by MLS Grid
- 2021-11-12 Listed $189,900 Stellar MLS as Distributed by MLS Grid
- 2017-01-30 Sold (MLS) $31,500 Stellar MLS as Distributed by MLS Grid
- 2017-01-25 Listing Removed — Stellar MLS as Distributed by MLS Grid
- 2017-01-23 Listed $31,500 Stellar MLS as Distributed by MLS Grid
- 2016-10-03 Listed $75,000 Stellar MLS as Distributed by MLS Grid
- 2014-05-16 Listing Removed — Stellar MLS as Distributed by MLS Grid
- 2013-05-16 Listed $49,900 Stellar MLS as Distributed by MLS Grid
- 2004-12-27 Sold (Public Records) $2,750,000 Public Records
- 2003-12-17 Sold (Public Records) $600,000 Public Records
- 1988-07-01 Sold (Public Records) $47,600 Public Records
Property tax history
+22.1%/yrLatest (2025): $1,716 · +16.1% YoY. Source: county tax records.
Cash-flow waterfall
monthlySold comps — $/sqft
last 12 mo · ≤1 miLoading sold comps…