 Duplex
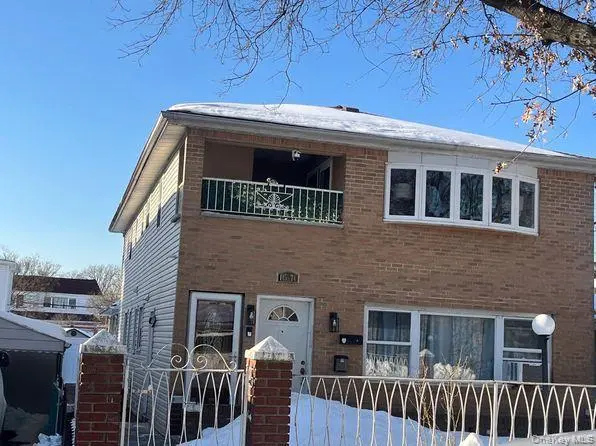
14574 222nd St · New York, NY
Flood risk 6/10 · Moderate
- FEMA flood zone
- X (unshaded)
- Chance of flooding over 30 yrs
- 0.73%
- Est. flood insurance / yr
- $507 – $1,088
Fire risk 1/10 · Minimal
- Est. fire insurance / yr
- $691 – $1,283
Heat risk 7/10 · Major
- Hot days now (above 97°F)
- 7 days/yr
- Hot days in 30 yrs
- 16 days/yr
Wind risk 6/10 · Moderate
- Chance of severe wind over 30 yrs
- 69.0%
Air-quality risk 4/10 · Minor
- Unhealthy air days now
- 6 days/yr
- Unhealthy air days in 30 yrs
- 6 days/yr
Risk factors via First Street. Map © Google.
Why this score? — see what drove the B- grade
The composite is a weighted blend of 9 inputs, each scored 0–100. Each bar is that input's sub-score; the figure is the points it added to the 100-point composite (weight × sub-score).
- Cash flow +24.0/30.0
- ARV discount +15.0/15.0
- DSCR +7.7/10.0
- 1% rule +5.9/10.0
- Schools +5.0/10.0
- Livability +3.8/5.0
- Rent growth +2.5/5.0
- Condition / age +2.5/5.0
- Appreciation +0.0/10.0
$650,000
🖨 Deal sheet (PDF) 📄 Offer letter ✓ Due diligence
Multi-family units
County records classify this as Multi-Family (2-4 Unit). Listing-text estimate: 2 units. confirmed
Listing remarks
Come and take a look at this property in Springfield Gardens. Fitted with two units, both possessing 3 bedrooms and 2 bathrooms each. The property will be delivered in "as-is" condition and occupied.
Key facts
- 3,800 sq ft lot
- Built 1950
- Listed 4 days
Neighborhood map
What this means for you Summary
Snapshot
- This is a 2 × 3-bed/2.0-bath units multifamily listed at $650k.
Deal economics
- At list price, monthly cash flow is $1k ($15k/yr) — positive. Per door: $636/mo.
- The deal already cash-flows at list — no discount required.
- Meets the 1% rule at list price ($7k rent vs $650k).
- Cap rate 8.6% vs local median 2.6% in New York — top-decile yield for the area; either an underpriced asset or a hidden risk that comps aren't pricing in. Stress-test before assuming the spread holds.
Location & tenants
- Location reads 75/100 on livability (#268 in NY, #4,188 nationally) — a middle-class / working-renter tenant base. Strengths: amenities A+, commute A+, health & safety A; Watch: crime F, cost of living F.
- Zoned schools: Elm Tree Elementary School (math 27% / reading 52%, grade F, #1,444 of 2,108 statewide, top 71%, 806 students, 94% FRL); Is 227 Louis Armstrong (math 52% / reading 69%, grade B+, #153 of 729 statewide, top 21%, 1,528 students, 68% FRL); Midwood High School (math 94% / reading 96%, grade A+, #83 of 1,100 statewide, top 8%, 4,062 students, 73% FRL).
- Market conditions: 197 active listings in the ZIP; 5,302 units permitted in Queens County in 2024 (4,918 in 5+ unit buildings).
Forward outlook
- Local home prices are declining (-3.0%/yr); year-one equity from $4k of loan paydown is wiped out by about $20k of value loss. Plan a longer hold.
- Queens County population projected at +16% by 2050 — long-run rental-demand tailwind backs the buy-and-hold thesis.
Negotiation context
- Only 4 days on market — expect competitive offers; lowballing is unlikely to land.
- Current owner paid $562k; 16% above their basis — modest negotiation headroom, anchor on the comps not their cost.
Risks & watch-outs
- Watch-outs: built in 1950 — expect roof / HVAC / electrical / plumbing capex.
- Climate carrying-cost: major flood risk; major wind risk, 69% chance of damaging wind over 30y; extreme-heat days projected 7→16/yr by 2055 (HVAC capex compounding) — expect insurance premiums to compound above CPI over the hold.
Questions for the listing agent
- Can we see the unit-by-unit rent roll, current vacancy, and any below-market leases? What's the average tenancy length?
- What capital expenditures (roof, boiler, parking lot, exteriors) have been made in the last 5 years, and what's planned in the next 2?
- Built in 1950 — when were the roof, HVAC, electrical panel, plumbing, and water heater last replaced?
- Is there a deadline driving the sale (1031 exchange, divorce, estate, relocation)? That informs how much negotiation room exists.
- Schools are B-rated — typically a magnet for longer-tenancy family renters. What's the average tenant stay here, and is there a school-zone premium baked into asking?
- Crime grade is F in this area — have there been break-ins, vandalism, or insurance claims at this property in the last 3 years? What carrier currently insures it and at what premium?
- What's the average days-on-market for RENTAL listings here right now (not sales)? A rising rental-DOM trend means longer vacancies and softer asking-rent achievability than the comps imply.
- What's the recent tenant-quality profile in this submarket — average credit score on applications, eviction rate, late-payment / NSF rate, and stable-employment percentage? A property-management company in the area should have these aggregated.
- How much new apartment / multifamily construction is in the pipeline within 1–3 miles? Heavy new supply (>2% of stock underway) typically softens rents 12–24 months out; light construction supports rent growth.
Investment metrics
- 1% rule
- 1.09% ✓
- Cap rate
- 8.64%
- Cash-on-cash
- 8.38%
- DSCR
- 1.37
- GRM
- 7.6
CMA / ARV
- ARV (on-the-fly)
- $1,124,475
- Comps found
- 12
Show comp detail 12 sales within ~0.75 mi
| Address | Dist | Beds/Ba | Sqft | Sold | Price | $/sf | Match |
|---|---|---|---|---|---|---|---|
| 221-11 146th Ave | 0.05mi | 6/4.0 | 2,172 (-0%) | 11mo | $1,200,000 | $552 | 89 |
| 14746 223rd St | 0.27mi | 6/4.0 | 2,250 (+3%) | 2mo | $1,100,000 | $489 | 80 |
| 14553 221st St | 0.05mi | 5/3.0 (-1) | 2,204 (+1%) | 12mo | $995,000 | $451 | 76 |
| 14411 223rd St | 0.26mi | 6/5.0 | 2,271 (+4%) | 0mo | $1,295,000 | $570 | 76 |
| 179-12 145 Ave | 0.47mi | 6/3.0 | 2,080 (-4%) | 2mo | $1,120,000 | $538 | 65 |
| 22820 Edgewood Ave | 0.53mi | 6/5.0 | 2,208 (+2%) | 7mo | $1,150,000 | $521 | 63 |
| 145-07 232 St | 0.58mi | 6/4.0 | 2,316 (+6%) | 8mo | $854,000 | $369 | 55 |
| 23118 145th Ave | 0.56mi | 6/5.0 | 2,000 (-8%) | 8mo | $1,100,000 | $550 | 50 |
| 14827 230th Pl | 0.55mi | 5/3.0 (-1) | 2,304 (+6%) | 8mo | $950,000 | $412 | 49 |
| 22907 148th Ave | 0.43mi | 5/2.0 (-1) | 2,288 (+5%) | 12mo | $880,000 | $385 | 49 |
| 181-36 144th Ave | 0.45mi | 6/2.0 | 2,328 (+7%) | 22mo | $842,650 | $362 | 41 |
| 14027 Coombs St | 0.69mi | 7/3.0 (+1) | 1,932 (-11%) | 2mo | $999,000 | $517 | 38 |
Match score weights: distance 35% · size 25% · config 20% · recency 20%. Top-matched comps best support the ARV.
Projected returns pro-forma
-3.0% appreciation · 3.0% rent growth · sell at horizon
- IRR
- -3.6%
- Equity multiple
- 0.87×
- Total profit
- $-24,316
- Equity at exit
- $96,917
- IRR
- 6.1%
- Equity multiple
- 1.46×
- Total profit
- $83,186
- Equity at exit
- $56,200
Cash invested: $182,000 (down + closing). Projections, not guarantees.
Landlord ↔ Tenant lean methodology
- Overall (CITY)
- 0 Strongly Tenant-Friendly
- State New York
- 15 Strongly Tenant-Friendly · D+10
- County
- — inherits STATE
- City New York
- 0 Strongly Tenant-Friendly · D+34
ZIP-level market 11413
- Active inventory
- 197
- Price-to-rent
- 15.2×
Monthly cashflow live
- Estimated rent
- $7,107 high interval (Pro) →
- Mortgage (P&I)
- −$3,409
- Tax from tax record
- −$663 /mo · $7,960/yr
- Insurance
- −$271
- HOA
- −$0
- Vacancy / Maint / Mgmt
- −$1,492
- Net cashflow
- $1,272
Break-even live
Sensitivity live
| Price | -10% $1,640 | -5% $1,456 | +0% $1,272 | +5% $1,088 | +10% $904 |
|---|---|---|---|---|---|
| Rent | -10% $710 | -5% $991 | +0% $1,272 | +5% $1,552 | +10% $1,833 |
| Rate | -1.0pp $1,599 | -0.5pp $1,437 | base $1,272 | +0.5pp $1,103 | +1.0pp $932 |
2-unit breakdown (identical units grouped — click to expand)
| Units | Beds | Baths | Est. rent |
|---|---|---|---|
| 2× units | 3 | 2 | $7,108 |
| #1 | 3 | 2 | $3,554 |
| #2 | 3 | 2 | $3,554 |
| Total (2 units) | $7,107 | ||
UW: 25.0% down · 7.5% · 30yr · 1.5% tax · 5.0% vac · 8.0% maint · 8.0% mgmt
Financing live
Cash to close
- Down payment
- $162,500
- Closing costs
- $19,500
- Reserves months
- —
- Total cash needed
- —
Loan-product check · same deal, 3 products live
Conventional
25% down · 7.5% · 30yr
- Down + closing
- —
- Monthly P&I
- —
- Monthly cashflow
- —
- DSCR
- —
- Eligible?
- —
Personal DTI + credit; lowest rate.
DSCR
20% down · 8.5% · 30yr
- Down + closing
- —
- Monthly P&I
- —
- Monthly cashflow
- —
- DSCR
- —
- Eligible?
- —
No personal income docs; deal must DSCR.
Hard money
10% down · 12.0% · 12mo
- Down + closing
- —
- Monthly P&I
- —
- Monthly cashflow
- —
- DSCR
- —
- Eligible?
- —
Short-term bridge; refi at stabilization.
Listing history 5 events
-
2026-04-06status Pending
-
2026-03-31$650,000 Active
-
2005-05-21soldstatus $562,400
-
2004-12-02soldstatus $350,000
-
2004-12-02soldstatus $350,000
ⓘ Source: listings_history table (triggers on properties + properties_extension) + one-shot
backfill from property_details.listing_events for pre-trigger history.
Tax reassessment forecast NY · Partial reset (capped growth)
- Current annual tax
- $7,960 · $663/mo
- Projected year-2 tax
- $9,472 · $789/mo
- Expected delta
- +$1,513/yr (+$126/mo · 19.0%)
ⓘ Screening estimate from a state-policy table — verify with the county assessor before closing.
Climate risk First Street
- Flood 6/10 Major FEMA zone X (unshaded) · 73% chance over 30 yrs
- Wildfire 1/10 Low
- Heat 7/10 Severe 7 d/yr ≥97°F today · 16 d/yr by 30 yrs out
- Wind 6/10 Major 69% chance of damaging wind over 30 yrs
- Air quality 4/10 Moderate 6 unhealthy d/yr today · 6 by 30 yrs out
Nearby sold comps map
Loading sold comps map…
Walkable amenities ~0.75 mi
Loading nearby amenities…
Taxation est. · year 1
- Rental income
- $85,284
- − Mortgage interest
- −$36,410
- − Property taxes
- −$7,960
- − Insurance
- −$3,250
- − Repairs & maintenance
- −$6,823
- − Management
- −$6,823
- − Depreciation
- −$18,909
- Taxable income
- $5,110
- Est. tax owed @ 24.0%
- −$1,226
- After-tax cash flow
- $14,034/yr
For passive investors: Depreciation is non-cash, so a rental often shows a tax loss while cash-flowing — sheltering income. Rental losses are passive: they offset passive income freely, and up to $25,000/yr can offset ordinary (W-2) income if you actively participate and your MAGI is under $100k (phasing out to $0 by $150k); unused losses carry forward. On sale, claimed depreciation is recaptured at up to 25%, and gains may owe capital-gains tax (a 1031 exchange can defer both). Figures are a year-1 estimate at your 24.0% rate — not tax advice; consult a CPA.
Schools (NCES district)
No district data.
Livability — New York
- Score
- 75/100
- State rank
- #268
- US rank
- #4188
Category grades
Schools grade is shown separately in the Schools card above.
Census & demographics
- Census place
- New York, NY
- City population
- 7,731,280
- Population (ZIP)
- 45,072
Population outlook (Queens County) Hauer SSP2
- Today (2025)
- 2,546,320 people
- By 2030
- 2,643,059 · +3.8%
- By 2040
- 2,815,563 · +10.6%
- By 2050
- 2,944,423 · +15.6%
- By 2075
- 3,123,338 · +22.7%
- By 2100
- 3,098,688 · +21.7%
Race, ethnicity, and origin ACS 2023
- Neighborhood character
- Predominantly Black (84%)
- Race & ethnicity
- Black 84% Hispanic / Latino 9% Two or more races 4% Asian 2% White 1%
- Hispanic origin (detail)
- Puerto Rican 3% Dominican 3%
- Common ancestry
- Hispanic 6%
- Foreign-born
- 39% · Canada, Mexico
- Languages at home
- 84% English-only · French/Haitian/Cajun 7% Spanish 6% Other Indo-European 1%
Political lean MEDSL · Queens
- 2024 margin
- Strong D (+24.6) · D 62.3% · R 37.7%
- 2008→2024 swing
- -26.2pp toward R · 2008: 50.8pp · 2024: 24.6pp
- All cycles
- 2024: D+24.6 2020: D+45.2 2016: D+53.4 2012: D+58.5 2008: D+50.8
Not yet ingested
- Civics
- —
Market trends
- HPI YoY
- ▼ -390.89%
- Current HPI
- 311.5327
- Rent YoY
- —
- Metro
- —
- State GDP YoY
- ▲ 2.60%
- F500 in state
- 92
Industry mix (Fortune 500 HQ in NY)
| Industry | F500 HQs | Revenue |
|---|---|---|
| Financial Services | 10 | $950B |
|
||
| Consumer Goods | 9 | $162B |
|
||
| Insurance | 4 | $225B |
|
||
| Telecommunications | 2 | $144B |
|
||
| Pharmaceuticals | 2 | $112B |
|
||
| Media / Entertainment | 2 | $69B |
|
||
Price history
+85.7% since first listed5 events — show timeline
- 2026-04-06 Pending — OneKey® MLS as Distributed by MLS Grid
- 2026-03-31 Listed $650,000 OneKey® MLS as Distributed by MLS Grid
- 2005-05-21 Sold (Public Records) $562,400 Public Records
- 2004-12-02 Sold (Public Records) $350,000 Public Records
- 2004-12-02 Sold (Public Records) $350,000 Public Records
Property tax history
+4.4%/yrLatest (2025): $7,960 · -2.4% YoY. Source: county tax records.
Cash-flow waterfall
monthlySold comps — $/sqft
last 12 mo · ≤1 miLoading sold comps…