 🏷️ Likely Rental
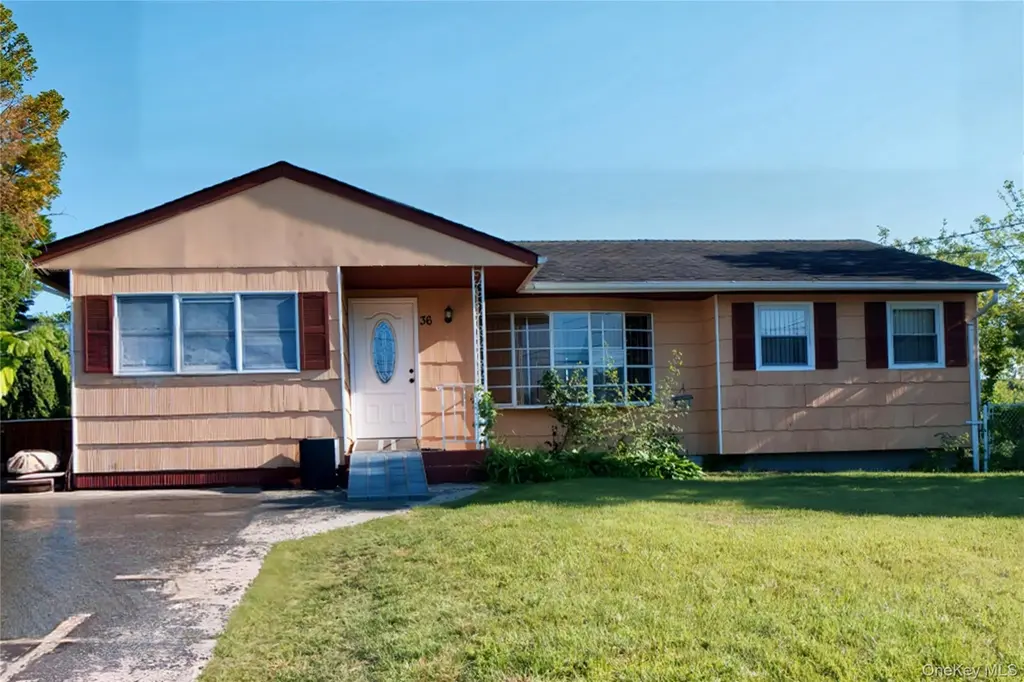
36 Jackson Ave · Centereach, NY
Flood risk 3/10 · Minor
- FEMA flood zone
- X (unshaded)
- Chance of flooding over 30 yrs
- 0.12%
- Est. flood insurance / yr
- $473 – $860
Fire risk 1/10 · Minimal
- Est. fire insurance / yr
- $691 – $1,283
Heat risk 5/10 · Moderate
- Hot days now (above 94°F)
- 7 days/yr
- Hot days in 30 yrs
- 18 days/yr
Wind risk 6/10 · Moderate
- Chance of severe wind over 30 yrs
- 72.0%
Air-quality risk 4/10 · Minor
- Unhealthy air days now
- 4 days/yr
- Unhealthy air days in 30 yrs
- 5 days/yr
Risk factors via First Street. Map © Google.
Why this score? — see what drove the C+ grade
The composite is a weighted blend of 9 inputs, each scored 0–100. Each bar is that input's sub-score; the figure is the points it added to the 100-point composite (weight × sub-score).
- Cash flow +19.1/30.0
- ARV discount +15.0/15.0
- 1% rule +6.2/10.0
- DSCR +6.0/10.0
- Schools +5.3/10.0
- Livability +3.6/5.0
- Rent growth +2.5/5.0
- Condition / age +2.5/5.0
- Appreciation +0.0/10.0
$449,900
🖨 Deal sheet 📄 Offer letter ✓ Due diligence
Listing remarks
Great Investment property - Rented until April 30, 2027. Long Term tenants of 20+ years would like to stay. Call for lease details. 3/4 bedrooms, hardwood floors, great condition.
Key facts
- 7,405 sq ft lot
- Built 1962
- Listed 30 days
Property features AI
Exterior
- Parking: Driveway; Off-street parking
- Utilities: Cesspool sewer; Cable connected; Electricity connected; Natural gas connected; Public trash collection; Water connected
- Home design: Single-family residence
- Construction: Frame construction
- Exterior features: Frame construction; Not waterfront
Interior
- Kitchen: Oven; Range; Refrigerator
- Bedrooms: Rooms total: 6 (includes bedrooms and living spaces)
- Bathrooms: 1 full bathroom
- Heating & cooling: Hot air heating; Natural gas heating; No central cooling
- Interior features: First-floor bedroom; First-floor full bathroom; Partial attic; Full basement
Neighborhood map
What this means for you Summary
Snapshot
- This is a 4-bed/1.0-bath single-family listed at $450k.
Deal economics
- At list price, monthly cash flow is $479 ($6k/yr) — positive.
- The deal already cash-flows at list — no discount required.
- Meets the 1% rule at list price ($5k rent vs $450k).
- Recommended offer: $436k (3.0% below list) — sets the bar for market timing.
- Cap rate 7.6% vs local median 3.8% in Centereach — top-decile yield for the area; either an underpriced asset or a hidden risk that comps aren't pricing in. Stress-test before assuming the spread holds.
Location & tenants
- Location reads 72/100 on livability (#362 in NY) — a middle-class / working-renter tenant base. Strengths: employment A+, housing A+, health & safety A+; Watch: amenities F, commute F, cost of living F.
- Middle Country Central School District (suburban): math 60% / reading 56% proficiency, ranked #217 of 590 in NY (top 37%) — acceptable for families but not a draw, mixed tenant base, ~2y average lease.
- Zoned schools: North Coleman Road School (math 50% / reading 50%, grade D, #1,085 of 2,108 statewide, top 56%, 344 students, 31% FRL); Selden Middle School (math 42% / reading 52%, grade D+, #315 of 729 statewide, top 45%, 1,058 students, 37% FRL); Centereach High School (math 84% / reading 77%, grade A, #506 of 1,100 statewide, top 46%, 1,475 students, 35% FRL).
- Market conditions: 147 active listings in the ZIP; 2 comparable units currently listed for rent nearby; high-income renter base; 1,366 units permitted in Suffolk County in 2024 (216 in 5+ unit buildings).
- This rent runs 45% of the median local income ($135k/yr) — at the standard rent-burdened threshold; future hikes will face affordability resistance.
Forward outlook
- Local home prices are declining (-3.0%/yr); year-one equity from $3k of loan paydown is wiped out by about $13k of value loss. Plan a longer hold.
- Suffolk County population projected to shrink 5% by 2050 — rents likely to lag national; underwrite the cash flow, not the appreciation.
Negotiation context
- It's been on market 31 days — a 3% lower offer ($436k) is reasonable based on typical stale-listing flexibility.
- Current owner paid $104k; list at $450k implies a 335% gain — meaningful room to come down on a strong offer.
Risks & watch-outs
- Watch-outs: property tax is 2.5% of price.
- Climate carrying-cost: major wind risk, 72% chance of damaging wind over 30y; extreme-heat days projected 7→18/yr by 2055 (HVAC capex compounding) — expect insurance premiums to compound above CPI over the hold.
Questions for the listing agent
- It's been on market 31 days. Have you received any prior offers? Is the seller open to a 3% concession, seller financing, or rate buy-down credit?
- Built in 1962 — when were the roof, HVAC, electrical panel, plumbing, and water heater last replaced?
- Property tax is high relative to price — has the assessment been appealed recently, and will the sale trigger a re-assessment?
- Is there a deadline driving the sale (1031 exchange, divorce, estate, relocation)? That informs how much negotiation room exists.
- Schools are B-rated — typically a magnet for longer-tenancy family renters. What's the average tenant stay here, and is there a school-zone premium baked into asking?
- What's the average days-on-market for RENTAL listings here right now (not sales)? A rising rental-DOM trend means longer vacancies and softer asking-rent achievability than the comps imply.
- What's the recent tenant-quality profile in this submarket — average credit score on applications, eviction rate, late-payment / NSF rate, and stable-employment percentage? A property-management company in the area should have these aggregated.
- How much new for-sale + rental construction is in the pipeline within 1–3 miles? Heavy new supply typically softens prices + rents 12–24 months out; constrained supply supports both.
Investment metrics
- 1% rule
- 1.12% ✓
- Cap rate
- 7.57%
- Cash-on-cash
- 4.56%
- DSCR
- 1.20
- GRM
- 7.5
CMA / ARV
- ARV (on-the-fly)
- $572,232
- Comps found
- 12
Show comp detail 12 sales within ~0.75 mi
| Address | Dist | Beds/Ba | Sqft | Sold | Price | $/sf | Match |
|---|---|---|---|---|---|---|---|
| 21 Jackson Ave | 0.14mi | 4/1.0 | 1,200 (-5%) | 4mo | $585,000 | $488 | 82 |
| 134 Boyle Rd | 0.46mi | 3/1.0 (-1) | 1,221 (-4%) | 2mo | $545,000 | $446 | 66 |
| 68 Ruland Rd | 0.21mi | 3/1.0 (-1) | 1,175 (-7%) | 9mo | $575,000 | $489 | 66 |
| 1 Washington Ave | 0.31mi | 3/2.0 (-1) | 1,333 (+5%) | 6mo | $720,000 | $540 | 63 |
| 72 Ruland Rd | 0.18mi | 5/2.0 (+1) | 1,400 (+11%) | 5mo | $633,000 | $452 | 61 |
| 90 Selden Blvd | 0.55mi | 3/2.5 (-1) | 1,251 (-1%) | 2mo | $635,000 | $508 | 60 |
| 3 Washington Ave | 0.19mi | 3/1.5 (-1) | 1,417 (+12%) | 10mo | $550,000 | $388 | 56 |
| 23 Holiday Park Dr | 0.40mi | 4/1.5 | 1,443 (+14%) | 4mo | $525,000 | $364 | 52 |
| 15 Liberty Ave | 0.72mi | 4/2.0 | 1,238 (-2%) | 8mo | $606,000 | $489 | 52 |
| 22 Larry Rd | 0.63mi | 4/1.5 | 1,400 (+11%) | 5mo | $601,000 | $429 | 47 |
| 42 Holiday Park Dr | 0.52mi | 3/2.0 (-1) | 1,400 (+11%) | 4mo | $620,000 | $443 | 46 |
| 40 King Ave | 0.56mi | 3/2.0 (-1) | 1,450 (+14%) | 8mo | $615,000 | $424 | 34 |
Match score weights: distance 35% · size 25% · config 20% · recency 20%. Top-matched comps best support the ARV.
Projected returns pro-forma
-3.0% appreciation · 3.0% rent growth · sell at horizon
- IRR
- -9.1%
- Equity multiple
- 0.67×
- Total profit
- $-42,085
- Equity at exit
- $67,082
- IRR
- 0.4%
- Equity multiple
- 1.03×
- Total profit
- $3,894
- Equity at exit
- $38,899
Cash invested: $125,972 (down + closing). Projections, not guarantees.
Landlord ↔ Tenant lean methodology
- Overall (STATE)
- 15 Strongly Tenant-Friendly
- State New York
- 15 Strongly Tenant-Friendly · D+10
- County
- — inherits STATE
- City
- — inherits STATE
ZIP-level market 11720
- Active inventory
- 147
- Price-to-rent
- 7.5×
Monthly cashflow live
- Estimated rent
- $5,022 medium interval (Pro) →
- Mortgage (P&I)
- −$2,359
- Tax from tax record
- −$942 /mo · $11,300/yr
- Insurance
- −$187
- HOA
- −$0
- Vacancy / Maint / Mgmt
- −$1,055
- Net cashflow
- $479
Break-even live
UW: 25.0% down · 7.5% · 30yr · 1.5% tax · 5.0% vac · 8.0% maint · 8.0% mgmt
Financing live
Cash to close
- Down payment
- $112,475
- Closing costs
- $13,497
- Reserves months
- —
- Total cash needed
- —
Loan-product check · same deal, 3 products live
Conventional
25% down · 7.5% · 30yr
- Down + closing
- —
- Monthly P&I
- —
- Monthly cashflow
- —
- DSCR
- —
- Eligible?
- —
Personal DTI + credit; lowest rate.
DSCR
20% down · 8.5% · 30yr
- Down + closing
- —
- Monthly P&I
- —
- Monthly cashflow
- —
- DSCR
- —
- Eligible?
- —
No personal income docs; deal must DSCR.
Hard money
10% down · 12.0% · 12mo
- Down + closing
- —
- Monthly P&I
- —
- Monthly cashflow
- —
- DSCR
- —
- Eligible?
- —
Short-term bridge; refi at stabilization.
Rent comps 2 comps
| Address | Beds | Baths | Sqft | Rent | $/sqft | DOM | Units | Dist |
|---|---|---|---|---|---|---|---|---|
| 127 Berkeley Ave Selden, NY | 5.0 | 2.0 | 1598 | $4,500 | $2.82 | 18d | 1 | 0.54mi |
| 92 Dare Rd Selden, NY | 3.0 | 1.0 | 1008 | $3,600 | $3.57 | 18d | 1 | 1.24mi |
Listing history 16 events
-
2026-06-18days on market $449,900 Active 31 DOM
-
2026-06-17days on market $449,900 Active 30 DOM
-
2026-06-16days on market $449,900 Active 29 DOM
-
2026-06-15days on market $449,900 Active 28 DOM
-
2026-06-13pricedays on market $449,900 Active 26 DOM
-
2026-06-09days on market $499,900 Active 22 DOM
-
2026-06-08days on market $499,900 Active 21 DOM
-
2026-06-07days on market $499,900 Active 20 DOM
-
2026-06-04days on market $499,900 Active 17 DOM
-
2026-06-03days on market $499,900 Active 16 DOM
-
2026-06-02days on market $499,900 Active 15 DOM
-
2026-06-01days on market $499,900 Active 14 DOM
-
2026-05-31days on market $499,900 Active 13 DOM
-
2026-05-18$599,900 Active
-
1986-09-26soldstatus $103,500
-
1985-07-17soldstatus $87,500
ⓘ Source: listings_history table (triggers on properties + properties_extension) + one-shot
backfill from property_details.listing_events for pre-trigger history.
Tax reassessment forecast NY · Partial reset (capped growth)
- Current annual tax
- $11,300 · $942/mo
- Projected year-2 tax
- $11,300 · $942/mo
- Expected delta
- $0/yr ($0/mo · 0.0%)
ⓘ Screening estimate from a state-policy table — verify with the county assessor before closing.
Climate risk First Street
- Flood 3/10 Moderate FEMA zone X (unshaded) · 12% chance over 30 yrs
- Wildfire 1/10 Low
- Heat 5/10 Major 7 d/yr ≥94°F today · 18 d/yr by 30 yrs out
- Wind 6/10 Major 72% chance of damaging wind over 30 yrs
- Air quality 4/10 Moderate 4 unhealthy d/yr today · 5 by 30 yrs out
Nearby sold comps map
Loading sold comps map…
Walkable amenities ~0.75 mi
Loading nearby amenities…
Taxation est. · year 1
- Rental income
- $60,265
- − Mortgage interest
- −$25,201
- − Property taxes
- −$11,300
- − Insurance
- −$2,250
- − Repairs & maintenance
- −$4,821
- − Management
- −$4,821
- − Depreciation
- −$13,088
- Taxable loss
- −$1,216
- Est. tax savings @ 24.0%
- +$292
- After-tax cash flow
- $6,040/yr
For passive investors: Depreciation is non-cash, so a rental often shows a tax loss while cash-flowing — sheltering income. Rental losses are passive: they offset passive income freely, and up to $25,000/yr can offset ordinary (W-2) income if you actively participate and your MAGI is under $100k (phasing out to $0 by $150k); unused losses carry forward. On sale, claimed depreciation is recaptured at up to 25%, and gains may owe capital-gains tax (a 1031 exchange can defer both). Figures are a year-1 estimate at your 24.0% rate — not tax advice; consult a CPA.
Schools (NCES district)
- District
- Middle Country Central School District
- NCES district ID
- 3619200
- Math proficiency
- 60% ▼ -1.00%
- Reading proficiency
- 56% ▼ -5.00%
- Median HH income
- $86,140
- Composite
- 52.89/100
- National rank
- #1532
- State rank
- #217 of 590 in NY
Livability — Centereach
- Score
- 72/100
- State rank
- #362
- US rank
- #6174
Category grades
Schools grade is shown separately in the Schools card above.
Census & demographics
- Census place
- Centereach, NY
- County
- Suffolk County · 679,920 people
- City population
- 29,292
- Metro
- New York-Newark-Jersey City, NY-NJ-PA
- Population (ZIP)
- 29,292
- Household income
- $134,898
- Rent vs Own
- Severe rent burden
- 436.0
Population outlook (Suffolk County) Hauer SSP2
- Today (2025)
- 1,505,262 people
- By 2030
- 1,498,318 · -0.5%
- By 2040
- 1,471,101 · -2.3%
- By 2050
- 1,424,848 · -5.3%
- By 2075
- 1,337,157 · -11.2%
- By 2100
- 1,217,720 · -19.1%
Race, ethnicity, and origin ACS 2023
- Neighborhood character
- Predominantly White (69%)
- Race & ethnicity
- White 69% Hispanic / Latino 15% Asian 7% Two or more races 7% Black 6%
- Hispanic origin (detail)
- Mexican 1% Puerto Rican 5%
- Common ancestry
- Romanian 4% Scotch-Irish 2% Lithuanian 2%
- Foreign-born
- 15% · Canada, China, Jamaica
- Languages at home
- 82% English-only · Spanish 8% Other Indo-European 3% Other Asian/Pacific 2%
Political lean MEDSL · Suffolk
- 2024 margin
- Lean R (+10.0) · D 45.0% · R 55.0%
- 2008→2024 swing
- -16.0pp toward R · 2008: 6.0pp · 2024: -10.0pp
- All cycles
- 2024: R+10.0 2020: R+0.0 2016: R+8.2 2012: D+2.9 2008: D+6.0
Not yet ingested
- Civics
- —
Market trends
- HPI YoY
- ▼ -633.07%
- Current HPI
- 347.7369
- Rent YoY
- —
- Metro
- New York-Newark-Jersey City, NY-NJ-PA
- State GDP YoY
- ▲ 2.60%
- F500 in state
- 92
Industry mix (Fortune 500 HQ in NY)
| Industry | F500 HQs | Revenue |
|---|---|---|
| Financial Services | 10 | $950B |
|
||
| Consumer Goods | 9 | $162B |
|
||
| Insurance | 4 | $225B |
|
||
| Telecommunications | 2 | $144B |
|
||
| Pharmaceuticals | 2 | $112B |
|
||
| Media / Entertainment | 2 | $69B |
|
||
Price history
+585.6% since first listed3 events — show timeline
- 2026-05-18 Listed $599,900 OneKey® MLS as Distributed by MLS Grid
- 1986-09-26 Sold (Public Records) $103,500 Public Records
- 1985-07-17 Sold (Public Records) $87,500 Public Records
Property tax history
+2.5%/yrLatest (2025): $11,300 · +0.0% YoY. Source: county tax records.
Cash-flow waterfall
monthlySold comps — $/sqft
last 12 mo · ≤1 miLoading sold comps…