 Triplex
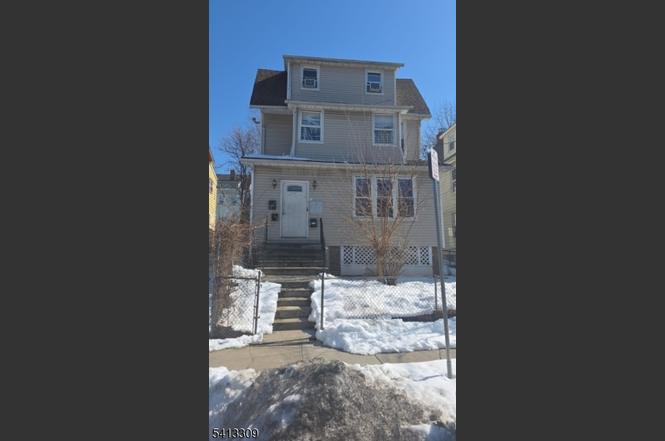
92-94 Cedar Ave · Newark, NJ
Flood risk 7/10 · Major
- FEMA flood zone
- X (unshaded)
- Chance of flooding over 30 yrs
- 0.99%
- Est. flood insurance / yr
- $507 – $1,088
Fire risk 1/10 · Minimal
- Est. fire insurance / yr
- $526 – $976
Heat risk 7/10 · Major
- Hot days now (above 100°F)
- 7 days/yr
- Hot days in 30 yrs
- 15 days/yr
Wind risk 6/10 · Moderate
- Chance of severe wind over 30 yrs
- 27.0%
Air-quality risk 4/10 · Minor
- Unhealthy air days now
- 4 days/yr
- Unhealthy air days in 30 yrs
- 5 days/yr
Risk factors via First Street. Map © Google.
Why this score? — see what drove the C grade
The composite is a weighted blend of 9 inputs, each scored 0–100. Each bar is that input's sub-score; the figure is the points it added to the 100-point composite (weight × sub-score).
- Cash flow +19.6/30.0
- ARV discount +9.9/15.0
- DSCR +6.2/10.0
- 1% rule +5.2/10.0
- Appreciation +5.0/10.0
- Livability +3.4/5.0
- Rent growth +2.5/5.0
- Condition / age +2.5/5.0
- Schools +1.4/10.0
$579,000
🖨 Deal sheet (PDF) 📄 Offer letter ✓ Due diligence
Multi-family units
County records classify this as Multi-Family (2-4 Unit). Listing-text estimate: 3 units. confirmed
Listing remarks
Charming three-family home offering total of 7 bedrooms and 3 bathrooms. House needs work but still offers a solid investment potential. This property features three spacious units spread across three levels, each with comfortable layouts and abundant natural light. The exterior boasts low-maintenance vinyl siding, a welcoming front entry with steps and railing. Each unit offers bright living spaces, generously sized bedrooms, and functional kitchens and baths. It has ample windows throughout create an airy feel. The property includes a basement for additional storage potential and separate utilities. Conveniently located near public transportation, shops, restaurants, and major highways, t
Key facts
- Three family home
- Bright living spaces
- Functional kitchens
Tags
Property features AI
Finance
- Other: Approximate lot size noted (40,100)
- Financial info: 3 total units; Reported gross operating income: 999; Reported net operating income: 999; Reported total operating expenses: 999; Unit rents reported (example): Unit 3 rent listed as 1300; Units 1 and 2 rents listed as 999
Exterior
- Parking: 2 off-street parking spaces; 1 detached garage; Driveway exclusive (one-car width)
- Utilities: Public water; Public sewer; All utilities underground
- Home design: Three-story multifamily building
- Construction: Year built: approximate
- Exterior features: Vinyl siding; Asphalt shingle roof; All underground utilities
Interior
- Kitchen: Gas range/oven; Refrigerator
- Bedrooms: Unit 1: 3 bedrooms; Unit 2: 3 bedrooms; Unit 3: 1 bedroom
- Bathrooms: 3 full bathrooms (total)
- Heating & cooling: Forced hot air heating; Natural gas heating fuel
- Interior features: Unfinished basement; Carbon monoxide detectors in units
- Laundry & utility: Owner pays water for each unit; tenants pay electric, gas, and heat (per-unit utilities arrangement)
Neighborhood map
What this means for you Summary
Snapshot
- This is a 3 × 2-bed/1.0-bath units multifamily listed at $579k.
Deal economics
- At list price, monthly cash flow is $600 ($7k/yr) — positive. Per door: $200/mo.
- The deal already cash-flows at list — no discount required.
- Meets the 1% rule at list price ($6k rent vs $579k).
- Recommended offer: $544k (6.0% below list) — sets the bar for market timing.
- Cap rate 7.7% vs local median 3.0% in Newark — top-decile yield for the area; either an underpriced asset or a hidden risk that comps aren't pricing in. Stress-test before assuming the spread holds.
Location & tenants
- Location reads 67/100 on livability (#343 in NJ) — a middle-class / working-renter tenant base. Strengths: commute A+, amenities A-; Watch: schools D+, housing D+, crime F.
- Newark Public School District (urban): math 9% / reading 26% proficiency, ranked #452 of 472 in NJ (top 96%) — low school quality limits family demand, transient renter base, plan for 1-2y turnover; 79% free/reduced lunch — lower-income household profile, screen leases tightly.
- Market conditions: 1 active listings in the ZIP; 1 comparable units currently listed for rent nearby; 3,364 units permitted in Essex County in 2024 (2,551 in 5+ unit buildings).
Forward outlook
- In year one you build about $21k of equity ($4k loan paydown + $17k appreciation (3.0% local appreciation)).
- Essex County population projected at +3% by 2050 — modest demand growth; plan on rents tracking national, not racing it.
- At projected returns (3.0% appreciation + 3.0% rent growth), your $162k cash investment doubles in ~5 years — after that, you're playing with house money.
- By year 2, paydown + projected appreciation supports a ~$35k cash-out refi (75% LTV) — recoverable capital for the next deal without selling this one.
Negotiation context
- It's been on market 73 days — a 6% lower offer ($544k) is reasonable based on typical stale-listing flexibility.
- 2 sale attempts since 9y ago with the ask held roughly flat each time — persistent listings suggest the price (not the market) is what's stuck; bring a comps-based counter.
- Current owner paid $130k; list at $579k implies a 346% gain — meaningful room to come down on a strong offer.
Risks & watch-outs
- Watch-outs: flood insurance adds $66/mo; built in 1930 — expect roof / HVAC / electrical / plumbing capex.
- Climate carrying-cost: major flood risk; major wind risk, 27% chance of damaging wind over 30y; extreme-heat days projected 7→15/yr by 2055 (HVAC capex compounding) — expect insurance premiums to compound above CPI over the hold.
Questions for the listing agent
- It's been on market 73 days. Have you received any prior offers? Is the seller open to a 6% concession, seller financing, or rate buy-down credit?
- Can we see the unit-by-unit rent roll, current vacancy, and any below-market leases? What's the average tenancy length?
- What capital expenditures (roof, boiler, parking lot, exteriors) have been made in the last 5 years, and what's planned in the next 2?
- Built in 1930 — when were the roof, HVAC, electrical panel, plumbing, and water heater last replaced?
- What's the actual annual flood-insurance premium (NFIP or private), and is the property in a SFHA with mandatory coverage?
- Why hasn't it sold? Are there any deal-killer items the seller is aware of (foundation, flood, title, zoning, code violations)?
- Is there a deadline driving the sale (1031 exchange, divorce, estate, relocation)? That informs how much negotiation room exists.
- Schools are D-rated, which usually means shorter tenancies and higher turnover. Who's the typical renter profile here, and what's been the actual vacancy rate?
- Crime grade is F in this area — have there been break-ins, vandalism, or insurance claims at this property in the last 3 years? What carrier currently insures it and at what premium?
- What's the average days-on-market for RENTAL listings here right now (not sales)? A rising rental-DOM trend means longer vacancies and softer asking-rent achievability than the comps imply.
- What's the recent tenant-quality profile in this submarket — average credit score on applications, eviction rate, late-payment / NSF rate, and stable-employment percentage? A property-management company in the area should have these aggregated.
- How much new apartment / multifamily construction is in the pipeline within 1–3 miles? Heavy new supply (>2% of stock underway) typically softens rents 12–24 months out; light construction supports rent growth.
Investment metrics
- 1% rule
- 1.02% ✓
- Cap rate
- 7.67%
- Cash-on-cash
- 4.94%
- DSCR
- 1.22
- GRM
- 8.2
CMA / ARV
- ARV (on-the-fly)
- $611,388
- Comps found
- 1
Show comp detail 1 sale within ~0.75 mi
| Address | Dist | Beds/Ba | Sqft | Sold | Price | $/sf | Match |
|---|---|---|---|---|---|---|---|
| 312 Rhode Island Ave | 0.69mi | 6/4.0 | 3,326 (+11%) | 0mo | $680,000 | $204 | 45 |
Match score weights: distance 35% · size 25% · config 20% · recency 20%. Top-matched comps best support the ARV.
Projected returns pro-forma
3.0% appreciation · 3.0% rent growth · sell at horizon
- IRR
- 11.7%
- Equity multiple
- 1.67×
- Total profit
- $108,113
- Equity at exit
- $260,343
- IRR
- 13.8%
- Equity multiple
- 3.05×
- Total profit
- $331,558
- Equity at exit
- $401,220
Cash invested: $162,120 (down + closing). Projections, not guarantees.
Landlord ↔ Tenant lean methodology
- Overall (CITY)
- 0 Strongly Tenant-Friendly
- State New Jersey
- 21 Tenant-Leaning · D+6
- County
- — inherits STATE
- City Newark
- 0 Strongly Tenant-Friendly · D+59
ZIP-level market 07106-1355
- Active inventory
- 1
- Price-to-rent
- 24.5×
Monthly cashflow live
- Estimated rent
- $5,909 high interval (Pro) →
- Mortgage (P&I)
- −$3,036
- Tax est. 1.5%
- −$724 /mo · $8,685/yr
- Insurance
- −$241
- Flood insurance flood zone
- −$66 /mo · $798/yr
- HOA
- −$0
- Vacancy / Maint / Mgmt
- −$1,241
- Net cashflow
- $600
Break-even live
Sensitivity live
| Price | -10% $1,000 | -5% $800 | +0% $600 | +5% $400 | +10% $200 |
|---|---|---|---|---|---|
| Rent | -10% $134 | -5% $367 | +0% $600 | +5% $834 | +10% $1,067 |
| Rate | -1.0pp $892 | -0.5pp $748 | base $600 | +0.5pp $450 | +1.0pp $298 |
3-unit breakdown (identical units grouped — click to expand)
| Units | Beds | Baths | Est. rent |
|---|---|---|---|
| 3× units | 2 | 1 | $5,910 |
| #1 | 2 | 1 | $1,970 |
| #2 | 2 | 1 | $1,970 |
| #3 | 2 | 1 | $1,970 |
| Total (3 units) | $5,909 | ||
UW: 25.0% down · 7.5% · 30yr · 1.5% tax · 5.0% vac · 8.0% maint · 8.0% mgmt
Financing live
Cash to close
- Down payment
- $144,750
- Closing costs
- $17,370
- Reserves months
- —
- Total cash needed
- —
Loan-product check · same deal, 3 products live
Conventional
25% down · 7.5% · 30yr
- Down + closing
- —
- Monthly P&I
- —
- Monthly cashflow
- —
- DSCR
- —
- Eligible?
- —
Personal DTI + credit; lowest rate.
DSCR
20% down · 8.5% · 30yr
- Down + closing
- —
- Monthly P&I
- —
- Monthly cashflow
- —
- DSCR
- —
- Eligible?
- —
No personal income docs; deal must DSCR.
Hard money
10% down · 12.0% · 12mo
- Down + closing
- —
- Monthly P&I
- —
- Monthly cashflow
- —
- DSCR
- —
- Eligible?
- —
Short-term bridge; refi at stabilization.
Rent comps 1 comps
| Address | Beds | Baths | Sqft | Rent | $/sqft | DOM | Units | Dist |
|---|---|---|---|---|---|---|---|---|
| 108 N Oraton Pkwy Fl 1 East Orange, NJ | 5.0 | 3.0 | 3289 | $4,500 | $1.37 | 3d | 1 | 1.13mi |
Listing history 7 events
-
2026-05-11status Under Contract
-
2026-04-20price $579,000
-
2026-04-08price $589,000
-
2026-02-27$599,000 Active
-
2017-07-06soldstatus $129,900 Sold
-
2017-05-09historical
-
2017-05-05$129,900 Active
ⓘ Source: listings_history table (triggers on properties + properties_extension) + one-shot
backfill from property_details.listing_events for pre-trigger history.
Climate risk First Street
- Flood 7/10 Severe FEMA zone X (unshaded) · 99% chance over 30 yrs
- Wildfire 1/10 Low
- Heat 7/10 Severe 7 d/yr ≥100°F today · 15 d/yr by 30 yrs out
- Wind 6/10 Major 27% chance of damaging wind over 30 yrs
- Air quality 4/10 Moderate 4 unhealthy d/yr today · 5 by 30 yrs out
Nearby sold comps map
Loading sold comps map…
Walkable amenities ~0.75 mi
Loading nearby amenities…
Taxation est. · year 1
- Rental income
- $70,908
- − Mortgage interest
- −$32,433
- − Property taxes
- −$8,685
- − Insurance
- −$3,692
- − Repairs & maintenance
- −$5,673
- − Management
- −$5,673
- − Depreciation
- −$16,844
- Taxable loss
- −$2,091
- Est. tax savings @ 24.0%
- +$502
- After-tax cash flow
- $7,706/yr
For passive investors: Depreciation is non-cash, so a rental often shows a tax loss while cash-flowing — sheltering income. Rental losses are passive: they offset passive income freely, and up to $25,000/yr can offset ordinary (W-2) income if you actively participate and your MAGI is under $100k (phasing out to $0 by $150k); unused losses carry forward. On sale, claimed depreciation is recaptured at up to 25%, and gains may owe capital-gains tax (a 1031 exchange can defer both). Figures are a year-1 estimate at your 24.0% rate — not tax advice; consult a CPA.
Schools (NCES district)
- District
- Newark Public School District
- NCES district ID
- 3411340
- Math proficiency
- 9% ▼ -17.00%
- Reading proficiency
- 26% ▼ -10.00%
- Median HH income
- $33,891
- Composite
- 14.24/100
- National rank
- #9449
- State rank
- #452 of 472 in NJ
Livability — Newark
- Score
- 67/100
- State rank
- #343
- US rank
- #11138
Category grades
Schools grade is shown separately in the Schools card above.
Census & demographics
- Census place
- Newark, NJ
Population outlook (Essex County) Hauer SSP2
- Today (2025)
- 825,042 people
- By 2030
- 834,010 · +1.1%
- By 2040
- 846,221 · +2.6%
- By 2050
- 850,047 · +3.0%
- By 2075
- 837,009 · +1.5%
- By 2100
- 784,345 · -4.9%
Not yet ingested
- Political lean
- —
- Race & ethnicity
- —
- Common origin
- —
- Civics
- —
Market trends
- HPI YoY
- —
- Current HPI
- —
- Rent YoY
- —
- Metro
- —
- State GDP YoY
- ▲ 2.05%
- F500 in state
- 34
Industry mix (Fortune 500 HQ in NJ)
| Industry | F500 HQs | Revenue |
|---|---|---|
| Consumer Goods | 3 | $31B |
|
||
| Pharmaceuticals | 2 | $153B |
|
||
| Technology | 2 | $21B |
|
||
| Insurance | 2 | $20B |
|
||
| Healthcare | 2 | $19B |
|
||
| Financial Services | 1 | $70B |
|
||
Price history
+345.7% since first listed7 events — show timeline
- 2026-05-11 Pending — GSMLS
- 2026-04-20 Price Changed $579,000 GSMLS
- 2026-04-08 Price Changed $589,000 GSMLS
- 2026-02-27 Listed $599,000 GSMLS
- 2017-07-06 Sold (MLS) $129,900 GSMLS
- 2017-05-09 Delisted — GSMLS
- 2017-05-05 Listed $129,900 GSMLS
Cash-flow waterfall
monthlySold comps — $/sqft
last 12 mo · ≤1 miLoading sold comps…