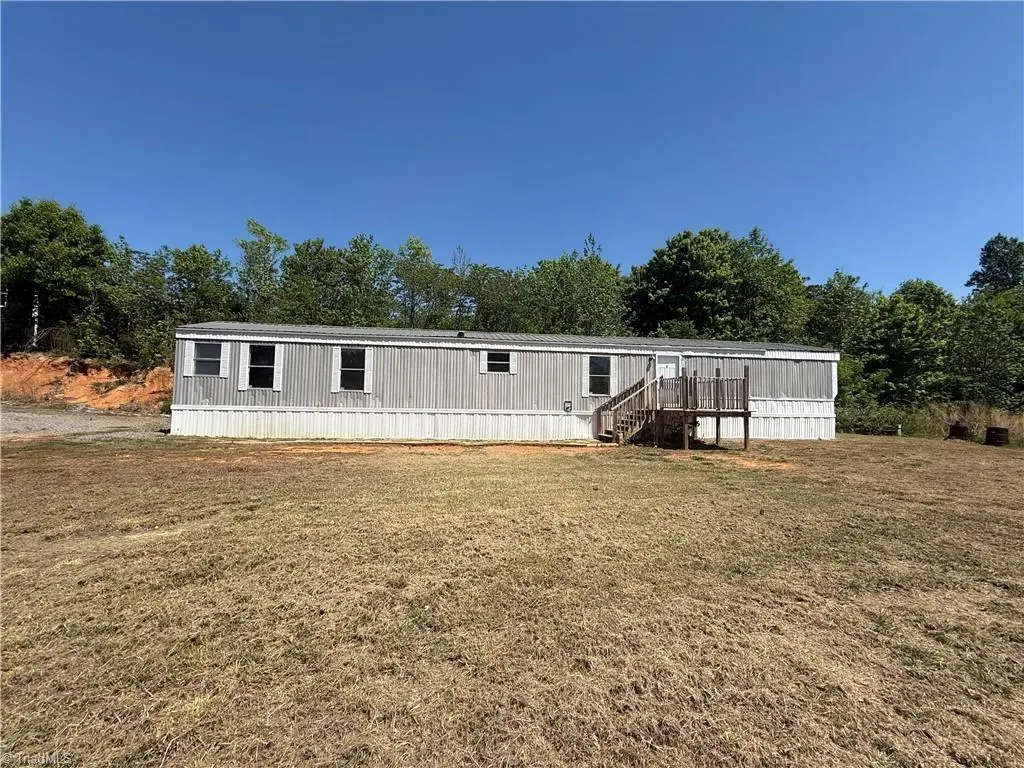
2738 Old Mountain Rd · Trinity, NC
Flood risk 1/10 · Minimal
- FEMA flood zone
- X (unshaded)
- Chance of flooding over 30 yrs
- 0.0%
- Est. flood insurance / yr
- $507 – $1,088
Fire risk 3/10 · Minor
- Est. fire insurance / yr
- $906 – $1,684
Heat risk 5/10 · Moderate
- Hot days now (above 103°F)
- 6 days/yr
- Hot days in 30 yrs
- 15 days/yr
Wind risk 4/10 · Minor
- Chance of severe wind over 30 yrs
- 16.0%
Air-quality risk 2/10 · Minimal
- Unhealthy air days now
- 1 days/yr
- Unhealthy air days in 30 yrs
- 1 days/yr
Risk factors via First Street. Map © Google.
Why this score? — see what drove the C+ grade
The composite is a weighted blend of 9 inputs, each scored 0–100. Each bar is that input's sub-score; the figure is the points it added to the 100-point composite (weight × sub-score).
- Cash flow +26.8/30.0
- DSCR +9.2/10.0
- ARV discount +7.5/15.0
- 1% rule +5.9/10.0
- Schools +3.6/10.0
- Livability +3.5/5.0
- Rent growth +2.5/5.0
- Condition / age +2.5/5.0
- Appreciation +0.0/10.0
$134,900
🖨 Deal sheet (PDF) 📄 Offer letter ✓ Due diligence
Listing remarks
Welcome to this well-maintained 2BR/2BA manufactured home sitting on 1.34 acres in a quiet rural setting in Trinity. This property offers a functional open floor plan with a spacious living area that flows into the kitchen, featuring white cabinetry, ample counter space, and a practical layout for everyday living. The split-bedroom design provides privacy, with a primary suite offering a full bath, while the secondary bedroom is conveniently located near the second full bathroom. Enjoy the outdoors with a large, level yard—ideal for gardening, pets, or entertaining. The property provides plenty of space for future additions or recreational use. Conveniently located with easy access to
Key facts
- Open floor plan
- Ample counter space
- Spacious living area
Tags
Property features AI
Finance
- Other: Living room approximately 13 ft x 16 ft 9 in; Additional main-level rooms approximately 10 ft 8 in x 11 ft 4 in and 9 ft 11 in x 18 ft 2 in; Building area listed as 972 (unit not shown)
- HOA & community: No homeowners association
Exterior
- Parking: Gravel parking
- Utilities: Septic tank sewer; Electric water heater
- Home design: Manufactured single-wide home; Built in 1994; One level
- Construction: Vinyl siding; Crawl space foundation
- Exterior features: 1.34-acre lot; Public and well water sources; Publicly maintained road access; No pool; No guest house
Interior
- Kitchen: Kitchen on main level
- Bedrooms: Bedrooms located on main level
- Bathrooms: 2 full bathrooms
- Heating & cooling: Heat pump for heating and cooling; Electric heating
- Interior features: Primary bedroom on main level; Total of 5 rooms
- Laundry & utility: Main-level laundry room (5 ft x 5 ft)
Neighborhood map
What this means for you Summary
Snapshot
- This is a 2-bed/2.0-bath manufactured listed at $135k.
Deal economics
- At list price, monthly cash flow is $368 ($4k/yr) — positive.
- The deal already cash-flows at list — no discount required.
- Meets the 1% rule at list price ($1k rent vs $135k).
- Recommended offer: $127k (6.0% below list) — sets the bar for market timing.
- Cap rate 9.6% vs local median 3.4% in Trinity — top-decile yield for the area; either an underpriced asset or a hidden risk that comps aren't pricing in. Stress-test before assuming the spread holds.
Location & tenants
- Location reads 69/100 on livability (#161 in NC) — a middle-class / working-renter tenant base. Strengths: cost of living A+, housing A+; Watch: amenities F, commute F, health & safety F.
- Randolph County School System (rural): math 43% / reading 43% proficiency, ranked #94 of 178 in NC (top 53%) — families likely to look elsewhere, expect single-tenant / working-renter base with shorter leases.
- Zoned schools: Hopewell Elementary School (math 69% / reading 60%, grade B, #147 of 1,410 statewide, top 11%, 679 students, 50% FRL); Trinity Middle School (math 36% / reading 45%, grade F, #215 of 475 statewide, top 46%, 518 students, 64% FRL); Wheatmore High School (math 67% / reading 57%, grade B-, #184 of 535 statewide, top 37%, 677 students, 44% FRL) — zoned schools at 53% FRL track the district average.
- Zoned-school proficiency averages 56% at this address vs 43% district-wide (+13 pts) — the actual schools serving this property are materially stronger than the Randolph County School System average implies; a family-tenant draw the district grade alone would hide.
- Market conditions: 119 active listings in the ZIP; 789 units permitted in Randolph County in 2024 (168 in 5+ unit buildings).
Forward outlook
- Local home prices are declining (-3.0%/yr); year-one equity from $933 of loan paydown is wiped out by about $4k of value loss. Plan a longer hold.
- Randolph County population projected to shrink 10% by 2050 — rents likely to lag national; underwrite the cash flow, not the appreciation.
- At projected returns (-3.0% appreciation + 3.0% rent growth), your $38k cash investment doubles in ~10 years — after that, you're playing with house money.
Negotiation context
- It's been on market 65 days — a 6% lower offer ($127k) is reasonable based on typical stale-listing flexibility.
- Current owner paid $12k; list at $135k implies a 979% gain — meaningful room to come down on a strong offer.
Risks & watch-outs
- Climate carrying-cost: extreme-heat days projected 6→15/yr by 2055 (HVAC capex compounding) — expect insurance premiums to compound above CPI over the hold.
Questions for the listing agent
- It's been on market 65 days. Have you received any prior offers? Is the seller open to a 6% concession, seller financing, or rate buy-down credit?
- Why hasn't it sold? Are there any deal-killer items the seller is aware of (foundation, flood, title, zoning, code violations)?
- Is there a deadline driving the sale (1031 exchange, divorce, estate, relocation)? That informs how much negotiation room exists.
- Schools are D-rated, which usually means shorter tenancies and higher turnover. Who's the typical renter profile here, and what's been the actual vacancy rate?
- What's the average days-on-market for RENTAL listings here right now (not sales)? A rising rental-DOM trend means longer vacancies and softer asking-rent achievability than the comps imply.
- What's the recent tenant-quality profile in this submarket — average credit score on applications, eviction rate, late-payment / NSF rate, and stable-employment percentage? A property-management company in the area should have these aggregated.
- How much new for-sale + rental construction is in the pipeline within 1–3 miles? Heavy new supply typically softens prices + rents 12–24 months out; constrained supply supports both.
Investment metrics
- 1% rule
- 1.09% ✓
- Cap rate
- 9.57%
- Cash-on-cash
- 11.69%
- DSCR
- 1.52
- GRM
- 7.7
CMA / ARV
No comps found within radius.
Projected returns pro-forma
-3.0% appreciation · 3.0% rent growth · sell at horizon
- IRR
- 1.0%
- Equity multiple
- 1.04×
- Total profit
- $1,505
- Equity at exit
- $20,114
- IRR
- 10.6%
- Equity multiple
- 1.83×
- Total profit
- $31,216
- Equity at exit
- $11,664
Cash invested: $37,772 (down + closing). Projections, not guarantees.
Landlord ↔ Tenant lean methodology
- Overall (STATE)
- 85 Strongly Landlord-Friendly
- State North Carolina
- 85 Strongly Landlord-Friendly · R+3
- County
- — inherits STATE
- City
- — inherits STATE
ZIP-level market 27370
- Home prices YoY
- -9.9%
- Active inventory
- 119
- Price-to-rent
- 7.7×
Monthly cashflow live
- Estimated rent
- $1,466 medium interval (Pro) →
- Mortgage (P&I)
- −$707
- Tax from tax record
- −$27 /mo · $324/yr
- Insurance
- −$56
- HOA
- −$0
- Vacancy / Maint / Mgmt
- −$308
- Net cashflow
- $368
Break-even live
Sensitivity live
| Price | -10% $444 | -5% $406 | +0% $368 | +5% $330 | +10% $291 |
|---|---|---|---|---|---|
| Rent | -10% $252 | -5% $310 | +0% $368 | +5% $426 | +10% $484 |
| Rate | -1.0pp $436 | -0.5pp $402 | base $368 | +0.5pp $333 | +1.0pp $297 |
UW: 25.0% down · 7.5% · 30yr · 1.5% tax · 5.0% vac · 8.0% maint · 8.0% mgmt
Financing live
Cash to close
- Down payment
- $33,725
- Closing costs
- $4,047
- Reserves months
- —
- Total cash needed
- —
Loan-product check · same deal, 3 products live
Conventional
25% down · 7.5% · 30yr
- Down + closing
- —
- Monthly P&I
- —
- Monthly cashflow
- —
- DSCR
- —
- Eligible?
- —
Personal DTI + credit; lowest rate.
DSCR
20% down · 8.5% · 30yr
- Down + closing
- —
- Monthly P&I
- —
- Monthly cashflow
- —
- DSCR
- —
- Eligible?
- —
No personal income docs; deal must DSCR.
Hard money
10% down · 12.0% · 12mo
- Down + closing
- —
- Monthly P&I
- —
- Monthly cashflow
- —
- DSCR
- —
- Eligible?
- —
Short-term bridge; refi at stabilization.
Listing history 19 events
-
2026-06-21days on market $134,900 Active 65 DOM
-
2026-06-18days on market $134,900 Active 62 DOM
-
2026-06-17days on market $134,900 Active 61 DOM
-
2026-06-16days on market $134,900 Active 60 DOM
-
2026-06-15days on market $134,900 Active 59 DOM
-
2026-06-14days on market $134,900 Active 57 DOM
-
2026-06-10days on market $134,900 Active 54 DOM
-
2026-06-09days on market $134,900 Active 53 DOM
-
2026-06-08days on market $134,900 Active 52 DOM
-
2026-06-07days on market $134,900 Active 51 DOM
-
2026-06-05days on market $134,900 Active 48 DOM
-
2026-06-03days on market $134,900 Active 47 DOM
-
2026-06-02days on market $134,900 Active 46 DOM
-
2026-06-01days on market $134,900 Active 45 DOM
-
2026-05-31days on market $134,900 Active 44 DOM
-
2026-05-31days on market $134,900 Active 43 DOM
-
2026-05-04price $134,900
-
2026-04-17$139,900 Active
-
2021-04-12soldstatus $12,500
ⓘ Source: listings_history table (triggers on properties + properties_extension) + one-shot
backfill from property_details.listing_events for pre-trigger history.
Tax reassessment forecast NC · Resets to sale price
- Current annual tax
- $324 · $27/mo
- Projected year-2 tax
- $1,106 · $92/mo
- Expected delta
- +$782/yr (+$65/mo · 241.7%)
ⓘ Screening estimate from a state-policy table — verify with the county assessor before closing.
Climate risk First Street
- Flood 1/10 Low FEMA zone X (unshaded) · 0% chance over 30 yrs
- Wildfire 3/10 Moderate
- Heat 5/10 Major 6 d/yr ≥103°F today · 15 d/yr by 30 yrs out
- Wind 4/10 Moderate 16% chance of damaging wind over 30 yrs
- Air quality 2/10 Low 1 unhealthy d/yr today · 1 by 30 yrs out
Nearby sold comps map
Loading sold comps map…
Walkable amenities ~0.75 mi
Loading nearby amenities…
Taxation est. · year 1
- Rental income
- $17,597
- − Mortgage interest
- −$7,556
- − Property taxes
- −$324
- − Insurance
- −$674
- − Repairs & maintenance
- −$1,408
- − Management
- −$1,408
- − Depreciation
- −$3,924
- Taxable income
- $2,303
- Est. tax owed @ 24.0%
- −$553
- After-tax cash flow
- $3,862/yr
For passive investors: Depreciation is non-cash, so a rental often shows a tax loss while cash-flowing — sheltering income. Rental losses are passive: they offset passive income freely, and up to $25,000/yr can offset ordinary (W-2) income if you actively participate and your MAGI is under $100k (phasing out to $0 by $150k); unused losses carry forward. On sale, claimed depreciation is recaptured at up to 25%, and gains may owe capital-gains tax (a 1031 exchange can defer both). Figures are a year-1 estimate at your 24.0% rate — not tax advice; consult a CPA.
Schools (NCES district)
- District
- Randolph County School System
- NCES district ID
- 3703780
- Math proficiency
- 43% ▲ 1.00%
- Reading proficiency
- 43% ▲ 2.00%
- Median HH income
- $43,490
- Composite
- 36.37/100
- National rank
- #4686
- State rank
- #94 of 178 in NC
Livability — Trinity
- Score
- 69/100
- State rank
- #161
- US rank
- #8823
Category grades
Schools grade is shown separately in the Schools card above.
Census & demographics
- Population (ZIP)
- 15,223
Population outlook (Randolph County) Hauer SSP2
- Today (2025)
- 142,640 people
- By 2030
- 140,911 · -1.2%
- By 2040
- 135,692 · -4.9%
- By 2050
- 128,575 · -9.9%
- By 2075
- 111,507 · -21.8%
- By 2100
- 93,376 · -34.5%
Race, ethnicity, and origin ACS 2023
- Neighborhood character
- Predominantly White (89%)
- Race & ethnicity
- White 89% Hispanic / Latino 5% Two or more races 3% Black 2% Asian 1%
- Hispanic origin (detail)
- Mexican 3% Puerto Rican 2%
- Common ancestry
- Serbian 5% Slovak 5% Iranian 3%
- Foreign-born
- 1% · Canada
- Languages at home
- 96% English-only · Spanish 3% Tagalog/Filipino 1%
Political lean MEDSL · Randolph
- 2024 margin
- Solid R (+57.2) · D 21.0% · R 78.3%
- 2008→2024 swing
- -15.0pp toward R · 2008: -42.3pp · 2024: -57.2pp
- All cycles
- 2024: R+57.2 2020: R+56.3 2016: R+56.7 2012: R+50.2 2008: R+42.3
Not yet ingested
- Civics
- —
Market trends
- HPI YoY
- ▼ -26.61%
- Current HPI
- 242.2984
- Rent YoY
- —
- Metro
- —
- State GDP YoY
- ▲ 3.28%
- F500 in state
- 26
Industry mix (Fortune 500 HQ in NC)
| Industry | F500 HQs | Revenue |
|---|---|---|
| Financial Services | 2 | $213B |
|
||
| Retail | 2 | $95B |
|
||
| Industrial Conglomerate | 1 | $38B |
|
||
| Metals / Steel | 1 | $35B |
|
||
| Utilities | 1 | $30B |
|
||
| Industrial Machinery | 1 | $19B |
|
||
Price history
+979.2% since first listed3 events — show timeline
- 2026-05-04 Price Changed $134,900 Triad MLS
- 2026-04-17 Listed $139,900 Triad MLS
- 2021-04-12 Sold (Public Records) $12,500 Public Records
Property tax history
+9.2%/yrLatest (2025): $324 · +1.5% YoY. Source: county tax records.
Cash-flow waterfall
monthlySold comps — $/sqft
last 12 mo · ≤1 miLoading sold comps…