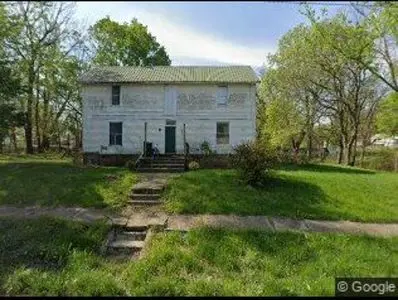
203 Snoddy St · Armstrong, MO
Flood risk 1/10 · Minimal
- FEMA flood zone
- X (unshaded)
- Chance of flooding over 30 yrs
- 0.0%
- Est. flood insurance / yr
- $507 – $1,088
Fire risk 3/10 · Minor
- Est. fire insurance / yr
- $1,054 – $1,958
Heat risk 3/10 · Minor
- Hot days now (above 106°F)
- 7 days/yr
- Hot days in 30 yrs
- 17 days/yr
Wind risk 2/10 · Minimal
- Chance of severe wind over 30 yrs
- —
Air-quality risk 1/10 · Minimal
- Unhealthy air days now
- 0 days/yr
- Unhealthy air days in 30 yrs
- 0 days/yr
Risk factors via First Street. Map © Google.
Why this score? — see what drove the B grade
The composite is a weighted blend of 9 inputs, each scored 0–100. Each bar is that input's sub-score; the figure is the points it added to the 100-point composite (weight × sub-score).
- Cash flow +30.0/30.0
- 1% rule +10.0/10.0
- DSCR +10.0/10.0
- ARV discount +7.5/15.0
- Appreciation +5.0/10.0
- Schools +2.8/10.0
- Livability +2.7/5.0
- Rent growth +2.5/5.0
- Condition / age +2.5/5.0
$29,500
🖨 Deal sheet 📄 Offer letter ✓ Due diligence
Listing remarks MLS
Built in 1880, this 2-story home offers over 1,600 sq ft and sits on 1.14 acres with mature shade trees and a root cellar. Property is in hoarder condition and has been vacant for nearly 2 years, requiring substantial cleanup and renovation. Ideal opportunity for investors or buyers with vision who can see the potential beyond the current condition. Features include a metal roof, central heat and air (estimated installed around 2010), and mostly level-appearing floors. Back porch has soft flooring reportedly caused by a past washing machine leak. Strong odors and dried pet waste are present -- masks recommended during showings. Priced accordingly and selling as-is. Cash or conventional financing only. No government-backed loans.
Key facts
- Metal roof
- Central heat and air
- Root cellar
Tags
Property features AI
Exterior
- Parking: No garage
- Utilities: Public water
- Home design: Single-family residence; Residential property
- Construction: Metal roof; Brick/mortar foundation
- Exterior features: Paved road access; 1.14-acre lot (approx.)
Interior
- Bathrooms: 1 full bathroom; 1 half bathroom
- Heating & cooling: Central air conditioning; Natural gas forced-air heating
- Interior features: Fireplace in the family room and living room; Crawl space basement
Neighborhood map
What this means for you Summary
Snapshot
- This is a 2-bed/1.5-bath other listed at $30k.
Deal economics
- At list price, monthly cash flow is $619 ($7k/yr) — positive.
- The deal already cash-flows at list — no discount required.
- Meets the 1% rule at list price ($1k rent vs $30k).
Location & tenants
- Location reads 54/100 on livability (#798 in MO) — a working-class tenant base; expect higher turnover. Strengths: cost of living A+, housing A+; Watch: crime F, amenities F, commute F.
- Fayette R-III (town): math 27% / reading 40% proficiency, ranked #238 of 324 in MO (top 74%) — families likely to look elsewhere, expect single-tenant / working-renter base with shorter leases.
- Zoned schools: Fayette High (math 5% / reading 44%, grade F, #436 of 521 statewide, top 85%, 189 students, 39% FRL) — zoned schools at 39% FRL track the district average.
- Market conditions: 7 active listings in the ZIP; 9 units permitted in Howard County in 2024 (5 in 5+ unit buildings).
Forward outlook
- In year one you build about $1k of equity ($204 loan paydown + $885 appreciation (3.0% local appreciation)).
- Howard County population projected to shrink 6% by 2050 — rents likely to lag national; underwrite the cash flow, not the appreciation.
- At projected returns (3.0% appreciation + 3.0% rent growth), your $8k cash investment doubles in ~1 year — after that, you're playing with house money.
Negotiation context
- Only 3 days on market — expect competitive offers; lowballing is unlikely to land.
- 2 sale attempts with the ask held roughly flat each time — persistent listings suggest the price (not the market) is what's stuck; bring a comps-based counter.
Risks & watch-outs
- Watch-outs: built in 1880 — expect roof / HVAC / electrical / plumbing capex.
Questions for the listing agent
- Built in 1880 — when were the roof, HVAC, electrical panel, plumbing, and water heater last replaced?
- Is there a deadline driving the sale (1031 exchange, divorce, estate, relocation)? That informs how much negotiation room exists.
- Schools are F-rated, which usually means shorter tenancies and higher turnover. Who's the typical renter profile here, and what's been the actual vacancy rate?
- Crime grade is F in this area — have there been break-ins, vandalism, or insurance claims at this property in the last 3 years? What carrier currently insures it and at what premium?
- What's the average days-on-market for RENTAL listings here right now (not sales)? A rising rental-DOM trend means longer vacancies and softer asking-rent achievability than the comps imply.
- What's the recent tenant-quality profile in this submarket — average credit score on applications, eviction rate, late-payment / NSF rate, and stable-employment percentage? A property-management company in the area should have these aggregated.
- How much new for-sale + rental construction is in the pipeline within 1–3 miles? Heavy new supply typically softens prices + rents 12–24 months out; constrained supply supports both.
Investment metrics
- 1% rule
- 3.48% ✓
- Cap rate
- 31.47%
- Cash-on-cash
- 89.92%
- DSCR
- 5.00
- GRM
- 2.4
CMA / ARV
No comps found within radius.
Projected returns pro-forma
3.0% appreciation · 3.0% rent growth · sell at horizon
- IRR
- 94.2%
- Equity multiple
- 6.20×
- Total profit
- $42,982
- Equity at exit
- $13,264
- IRR
- 93.8%
- Equity multiple
- 12.84×
- Total profit
- $97,783
- Equity at exit
- $20,442
Cash invested: $8,260 (down + closing). Projections, not guarantees.
Landlord ↔ Tenant lean methodology
- Overall (STATE)
- 81 Strongly Landlord-Friendly
- State Missouri
- 81 Strongly Landlord-Friendly · R+10
- County
- — inherits STATE
- City
- — inherits STATE
ZIP-level market 65230
- Active inventory
- 7
- Price-to-rent
- 2.4×
Monthly cashflow live
- Estimated rent
- $1,027 medium interval (Pro) →
- Mortgage (P&I)
- −$155
- Tax from tax record
- −$25 /mo · $306/yr
- Insurance
- −$12
- HOA
- −$0
- Vacancy / Maint / Mgmt
- −$216
- Net cashflow
- $619
Break-even live
UW: 25.0% down · 7.5% · 30yr · 1.5% tax · 5.0% vac · 8.0% maint · 8.0% mgmt
Financing live
Cash to close
- Down payment
- $7,375
- Closing costs
- $885
- Reserves months
- —
- Total cash needed
- —
Loan-product check · same deal, 3 products live
Conventional
25% down · 7.5% · 30yr
- Down + closing
- —
- Monthly P&I
- —
- Monthly cashflow
- —
- DSCR
- —
- Eligible?
- —
Personal DTI + credit; lowest rate.
DSCR
20% down · 8.5% · 30yr
- Down + closing
- —
- Monthly P&I
- —
- Monthly cashflow
- —
- DSCR
- —
- Eligible?
- —
No personal income docs; deal must DSCR.
Hard money
10% down · 12.0% · 12mo
- Down + closing
- —
- Monthly P&I
- —
- Monthly cashflow
- —
- DSCR
- —
- Eligible?
- —
Short-term bridge; refi at stabilization.
Listing history 1 events
-
2026-05-12$60,000 Active 187-char remark
ⓘ Source: listings_history table (triggers on properties + properties_extension) + one-shot
backfill from property_details.listing_events for pre-trigger history.
Tax reassessment forecast MO · Resets to sale price
- Current annual tax
- $306 · $25/mo
- Projected year-2 tax
- $306 · $25/mo
- Expected delta
- $0/yr ($0/mo · 0.0%)
ⓘ Screening estimate from a state-policy table — verify with the county assessor before closing.
Climate risk First Street
- Flood 1/10 Low FEMA zone X (unshaded) · 0% chance over 30 yrs
- Wildfire 3/10 Moderate
- Heat 3/10 Moderate 7 d/yr ≥106°F today · 17 d/yr by 30 yrs out
- Wind 2/10 Low
- Air quality 1/10 Low 0 unhealthy d/yr today · 0 by 30 yrs out
Nearby sold comps map
Loading sold comps map…
Walkable amenities ~0.75 mi
Loading nearby amenities…
Taxation est. · year 1
- Rental income
- $12,325
- − Mortgage interest
- −$1,652
- − Property taxes
- −$306
- − Insurance
- −$148
- − Repairs & maintenance
- −$986
- − Management
- −$986
- − Depreciation
- −$858
- Taxable income
- $7,389
- Est. tax owed @ 24.0%
- −$1,773
- After-tax cash flow
- $5,654/yr
For passive investors: Depreciation is non-cash, so a rental often shows a tax loss while cash-flowing — sheltering income. Rental losses are passive: they offset passive income freely, and up to $25,000/yr can offset ordinary (W-2) income if you actively participate and your MAGI is under $100k (phasing out to $0 by $150k); unused losses carry forward. On sale, claimed depreciation is recaptured at up to 25%, and gains may owe capital-gains tax (a 1031 exchange can defer both). Figures are a year-1 estimate at your 24.0% rate — not tax advice; consult a CPA.
Schools (NCES district)
- District
- Fayette R-III
- NCES district ID
- 2911990
- Math proficiency
- 27% ▼ -18.00%
- Reading proficiency
- 40% ▼ -13.00%
- Median HH income
- $42,178
- Composite
- 28.31/100
- National rank
- #6784
- State rank
- #238 of 324 in MO
Livability — Armstrong
- Score
- 54/100
- State rank
- #798
- US rank
- #24126
Category grades
Schools grade is shown separately in the Schools card above.
Census & demographics
- Census place
- Armstrong, MO
- Population (ZIP)
- 521
Population outlook (Howard County) Hauer SSP2
- Today (2025)
- 10,041 people
- By 2030
- 9,994 · -0.5%
- By 2040
- 9,780 · -2.6%
- By 2050
- 9,482 · -5.6%
- By 2075
- 9,009 · -10.3%
- By 2100
- 8,332 · -17.0%
Race, ethnicity, and origin ACS 2023
- Neighborhood character
- Predominantly White (90%)
- Race & ethnicity
- White 90% Two or more races 7% Black 3%
- Common ancestry
- Lithuanian 2% Serbian 2% Iranian 1%
Political lean MEDSL · Howard
- 2024 margin
- Solid R (+44.3) · D 27.1% · R 71.3% · Other 1.6%
- 2008→2024 swing
- -30.4pp toward R · 2008: -13.8pp · 2024: -44.3pp
- All cycles
- 2024: R+44.3 2020: R+42.0 2016: R+41.2 2012: R+26.5 2008: R+13.8
Not yet ingested
- Civics
- —
Market trends
- HPI YoY
- —
- Current HPI
- —
- Rent YoY
- —
- Metro
- —
- State GDP YoY
- ▲ 1.84%
- F500 in state
- 20
Industry mix (Fortune 500 HQ in MO)
| Industry | F500 HQs | Revenue |
|---|---|---|
| Healthcare | 1 | $163B |
|
||
| Insurance | 1 | $21B |
|
||
| Industrial Technology | 1 | $17B |
|
||
| Retail | 1 | $16B |
|
||
| Industrial Distribution | 1 | $10B |
|
||
| Utilities | 1 | $9B |
|
||
Price history
+0.0% since first listed7 events — show timeline
- 2026-06-17 Delisted — CBORMLS
- 2026-06-16 Sold (MLS) — RCBR
- 2026-06-16 Sold (MLS) — CBORMLS
- 2026-05-30 Pending — RCBR
- 2026-05-30 Pending — CBORMLS
- 2026-05-26 Listed $29,500 RCBR
- 2026-05-26 Listed $29,500 CBORMLS
Property tax history
-0.2%/yrLatest (2025): $306 · -0.3% YoY. Source: county tax records.
Cash-flow waterfall
monthlySold comps — $/sqft
last 12 mo · ≤1 miLoading sold comps…