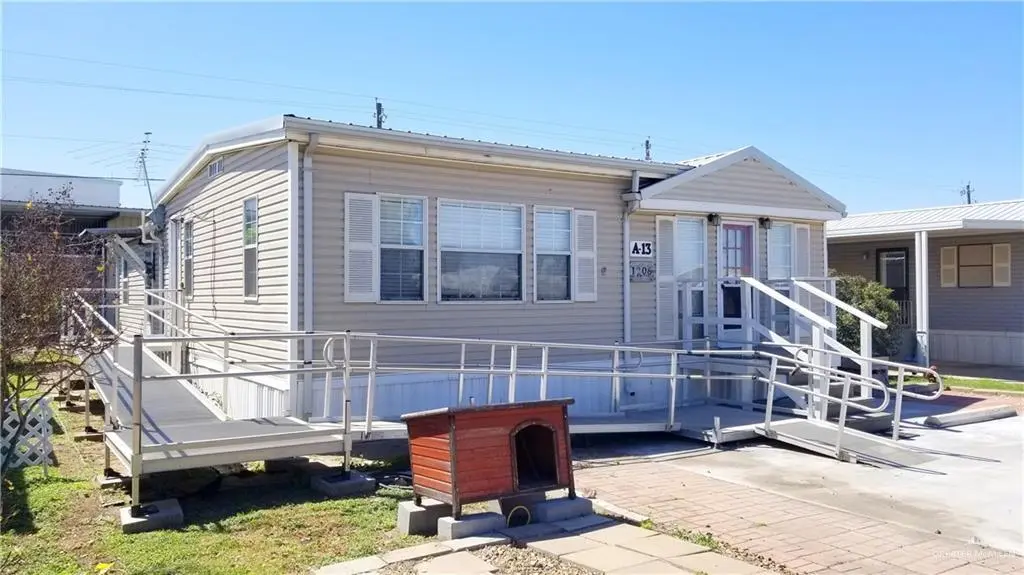
1306 Luther Ln · Mission, TX
Flood risk 6/10 · Moderate
- FEMA flood zone
- A
- Chance of flooding over 30 yrs
- 0.75%
- Est. flood insurance / yr
- $1,009 – $1,996
Fire risk 3/10 · Minor
- Est. fire insurance / yr
- $1,222 – $2,270
Heat risk 9/10 · Severe
- Hot days now (above 111°F)
- 7 days/yr
- Hot days in 30 yrs
- 22 days/yr
Wind risk 8/10 · Major
- Chance of severe wind over 30 yrs
- 94.0%
Air-quality risk 2/10 · Minimal
- Unhealthy air days now
- 1 days/yr
- Unhealthy air days in 30 yrs
- 2 days/yr
Risk factors via First Street. Map © Google.
Why this score? — see what drove the B- grade
The composite is a weighted blend of 9 inputs, each scored 0–100. Each bar is that input's sub-score; the figure is the points it added to the 100-point composite (weight × sub-score).
- Cash flow +30.0/30.0
- 1% rule +10.0/10.0
- DSCR +10.0/10.0
- ARV discount +6.1/15.0
- Livability +3.8/5.0
- Rent growth +2.7/5.0
- Condition / age +2.5/5.0
- Schools +1.7/10.0
- Appreciation +0.0/10.0
$69,000
🖨 Deal sheet 📄 Offer letter ✓ Due diligence
Listing remarks MLS
This spacious mobile home offers a wide-open living area with warmth and character to the space. Semi-furnished for your convenience, it includes a washer and dryer for added functionality. The home features large bedrooms and numerous windows that fill the interior with abundant natural sunlight. A durable aluminum ramp extends from the living room side door to the front of the property, ensuring easy access. Modern updates include LED lighting, sealed windows and doors, and a newly installed smart thermostat for energy efficiency. Residents can enjoy nearby amenities, include a heated pool, two activity centers, shuffleboard courts, and an array of planned activities. Situated within minutes of major shopping areas, Mission Hospital, banks, and a major expressway, this home offers both comfort and accessibility in an ideal location.
Key facts
- Sealed windows
- Led lighting
- Aluminum ramp
Tags
Neighborhood map
What this means for you Summary
Snapshot
- This is a 3-bed/1.0-bath manufactured listed at $69k.
Deal economics
- At list price, monthly cash flow is $172 ($2k/yr) — positive.
- The deal already cash-flows at list — no discount required.
- Meets the 1% rule at list price ($1k rent vs $69k).
- Recommended offer: $65k (6.0% below list) — sets the bar for market timing.
- Cap rate 11.5% vs local median 3.5% in Mission — top-decile yield for the area; either an underpriced asset or a hidden risk that comps aren't pricing in. Stress-test before assuming the spread holds.
Location & tenants
- Location reads 75/100 on livability (#148 in TX, #4,155 nationally) — a middle-class / working-renter tenant base. Strengths: cost of living A+, housing A+, health & safety A+; Watch: schools C-, amenities F, commute F.
- Mission CISD (urban): math 15% / reading 28% proficiency, ranked #775 of 826 in TX (top 94%) — low school quality limits family demand, transient renter base, plan for 1-2y turnover; 78% free/reduced lunch — lower-income household profile, screen leases tightly.
- Market conditions: Rents flat; 852 active listings in the ZIP; 19 comparable units currently listed for rent nearby; rentals lingering (median 44d on market — plan ~5-8 weeks vacancy on turnover, expect pricing pressure); 58% of comp listings sitting > 30 days — soft ceiling on asking rent; 7,378 units permitted in Hidalgo County in 2024 (641 in 5+ unit buildings).
Forward outlook
- Local home prices are declining (-3.0%/yr); year-one equity from $477 of loan paydown is wiped out by about $2k of value loss. Plan a longer hold.
- Hidalgo County population projected at +28% by 2050 — long-run rental-demand tailwind backs the buy-and-hold thesis.
Negotiation context
- It's been on market 77 days — a 6% lower offer ($65k) is reasonable based on typical stale-listing flexibility.
- 4 sale attempts with the ask held roughly flat each time — persistent listings suggest the price (not the market) is what's stuck; bring a comps-based counter.
Risks & watch-outs
- Watch-outs: flood insurance adds $125/mo.
- Climate carrying-cost: in FEMA flood zone A (mandatory federal flood insurance); severe wind risk, 94% chance of damaging wind over 30y; extreme-heat days projected 7→22/yr by 2055 (HVAC capex compounding) — expect insurance premiums to compound above CPI over the hold.
Questions for the listing agent
- It's been on market 77 days. Have you received any prior offers? Is the seller open to a 6% concession, seller financing, or rate buy-down credit?
- What's the actual annual flood-insurance premium (NFIP or private), and is the property in a SFHA with mandatory coverage?
- What does the HOA fee cover, when was the last increase, and are there any pending special assessments or reserve-fund shortfalls?
- Why hasn't it sold? Are there any deal-killer items the seller is aware of (foundation, flood, title, zoning, code violations)?
- Is there a deadline driving the sale (1031 exchange, divorce, estate, relocation)? That informs how much negotiation room exists.
- What's the average days-on-market for RENTAL listings here right now (not sales)? A rising rental-DOM trend means longer vacancies and softer asking-rent achievability than the comps imply.
- What's the recent tenant-quality profile in this submarket — average credit score on applications, eviction rate, late-payment / NSF rate, and stable-employment percentage? A property-management company in the area should have these aggregated.
- How much new for-sale + rental construction is in the pipeline within 1–3 miles? Heavy new supply typically softens prices + rents 12–24 months out; constrained supply supports both.
Investment metrics
- 1% rule
- 1.55% ✓
- Cap rate
- 11.46%
- Cash-on-cash
- 18.45%
- DSCR
- 1.82
- GRM
- 5.4
CMA / ARV
- ARV (median comp)
- $66,848
- List price
- $69,000
- Delta
- 3.22%
- Verdict
- FAIR
- Comps
- 8 within 1.0 mi
Show comp detail 3 sales within ~0.75 mi
| Address | Dist | Beds/Ba | Sqft | Sold | Price | $/sf | Match |
|---|---|---|---|---|---|---|---|
| 1300 Luther Ln | 0.02mi | 2/1.0 (-1) | 920 (+7%) | 15mo | $50,000 | $54 | 70 |
| 510 Santa Cruz Dr | 0.62mi | 2/2.0 (-1) | 900 (+5%) | 10mo | $160,000 | $178 | 46 |
| 415 Saturn St | 0.70mi | 2/2.0 (-1) | 896 (+4%) | 17mo | $79,000 | $88 | 37 |
Match score weights: distance 35% · size 25% · config 20% · recency 20%. Top-matched comps best support the ARV.
Projected returns pro-forma
-3.0% appreciation · 0.93% rent growth · sell at horizon
- IRR
- -3.2%
- Equity multiple
- 0.88×
- Total profit
- $-2,284
- Equity at exit
- $10,288
- IRR
- 3.3%
- Equity multiple
- 1.21×
- Total profit
- $4,072
- Equity at exit
- $5,966
Cash invested: $19,320 (down + closing). Projections, not guarantees.
Landlord ↔ Tenant lean methodology
- Overall (STATE)
- 87 Strongly Landlord-Friendly
- State Texas
- 87 Strongly Landlord-Friendly · R+5
- County
- — inherits STATE
- City
- — inherits STATE
ZIP-level market 78572
- Home prices YoY
- -22.9%
- Rents YoY
- 0.9%
- Active inventory
- 852
- Price-to-rent
- 5.4×
Monthly cashflow live
- Estimated rent
- $1,068 high interval (Pro) →
- Mortgage (P&I)
- −$362
- Tax from tax record
- −$123 /mo · $1,476/yr
- Insurance
- −$29
- Flood insurance flood zone
- −$125 /mo · $1,502/yr
- HOA
- −$33
- Vacancy / Maint / Mgmt
- −$224
- Net cashflow
- $172
Break-even live
UW: 25.0% down · 7.5% · 30yr · 1.5% tax · 5.0% vac · 8.0% maint · 8.0% mgmt
Financing live
Cash to close
- Down payment
- $17,250
- Closing costs
- $2,070
- Reserves months
- —
- Total cash needed
- —
Loan-product check · same deal, 3 products live
Conventional
25% down · 7.5% · 30yr
- Down + closing
- —
- Monthly P&I
- —
- Monthly cashflow
- —
- DSCR
- —
- Eligible?
- —
Personal DTI + credit; lowest rate.
DSCR
20% down · 8.5% · 30yr
- Down + closing
- —
- Monthly P&I
- —
- Monthly cashflow
- —
- DSCR
- —
- Eligible?
- —
No personal income docs; deal must DSCR.
Hard money
10% down · 12.0% · 12mo
- Down + closing
- —
- Monthly P&I
- —
- Monthly cashflow
- —
- DSCR
- —
- Eligible?
- —
Short-term bridge; refi at stabilization.
Rent comps 19 comps
| Address | Beds | Baths | Sqft | Rent | $/sqft | DOM | Units | Dist |
|---|---|---|---|---|---|---|---|---|
| 405 Cory Dr Mission, TX | 2.0 | 1.0 | 832 | $750 | $0.90 | 21d | 1 | 0.10mi |
| 402 Cory Dr Unit B-10 Mission, TX | 2.0 | 1.0 | 714 | $750 | $1.05 | 43d | 1 | 0.12mi |
| 106 S Bryan Rd Unit 13 Mission, TX | 2.0 | 1.0 | 720 | $725 | $1.01 | 43d | 1 | 0.19mi |
| 103 Yosemite Dr Unit 2 Mission, TX | 3.0 | 2.0 | 1116 | $1,375 | $1.23 | 43d | 1 | 0.39mi |
| 816 Travis St Mission, TX | 1.0–2.0 | 1.0–2.0 | 952 | $1,215 | $1.28 | 43d | 12 | 0.52mi |
| 900 Travis St Mission, TX | 1.0–2.0 | 1.0–2.0 | 1053 | $1,250 | $1.19 | 14d | 1 | 0.59mi |
| 600 San Antonio Ave Unit 7 Mission, TX | 2.0 | 2.0 | 900 | $880 | $0.98 | 43d | 1 | 1.12mi |
| 2105 Selena St Mission, TX | 3.0 | 2.0 | 1100 | $1,500 | $1.36 | 14d | 1 | 1.13mi |
| 606 San Antonio Ave Unit 4 Mission, TX | 2.0 | 2.0 | 900 | $895 | $0.99 | 21d | 1 | 1.13mi |
| 606 San Antonio Ave Unit 606-4 Mission, TX | 2.0 | 1.0 | 900 | $850 | $0.94 | 43d | 1 | 1.13mi |
| 606 San Antonio Ave Unit 1 Mission, TX | 2.0 | 2.0 | 900 | $850 | $0.94 | 23d | 1 | 1.13mi |
| 2002 E 1st St Mission, TX | 3.0 | 2.0 | 1017 | $1,300 | $1.28 | 43d | 1 | 1.18mi |
| 523 Perkins Ave Mission, TX | 2.0 | 2.0 | 1050 | $950 | $0.90 | 43d | 1 | 1.19mi |
| 104 Sunflower St Unit 5 Mission, TX | 3.0 | 2.0 | 950 | $1,550 | $1.63 | 14d | 1 | 1.25mi |
| 2008 Selena St Unit 3 Mission, TX | 3.0 | 2.0 | 1092 | $1,450 | $1.33 | 43d | 1 | 1.29mi |
| 2112 Cassandra St Unit 2 Mission, TX | 3.0 | 2.0 | 1050 | $1,395 | $1.33 | 43d | 1 | 1.32mi |
| 1006 Fairway Dr Mission, TX | 2.0 | 2.0 | 1072 | $1,100 | $1.03 | 43d | 1 | 1.41mi |
| 7102 N 56th Ln Unit 1 Mission, TX | 2.0 | 2.0 | 980 | $1,075 | $1.10 | 21d | 1 | 1.44mi |
| 2113 Amy St Mission, TX | 2.0 | 2.0 | 784 | $875 | $1.12 | 23d | 1 | 1.47mi |
HOA detail
- Monthly dues
- $33 · $396/yr
- Likely covers
- pool
Listing history 23 events
-
2026-06-18days on market $69,000 Active 77 DOM
-
2026-06-17days on market $69,000 Active 76 DOM
-
2026-06-16days on market $69,000 Active 75 DOM
-
2026-06-15days on market $69,000 Active 74 DOM
-
2026-06-14days on market $69,000 Active 72 DOM
-
2026-06-10days on market $69,000 Active 69 DOM
-
2026-06-09days on market $69,000 Active 68 DOM
-
2026-06-08days on market $69,000 Active 67 DOM
-
2026-06-07days on market $69,000 Active 66 DOM
-
2026-06-03days on market $69,000 Active 62 DOM
-
2026-06-02days on market $69,000 Active 61 DOM
-
2026-06-01days on market $69,000 Active 60 DOM
-
2026-05-31days on market $69,000 Active 59 DOM
-
2026-05-31days on market $69,000 Active 58 DOM
-
2026-04-01$72,000 Active 846-char remark
Show marketing remark (846 chars)
This spacious mobile home offers a wide-open living area with warmth and character to the space. Semi-furnished for your convenience, it includes a washer and dryer for added functionality. The home features large bedrooms and numerous windows that fill the interior with abundant natural sunlight. A durable aluminum ramp extends from the living room side door to the front of the property, ensuring easy access. Modern updates include LED lighting, sealed windows and doors, and a newly installed smart thermostat for energy efficiency. Residents can enjoy nearby amenities, include a heated pool, two activity centers, shuffleboard courts, and an array of planned activities. Situated within minutes of major shopping areas, Mission Hospital, banks, and a major expressway, this home offers both comfort and accessibility in an ideal location.
-
2025-12-16price $72,000
-
2025-08-01status Active
-
2025-06-09status Pending
-
2025-04-18status Active
-
2025-04-07status Pending
-
2025-03-28historical Option
-
2025-03-21$76,000 Active
-
2003-02-14soldstatus
ⓘ Source: listings_history table (triggers on properties + properties_extension) + one-shot
backfill from property_details.listing_events for pre-trigger history.
Tax reassessment forecast TX · Resets to sale price
- Current annual tax
- $1,476 · $123/mo
- Projected year-2 tax
- $1,476 · $123/mo
- Expected delta
- $0/yr ($0/mo · 0.0%)
ⓘ Screening estimate from a state-policy table — verify with the county assessor before closing.
Climate risk First Street
- Flood 6/10 Major FEMA zone A · 75% chance over 30 yrs
- Wildfire 3/10 Moderate
- Heat 9/10 Extreme 7 d/yr ≥111°F today · 22 d/yr by 30 yrs out
- Wind 8/10 Severe 94% chance of damaging wind over 30 yrs
- Air quality 2/10 Low 1 unhealthy d/yr today · 2 by 30 yrs out
Nearby sold comps map
Loading sold comps map…
Walkable amenities ~0.75 mi
Loading nearby amenities…
Taxation est. · year 1
- Rental income
- $12,814
- − Mortgage interest
- −$3,865
- − Property taxes
- −$1,476
- − Insurance
- −$1,847
- − Repairs & maintenance
- −$1,025
- − Management
- −$1,025
- − HOA
- −$396
- − Depreciation
- −$2,007
- Taxable income
- $1,172
- Est. tax owed @ 24.0%
- −$281
- After-tax cash flow
- $1,780/yr
For passive investors: Depreciation is non-cash, so a rental often shows a tax loss while cash-flowing — sheltering income. Rental losses are passive: they offset passive income freely, and up to $25,000/yr can offset ordinary (W-2) income if you actively participate and your MAGI is under $100k (phasing out to $0 by $150k); unused losses carry forward. On sale, claimed depreciation is recaptured at up to 25%, and gains may owe capital-gains tax (a 1031 exchange can defer both). Figures are a year-1 estimate at your 24.0% rate — not tax advice; consult a CPA.
Schools (NCES district)
- District
- Mission CISD
- NCES district ID
- 4831040
- Math proficiency
- 15% ▼ -35.00%
- Reading proficiency
- 28% ▼ -15.00%
- Median HH income
- $32,855
- Composite
- 17.47/100
- National rank
- #9061
- State rank
- #775 of 826 in TX
Livability — Mission
- Score
- 75/100
- State rank
- #148
- US rank
- #4155
Category grades
Schools grade is shown separately in the Schools card above.
Census & demographics
- Census place
- Mission, TX
- County
- Hidalgo County · 623,128 people
- City population
- 78,024
- Metro
- McAllen-Edinburg-Mission, TX
- Population (ZIP)
- 78,024
- Household income
- $54,298
- Rent vs Own
- Severe rent burden
- 1714.0
Population outlook (Hidalgo County) Hauer SSP2
- Today (2025)
- 955,232 people
- By 2030
- 1,009,774 · +5.7%
- By 2040
- 1,120,332 · +17.3%
- By 2050
- 1,225,036 · +28.2%
- By 2075
- 1,439,189 · +50.7%
- By 2100
- 1,533,429 · +60.5%
Race, ethnicity, and origin ACS 2023
- Neighborhood character
- Predominantly Hispanic (85%)
- Race & ethnicity
- Hispanic / Latino 85% Two or more races 47% White 12% Asian 2%
- Hispanic origin (detail)
- Mexican 80%
- Common ancestry
- Slovak 1% Portuguese 0%
- Foreign-born
- 28% · Canada, South Korea
- Languages at home
- 22% English-only · Spanish 76%
Political lean MEDSL · Hidalgo
- 2024 margin
- Toss-up / Even · D 48.1% · R 51.0%
- 2008→2024 swing
- -41.6pp toward R · 2008: 38.7pp · 2024: -2.9pp
- All cycles
- 2024: R+2.9 2020: D+17.1 2016: D+40.5 2012: D+41.8 2008: D+38.7
Not yet ingested
- Civics
- —
Market trends
- HPI YoY
- ▼ -62.35%
- Current HPI
- 209.3573
- Rent YoY
- ▲ 0.93%
- Metro
- McAllen-Edinburg-Mission, TX
- State GDP YoY
- ▲ 3.95%
- F500 in state
- 110
Industry mix (Fortune 500 HQ in TX)
| Industry | F500 HQs | Revenue |
|---|---|---|
| Energy | 16 | $1,198B |
|
||
| Technology | 5 | $198B |
|
||
| Engineering / Construction | 4 | $72B |
|
||
| Energy Services | 3 | $60B |
|
||
| Utilities | 3 | $41B |
|
||
| Healthcare | 2 | $330B |
|
||
Price history
-5.3% since first listed9 events — show timeline
- 2026-04-01 Listed $72,000 MCALLENMLS
- 2025-12-16 Price Changed $72,000 MCALLENMLS
- 2025-08-01 Relisted — MCALLENMLS
- 2025-06-09 Pending — MCALLENMLS
- 2025-04-18 Relisted — MCALLENMLS
- 2025-04-07 Pending — MCALLENMLS
- 2025-03-28 Contingent — MCALLENMLS
- 2025-03-21 Listed $76,000 MCALLENMLS
- 2003-02-14 Sold (Public Records) — Public Records
Property tax history
+5.8%/yrLatest (2025): $1,476 · +4.5% YoY. Source: county tax records.
Cash-flow waterfall
monthlySold comps — $/sqft
last 12 mo · ≤1 miLoading sold comps…