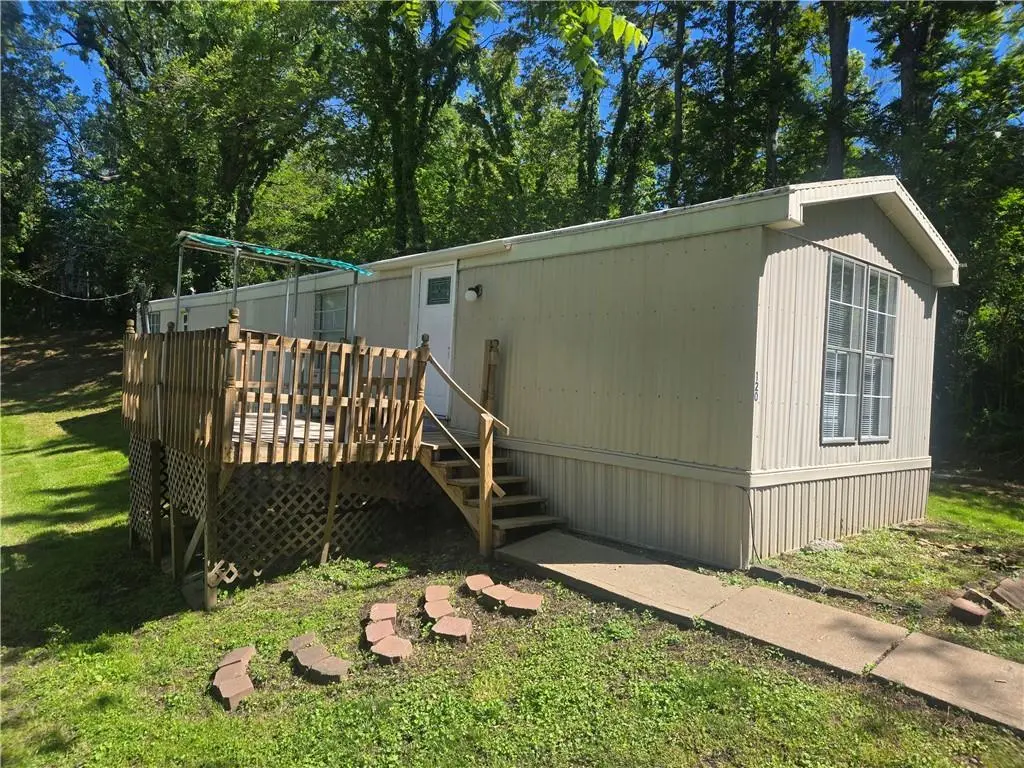
120 Maple Ln · Napoleon, MO
Flood risk 1/10 · Minimal
- FEMA flood zone
- X (unshaded)
- Chance of flooding over 30 yrs
- 0.0%
- Est. flood insurance / yr
- $473 – $860
Fire risk 1/10 · Minimal
- Est. fire insurance / yr
- $1,054 – $1,958
Heat risk 4/10 · Minor
- Hot days now (above 107°F)
- 7 days/yr
- Hot days in 30 yrs
- 15 days/yr
Wind risk 2/10 · Minimal
- Chance of severe wind over 30 yrs
- —
Air-quality risk 3/10 · Minor
- Unhealthy air days now
- 2 days/yr
- Unhealthy air days in 30 yrs
- 4 days/yr
Risk factors via First Street. Map © Google.
Why this score? — see what drove the B grade
The composite is a weighted blend of 9 inputs, each scored 0–100. Each bar is that input's sub-score; the figure is the points it added to the 100-point composite (weight × sub-score).
- Cash flow +30.0/30.0
- DSCR +10.0/10.0
- Appreciation +7.8/10.0
- ARV discount +7.5/15.0
- 1% rule +7.4/10.0
- Livability +3.4/5.0
- Schools +3.3/10.0
- Rent growth +2.5/5.0
- Condition / age +2.5/5.0
$100,000
🖨 Deal sheet 📄 Offer letter ✓ Due diligence
Listing remarks
Price reduced to $100,000. Home appraised for $115,000 in 2025. Wake up each day to peaceful views of the Missouri River. The river can be seen from the front deck and the large picture window in the living room. This charming 2 bedroom, 1.5 bath mobile home located in the quiet community of Napoleon, Missouri, just 42 minutes east of downtown Kansas City. The home was renovated in 2020 with all new permanent fixtures, new flooring, great room with stainless steel sink, modern range and refrigerator, new countertop, full sized washer and dryer, new walk-in shower, and new toilets. A new shed was added to the property in 2023. Perfectly suited for simple living, this home offers a low mai
Key facts
- Outdoor recreation
- Convenient access
- Community park
Tags
Property features AI
Finance
- Other: Approximately 858 living area (per public records)
- HOA & community: No association fees; Inside city limits
Exterior
- Parking: Off-street parking
- Utilities: Public water (PWS Dist); Septic tank
- Home design: Single-family residence (mobile/manufactured); Ranch-style floor plan; North-facing
- Construction: Metal siding; Metal/other roof
- Exterior features: Deck; Shed(s); City lot; Gravel road access (public maintenance); Not in a flood plain
Interior
- Kitchen: Microwave; Electric range; Refrigerator; Dishwasher
- Bedrooms: 2 bedrooms
- Flooring: Luxury vinyl
- Bathrooms: 1 full bath; 1 half bath
- Heating & cooling: Propane heating; Electric cooling
- Interior features: Eat-in kitchen; Crawl space basement
- Laundry & utility: Washer; Dryer; Main-level laundry
Neighborhood map
What this means for you Summary
Snapshot
- This is a 2-bed/1.5-bath manufactured listed at $100k.
Deal economics
- At list price, monthly cash flow is $385 ($5k/yr) — positive.
- The deal already cash-flows at list — no discount required.
- Meets the 1% rule at list price ($1k rent vs $100k).
- Recommended offer: $97k (3.0% below list) — sets the bar for market timing.
Location & tenants
- Location reads 67/100 on livability (#222 in MO) — a middle-class / working-renter tenant base. Strengths: crime A+, cost of living A+, housing A+; Watch: amenities F, commute F, health & safety F.
- Wellington-Napoleon R-IX (rural): math 34% / reading 42% proficiency, ranked #162 of 324 in MO (top 50%) — families likely to look elsewhere, expect single-tenant / working-renter base with shorter leases.
- Zoned schools: Wellington-Napoleon Elem. (math 27% / reading 42%, grade F, #676 of 1,115 statewide, top 66%, 174 students, 30% FRL); Wellington-Napoleon High (math 37% / reading 42%, grade F, #247 of 521 statewide, top 55%, 208 students, 18% FRL) — zoned schools at 24% FRL track the district average.
- Market conditions: 3 active listings in the ZIP; 112 units permitted in Lafayette County in 2024 (0 in 5+ unit buildings).
Forward outlook
- In year one you build about $6k of equity ($691 loan paydown + $6k appreciation (5.7% local appreciation)).
- Lafayette County population projected at -21% by 2050 — secular population decline; favor cash flow + early exit over multi-decade hold.
- At projected returns (5.7% appreciation + 3.0% rent growth), your $28k cash investment doubles in ~3 years — after that, you're playing with house money.
- By year 6, paydown + projected appreciation supports a ~$34k cash-out refi (75% LTV) — recoverable capital for the next deal without selling this one.
Negotiation context
- It's been on market 43 days — a 3% lower offer ($97k) is reasonable based on typical stale-listing flexibility.
Questions for the listing agent
- It's been on market 43 days. Have you received any prior offers? Is the seller open to a 3% concession, seller financing, or rate buy-down credit?
- Is there a deadline driving the sale (1031 exchange, divorce, estate, relocation)? That informs how much negotiation room exists.
- Schools are F-rated, which usually means shorter tenancies and higher turnover. Who's the typical renter profile here, and what's been the actual vacancy rate?
- What's the average days-on-market for RENTAL listings here right now (not sales)? A rising rental-DOM trend means longer vacancies and softer asking-rent achievability than the comps imply.
- What's the recent tenant-quality profile in this submarket — average credit score on applications, eviction rate, late-payment / NSF rate, and stable-employment percentage? A property-management company in the area should have these aggregated.
- How much new for-sale + rental construction is in the pipeline within 1–3 miles? Heavy new supply typically softens prices + rents 12–24 months out; constrained supply supports both.
Investment metrics
- 1% rule
- 1.24% ✓
- Cap rate
- 10.91%
- Cash-on-cash
- 16.49%
- DSCR
- 1.73
- GRM
- 6.7
CMA / ARV
- ARV (median comp)
- $290,799
- List price
- $100,000
- Delta
- -65.61%
- Verdict
- UNDERPRICED
- Comps
- 2 within 1.0 mi
Projected returns pro-forma
5.66% appreciation · 3.0% rent growth · sell at horizon
- IRR
- 28.4%
- Equity multiple
- 2.83×
- Total profit
- $51,352
- Equity at exit
- $60,754
- IRR
- 26.8%
- Equity multiple
- 5.73×
- Total profit
- $132,343
- Equity at exit
- $108,397
Cash invested: $28,000 (down + closing). Projections, not guarantees.
Landlord ↔ Tenant lean methodology
- Overall (STATE)
- 81 Strongly Landlord-Friendly
- State Missouri
- 81 Strongly Landlord-Friendly · R+10
- County
- — inherits STATE
- City
- — inherits STATE
ZIP-level market 64074
- Home prices YoY
- 2.2%
- Active inventory
- 3
- Price-to-rent
- 6.7×
Monthly cashflow live
- Estimated rent
- $1,238 medium interval (Pro) →
- Mortgage (P&I)
- −$524
- Tax from tax record
- −$27 /mo · $325/yr
- Insurance
- −$42
- HOA
- −$0
- Vacancy / Maint / Mgmt
- −$260
- Net cashflow
- $385
Break-even live
UW: 25.0% down · 7.5% · 30yr · 1.5% tax · 5.0% vac · 8.0% maint · 8.0% mgmt
Financing live
Cash to close
- Down payment
- $25,000
- Closing costs
- $3,000
- Reserves months
- —
- Total cash needed
- —
Loan-product check · same deal, 3 products live
Conventional
25% down · 7.5% · 30yr
- Down + closing
- —
- Monthly P&I
- —
- Monthly cashflow
- —
- DSCR
- —
- Eligible?
- —
Personal DTI + credit; lowest rate.
DSCR
20% down · 8.5% · 30yr
- Down + closing
- —
- Monthly P&I
- —
- Monthly cashflow
- —
- DSCR
- —
- Eligible?
- —
No personal income docs; deal must DSCR.
Hard money
10% down · 12.0% · 12mo
- Down + closing
- —
- Monthly P&I
- —
- Monthly cashflow
- —
- DSCR
- —
- Eligible?
- —
Short-term bridge; refi at stabilization.
Listing history 16 events
-
2026-06-18days on market $100,000 Active 43 DOM
-
2026-06-17days on market $100,000 Active 42 DOM
-
2026-06-16days on market $100,000 Active 41 DOM
-
2026-06-15remarks 699-char remark
-
2026-06-15days on market $100,000 Active 40 DOM
-
2026-06-13days on market $100,000 Active 38 DOM
-
2026-06-13days on market $100,000 Active 37 DOM
-
2026-06-09days on market $100,000 Active 34 DOM
-
2026-06-08days on market $100,000 Active 33 DOM
-
2026-06-07days on market $100,000 Active 32 DOM
-
2026-06-03days on market $100,000 Active 28 DOM
-
2026-06-02days on market $100,000 Active 27 DOM
-
2026-06-01days on market $100,000 Active 26 DOM
-
2026-05-31days on market $100,000 Active 25 DOM
-
2026-05-06$120,000 Active 784-char remark
-
2020-03-19soldstatus
ⓘ Source: listings_history table (triggers on properties + properties_extension) + one-shot
backfill from property_details.listing_events for pre-trigger history.
Tax reassessment forecast MO · Resets to sale price
- Current annual tax
- $325 · $27/mo
- Projected year-2 tax
- $970 · $81/mo
- Expected delta
- +$645/yr (+$54/mo · 198.3%)
ⓘ Screening estimate from a state-policy table — verify with the county assessor before closing.
Climate risk First Street
- Flood 1/10 Low FEMA zone X (unshaded) · 0% chance over 30 yrs
- Wildfire 1/10 Low
- Heat 4/10 Moderate 7 d/yr ≥107°F today · 15 d/yr by 30 yrs out
- Wind 2/10 Low
- Air quality 3/10 Moderate 2 unhealthy d/yr today · 4 by 30 yrs out
Nearby sold comps map
Loading sold comps map…
Walkable amenities ~0.75 mi
Loading nearby amenities…
Taxation est. · year 1
- Rental income
- $14,855
- − Mortgage interest
- −$5,602
- − Property taxes
- −$325
- − Insurance
- −$500
- − Repairs & maintenance
- −$1,188
- − Management
- −$1,188
- − Depreciation
- −$2,909
- Taxable income
- $3,142
- Est. tax owed @ 24.0%
- −$754
- After-tax cash flow
- $3,863/yr
For passive investors: Depreciation is non-cash, so a rental often shows a tax loss while cash-flowing — sheltering income. Rental losses are passive: they offset passive income freely, and up to $25,000/yr can offset ordinary (W-2) income if you actively participate and your MAGI is under $100k (phasing out to $0 by $150k); unused losses carry forward. On sale, claimed depreciation is recaptured at up to 25%, and gains may owe capital-gains tax (a 1031 exchange can defer both). Figures are a year-1 estimate at your 24.0% rate — not tax advice; consult a CPA.
Schools (NCES district)
- District
- Wellington-Napoleon R-IX
- NCES district ID
- 2931560
- Math proficiency
- 34% ▼ -1.00%
- Reading proficiency
- 42% ▼ -8.00%
- Median HH income
- $54,108
- Composite
- 33.2/100
- National rank
- #5534
- State rank
- #162 of 324 in MO
Livability — Napoleon
- Score
- 67/100
- State rank
- #222
- US rank
- #10893
Category grades
Schools grade is shown separately in the Schools card above.
Census & demographics
- Census place
- Napoleon, MO
- Population (ZIP)
- 498
Population outlook (Lafayette County) Hauer SSP2
- Today (2025)
- 31,118 people
- By 2030
- 29,993 · -3.6%
- By 2040
- 27,436 · -11.8%
- By 2050
- 24,585 · -21.0%
- By 2075
- 18,426 · -40.8%
- By 2100
- 12,897 · -58.6%
Race, ethnicity, and origin ACS 2023
- Neighborhood character
- Predominantly White (96%)
- Race & ethnicity
- White 96% Two or more races 3% Hispanic / Latino 1% Native American 1%
- Common ancestry
- Lithuanian 1% Polish 1% Serbian 1%
Political lean MEDSL · Lafayette
- 2024 margin
- Solid R (+48.9) · D 24.9% · R 73.8% · Other 1.3%
- 2008→2024 swing
- -33.6pp toward R · 2008: -15.3pp · 2024: -48.9pp
- All cycles
- 2024: R+48.9 2020: R+45.7 2016: R+43.8 2012: R+26.3 2008: R+15.3
Not yet ingested
- Civics
- —
Market trends
- HPI YoY
- ▲ 5.66%
- Current HPI
- 258.22
- Rent YoY
- —
- Metro
- —
- State GDP YoY
- ▲ 1.84%
- F500 in state
- 20
Industry mix (Fortune 500 HQ in MO)
| Industry | F500 HQs | Revenue |
|---|---|---|
| Healthcare | 1 | $163B |
|
||
| Insurance | 1 | $21B |
|
||
| Industrial Technology | 1 | $17B |
|
||
| Retail | 1 | $16B |
|
||
| Industrial Distribution | 1 | $10B |
|
||
| Utilities | 1 | $9B |
|
||
Price history
-16.7% since first listed3 events — show timeline
- 2026-05-24 Price Changed $100,000 Heartland MLS as Distributed by MLS Grid
- 2026-05-06 Listed $120,000 Heartland MLS as Distributed by MLS Grid
- 2020-03-19 Sold (Public Records) — Public Records
Property tax history
+1.4%/yrLatest (2025): $325 · +2.9% YoY. Source: county tax records.
Cash-flow waterfall
monthlySold comps — $/sqft
last 12 mo · ≤1 miLoading sold comps…