 Multi-family
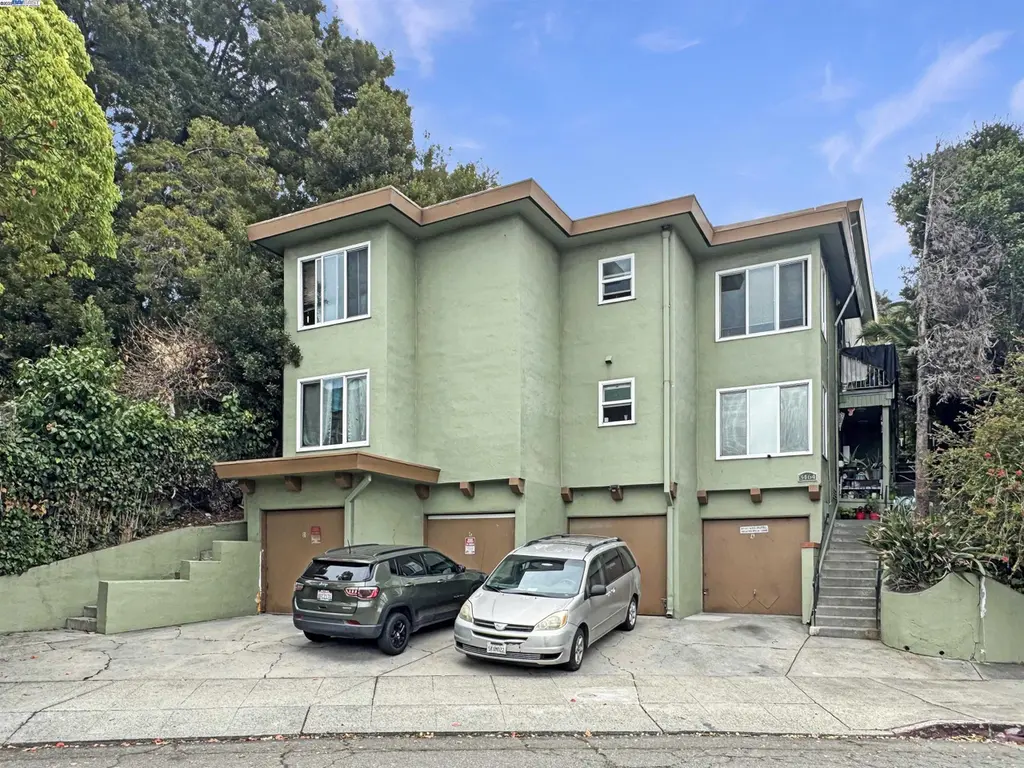
3464 Champion St · Oakland, CA
Flood risk 1/10 · Minimal
- FEMA flood zone
- X (unshaded)
- Chance of flooding over 30 yrs
- 0.0%
- Est. flood insurance / yr
- $507 – $1,088
Fire risk 1/10 · Minimal
- Est. fire insurance / yr
- $659 – $1,223
Heat risk 3/10 · Minor
- Hot days now (above 84°F)
- 7 days/yr
- Hot days in 30 yrs
- 15 days/yr
Wind risk 1/10 · Minimal
- Chance of severe wind over 30 yrs
- —
Air-quality risk 8/10 · Major
- Unhealthy air days now
- 14 days/yr
- Unhealthy air days in 30 yrs
- 14 days/yr
Risk factors via First Street. Map © Google.
Why this score? — see what drove the C grade
The composite is a weighted blend of 9 inputs, each scored 0–100. Each bar is that input's sub-score; the figure is the points it added to the 100-point composite (weight × sub-score).
- Cash flow +21.0/30.0
- ARV discount +11.6/15.0
- DSCR +6.7/10.0
- 1% rule +6.3/10.0
- Rent growth +3.9/5.0
- Livability +3.6/5.0
- Schools +3.0/10.0
- Condition / age +2.5/5.0
- Appreciation +0.0/10.0
$999,999
🖨 Deal sheet 📄 Offer letter ✓ Due diligence
Multi-family units
County records classify this as Multi-Family (5+ Unit). Listing-text estimate: 1 unit. estimate disagrees with records
5+ unit building — per-unit beds/baths from public records are typically unavailable; the breakdown below (if shown) is an estimate from the listing text.
Listing remarks MLS
Qualified investors are extended the opportunity to acquire 3464 Champion Street, located in Oakland, CA. This well-maintained apartment community was built in 1956 and includes 4 one bedroom / one bathroom units and 2 two bedroom one bathroom units with 1 non-conforming studio/storage unit. Recent Capital improvements include completion of the seismic retrofit for the soft story. Each unit is individually metered for gas and electric.
Key facts
- Seismic retrofit
- Individually metered
- 6,000 sq ft lot
Tags
Neighborhood map
What this means for you Summary
Snapshot
- This is a 8-bed/6.0-bath multifamily listed at $1000k.
Deal economics
- At list price, monthly cash flow is $1k ($17k/yr) — positive.
- The deal already cash-flows at list — no discount required.
- Meets the 1% rule at list price ($11k rent vs $1000k).
- Recommended offer: $880k (12.0% below list) — sets the bar for market timing.
- Cap rate 8.0% vs local median 2.4% in Oakland — top-decile yield for the area; either an underpriced asset or a hidden risk that comps aren't pricing in. Stress-test before assuming the spread holds.
Location & tenants
- Location reads 71/100 on livability (#224 in CA) — a middle-class / working-renter tenant base. Strengths: amenities A+, commute A+, employment A+; Watch: schools C-, crime F, cost of living F.
- Oakland Unified (urban): math 27% / reading 33% proficiency, ranked #1,007 of 1,400 in CA (top 72%) — families likely to look elsewhere, expect single-tenant / working-renter base with shorter leases; 68% free/reduced lunch — lower-income household profile, screen leases tightly.
- Market conditions: Rents rising fast (+5.5%/yr); 111 active listings in the ZIP; high-income renter base; 1,742 units permitted in Alameda County in 2024 (856 in 5+ unit buildings).
- At $11,328/mo this rent would consume 111% of the median local household income ($122k/yr) (locally 1018% of renters already pay >50% of income on rent) — very limited rent-growth headroom before tenants either downsize or default.
Forward outlook
- Local home prices are declining (-3.0%/yr); year-one equity from $7k of loan paydown is wiped out by about $30k of value loss. Plan a longer hold.
- Alameda County population projected at +34% by 2050 — long-run rental-demand tailwind backs the buy-and-hold thesis.
- At projected returns (-3.0% appreciation + 5.5% rent growth), your $280k cash investment doubles in ~10 years — after that, you're playing with house money.
Negotiation context
- It's been on market 251 days — a 12% lower offer ($880k) is reasonable based on typical stale-listing flexibility.
- 5 sale attempts since 26y ago with the ask held roughly flat each time — persistent listings suggest the price (not the market) is what's stuck; bring a comps-based counter.
Risks & watch-outs
- Watch-outs: built in 1956 — expect roof / HVAC / electrical / plumbing capex.
Questions for the listing agent
- It's been on market 251 days. Have you received any prior offers? Is the seller open to a 12% concession, seller financing, or rate buy-down credit?
- Built in 1956 — when were the roof, HVAC, electrical panel, plumbing, and water heater last replaced?
- Why hasn't it sold? Are there any deal-killer items the seller is aware of (foundation, flood, title, zoning, code violations)?
- Is there a deadline driving the sale (1031 exchange, divorce, estate, relocation)? That informs how much negotiation room exists.
- Crime grade is F in this area — have there been break-ins, vandalism, or insurance claims at this property in the last 3 years? What carrier currently insures it and at what premium?
- What's the average days-on-market for RENTAL listings here right now (not sales)? A rising rental-DOM trend means longer vacancies and softer asking-rent achievability than the comps imply.
- What's the recent tenant-quality profile in this submarket — average credit score on applications, eviction rate, late-payment / NSF rate, and stable-employment percentage? A property-management company in the area should have these aggregated.
- How much new apartment / multifamily construction is in the pipeline within 1–3 miles? Heavy new supply (>2% of stock underway) typically softens rents 12–24 months out; light construction supports rent growth.
Investment metrics
- 1% rule
- 1.13% ✓
- Cap rate
- 7.98%
- Cash-on-cash
- 6.01%
- DSCR
- 1.27
- GRM
- 7.4
CMA / ARV
- ARV (median comp)
- $1,100,347
- List price
- $999,999
- Delta
- -9.12%
- Verdict
- FAIR
- Comps
- 20 within 1.0 mi
Show comp detail 3 sales within ~0.75 mi
| Address | Dist | Beds/Ba | Sqft | Sold | Price | $/sf | Match |
|---|---|---|---|---|---|---|---|
| 2849 Delaware St | 0.36mi | 8/5.0 | 4,506 (-11%) | 14mo | $1,005,000 | $223 | 49 |
| 3300 Brookdale Ave | 0.62mi | 9/— (+1) | 5,453 (+8%) | 6mo | $1,025,000 | $188 | 48 |
| 2924 Carmel St | 0.68mi | 9/5.0 (+1) | 4,530 (-10%) | 16mo | $1,775,000 | $392 | 29 |
Match score weights: distance 35% · size 25% · config 20% · recency 20%. Top-matched comps best support the ARV.
Projected returns pro-forma
-3.0% appreciation · 5.5% rent growth · sell at horizon
- IRR
- -4.0%
- Equity multiple
- 0.85×
- Total profit
- $-42,932
- Equity at exit
- $149,103
- IRR
- 8.6%
- Equity multiple
- 1.74×
- Total profit
- $206,087
- Equity at exit
- $86,462
Cash invested: $280,000 (down + closing). Projections, not guarantees.
Landlord ↔ Tenant lean methodology
- Overall (CITY)
- 0 Strongly Tenant-Friendly
- State California
- 18 Strongly Tenant-Friendly · D+13
- County
- — inherits STATE
- City Oakland
- 0 Strongly Tenant-Friendly · D+62
ZIP-level market 94602
- Rents YoY
- 5.5%
- Active inventory
- 111
- Price-to-rent
- 36.8×
Monthly cashflow live
- Estimated rent
- $11,328 high interval (Pro) →
- Mortgage (P&I)
- −$5,244
- Tax from tax record
- −$1,886 /mo · $22,627/yr
- Insurance
- −$417
- HOA
- −$0
- Vacancy / Maint / Mgmt
- −$2,379
- Net cashflow
- $1,403
Break-even live
5-unit breakdown (identical units grouped — click to expand)
| Units | Beds | Baths | Est. rent |
|---|---|---|---|
| 5× units | 1 | 1 | $11,330 |
| #1 | 1 | 1 | $2,266 |
| #2 | 1 | 1 | $2,266 |
| #3 | 1 | 1 | $2,266 |
| #4 | 1 | 1 | $2,266 |
| #5 | 1 | 1 | $2,266 |
| Total (5 units) | $11,328 | ||
UW: 25.0% down · 7.5% · 30yr · 1.5% tax · 5.0% vac · 8.0% maint · 8.0% mgmt
Financing live
Cash to close
- Down payment
- $250,000
- Closing costs
- $30,000
- Reserves months
- —
- Total cash needed
- —
Loan-product check · same deal, 3 products live
Conventional
25% down · 7.5% · 30yr
- Down + closing
- —
- Monthly P&I
- —
- Monthly cashflow
- —
- DSCR
- —
- Eligible?
- —
Personal DTI + credit; lowest rate.
DSCR
20% down · 8.5% · 30yr
- Down + closing
- —
- Monthly P&I
- —
- Monthly cashflow
- —
- DSCR
- —
- Eligible?
- —
No personal income docs; deal must DSCR.
Hard money
10% down · 12.0% · 12mo
- Down + closing
- —
- Monthly P&I
- —
- Monthly cashflow
- —
- DSCR
- —
- Eligible?
- —
Short-term bridge; refi at stabilization.
Listing history 31 events
-
2026-06-18days on market $999,999 Active 251 DOM
-
2026-06-17days on market $999,999 Active 250 DOM
-
2026-06-16days on market $999,999 Active 249 DOM
-
2026-06-15days on market $999,999 Active 248 DOM
-
2026-06-13days on market $999,999 Active 246 DOM
-
2026-06-13days on market $999,999 Active 245 DOM
-
2026-06-09days on market $999,999 Active 242 DOM
-
2026-06-08days on market $999,999 Active 241 DOM
-
2026-06-07days on market $999,999 Active 240 DOM
-
2026-06-04days on market $999,999 Active 237 DOM
-
2026-06-03days on market $999,999 Active 236 DOM
-
2026-06-02days on market $999,999 Active 235 DOM
-
2026-06-01days on market $999,999 Active 234 DOM
-
2026-05-31days on market $999,999 Active 233 DOM
-
2025-11-15status Active 439-char remark
Show marketing remark (439 chars)
Qualified investors are extended the opportunity to acquire 3464 Champion Street, located in Oakland, CA. This well-maintained apartment community was built in 1956 and includes 4 one bedroom / one bathroom units and 2 two bedroom one bathroom units with 1 non-conforming studio/storage unit. Recent Capital improvements include completion of the seismic retrofit for the soft story. Each unit is individually metered for gas and electric.
-
2025-10-29historical 439-char remark
Show marketing remark (439 chars)
Qualified investors are extended the opportunity to acquire 3464 Champion Street, located in Oakland, CA. This well-maintained apartment community was built in 1956 and includes 4 one bedroom / one bathroom units and 2 two bedroom one bathroom units with 1 non-conforming studio/storage unit. Recent Capital improvements include completion of the seismic retrofit for the soft story. Each unit is individually metered for gas and electric.
-
2025-09-23status Pending 439-char remark
Show marketing remark (439 chars)
Qualified investors are extended the opportunity to acquire 3464 Champion Street, located in Oakland, CA. This well-maintained apartment community was built in 1956 and includes 4 one bedroom / one bathroom units and 2 two bedroom one bathroom units with 1 non-conforming studio/storage unit. Recent Capital improvements include completion of the seismic retrofit for the soft story. Each unit is individually metered for gas and electric.
-
2025-08-19$999,999 Active 439-char remark
Show marketing remark (439 chars)
Qualified investors are extended the opportunity to acquire 3464 Champion Street, located in Oakland, CA. This well-maintained apartment community was built in 1956 and includes 4 one bedroom / one bathroom units and 2 two bedroom one bathroom units with 1 non-conforming studio/storage unit. Recent Capital improvements include completion of the seismic retrofit for the soft story. Each unit is individually metered for gas and electric.
-
2022-04-02historical
-
2022-02-28price $1,595
-
2016-11-09soldstatus $1,130,000
-
2016-11-09soldstatus $1,130,000
-
2016-11-09soldstatus $1,130,000
-
2016-09-08$1,199,000
-
2016-09-08$1,199,000
-
2015-07-24historical
-
2015-07-24historical
-
2001-03-13soldstatus $450,000
-
2001-03-01soldstatus $450,000
-
2000-10-17historical
-
2000-08-16$460,000
ⓘ Source: listings_history table (triggers on properties + properties_extension) + one-shot
backfill from property_details.listing_events for pre-trigger history.
Tax reassessment forecast CA · Resets to sale price
- Current annual tax
- $22,627 · $1,886/mo
- Projected year-2 tax
- $22,627 · $1,886/mo
- Expected delta
- $0/yr ($0/mo · 0.0%)
ⓘ Screening estimate from a state-policy table — verify with the county assessor before closing.
Climate risk First Street
- Flood 1/10 Low FEMA zone X (unshaded) · 0% chance over 30 yrs
- Wildfire 1/10 Low
- Heat 3/10 Moderate 7 d/yr ≥84°F today · 15 d/yr by 30 yrs out
- Wind 1/10 Low
- Air quality 8/10 Severe 14 unhealthy d/yr today · 14 by 30 yrs out
Nearby sold comps map
Loading sold comps map…
Walkable amenities ~0.75 mi
Loading nearby amenities…
Taxation est. · year 1
- Rental income
- $135,936
- − Mortgage interest
- −$56,015
- − Property taxes
- −$22,627
- − Insurance
- −$5,000
- − Repairs & maintenance
- −$10,875
- − Management
- −$10,875
- − Depreciation
- −$29,091
- Taxable income
- $1,453
- Est. tax owed @ 24.0%
- −$349
- After-tax cash flow
- $16,485/yr
For passive investors: Depreciation is non-cash, so a rental often shows a tax loss while cash-flowing — sheltering income. Rental losses are passive: they offset passive income freely, and up to $25,000/yr can offset ordinary (W-2) income if you actively participate and your MAGI is under $100k (phasing out to $0 by $150k); unused losses carry forward. On sale, claimed depreciation is recaptured at up to 25%, and gains may owe capital-gains tax (a 1031 exchange can defer both). Figures are a year-1 estimate at your 24.0% rate — not tax advice; consult a CPA.
Schools (NCES district)
- District
- Oakland Unified
- NCES district ID
- 0628050
- Math proficiency
- 27% ▬ 0.00%
- Reading proficiency
- 33% ▬ 0.00%
- Median HH income
- $55,194
- Composite
- 29.52/100
- National rank
- #11769
- State rank
- #1007 of 1400 in CA
Livability — Oakland
- Score
- 71/100
- State rank
- #224
- US rank
- #7245
Category grades
Schools grade is shown separately in the Schools card above.
Census & demographics
- Census place
- Oakland, CA
- County
- Alameda County · 1,614,355 people
- City population
- 385,993
- Metro
- San Francisco-Oakland-Berkeley, CA
- Population (ZIP)
- 31,759
- Household income
- $122,263
- Rent vs Own
- Severe rent burden
- 1018.0
Population outlook (Alameda County) Hauer SSP2
- Today (2025)
- 1,928,884 people
- By 2030
- 2,069,146 · +7.3%
- By 2040
- 2,338,405 · +21.2%
- By 2050
- 2,586,608 · +34.1%
- By 2075
- 3,061,911 · +58.7%
- By 2100
- 3,234,133 · +67.7%
Race, ethnicity, and origin ACS 2023
- Neighborhood character
- Highly diverse neighborhood (Simpson 0.75)
- Race & ethnicity
- White 41% Hispanic / Latino 20% Asian 16% Black 15% Two or more races 11% Pacific Islander 1%
- Hispanic origin (detail)
- Mexican 11% Puerto Rican 2%
- Common ancestry
- Italian 3% Lithuanian 2% Romanian 1%
- Foreign-born
- 24% · Canada, China, Vietnam
- Languages at home
- 67% English-only · Spanish 14% Chinese 8% Other Asian/Pacific 2%
Political lean MEDSL · Alameda
- 2024 margin
- Solid D (+53.6) · D 74.6% · R 21.0% · Other 4.4%
- 2008→2024 swing
- -5.9pp toward R · 2008: 59.5pp · 2024: 53.6pp
- All cycles
- 2024: D+53.6 2020: D+62.5 2016: D+64.4 2012: D+59.8 2008: D+59.5
Not yet ingested
- Civics
- —
Market trends
- HPI YoY
- ▼ -1108.77%
- Current HPI
- 275.7267
- Rent YoY
- ▲ 5.50%
- Metro
- San Francisco-Oakland-Berkeley, CA
- State GDP YoY
- ▲ 3.21%
- F500 in state
- 116
Industry mix (Fortune 500 HQ in CA)
| Industry | F500 HQs | Revenue |
|---|---|---|
| Technology | 27 | $1,492B |
|
||
| Financial Services | 3 | $174B |
|
||
| Retail | 3 | $44B |
|
||
| Insurance | 3 | $26B |
|
||
| Media / Entertainment | 2 | $115B |
|
||
| Pharmaceuticals / Biotech | 2 | $62B |
|
||
Price history
+117.4% since first listed17 events — show timeline
- 2025-11-15 Relisted — bridgeMLS, Bay East AOR, or Contra Costa AOR
- 2025-10-29 Listing Removed — bridgeMLS, Bay East AOR, or Contra Costa AOR
- 2025-09-23 Pending — bridgeMLS, Bay East AOR, or Contra Costa AOR
- 2025-08-19 Listed $999,999 bridgeMLS, Bay East AOR, or Contra Costa AOR
- 2022-04-02 Listing Removed — bridgeMLS, Bay East AOR, or Contra Costa AOR
- 2022-02-28 Price Changed $1,595 RENT.
- 2016-11-09 Sold (Public Records) $1,130,000 Public Records
- 2016-11-09 Sold (MLS) $1,130,000 SDMLS
- 2016-11-09 Sold (MLS) $1,130,000 bridgeMLS, Bay East AOR, or Contra Costa AOR
- 2016-09-08 Listed $1,199,000 SDMLS
- 2016-09-08 Listed $1,199,000 bridgeMLS, Bay East AOR, or Contra Costa AOR
- 2015-07-24 Listing Removed — bridgeMLS, Bay East AOR, or Contra Costa AOR
- 2015-07-24 Listing Removed — bridgeMLS, Bay East AOR, or Contra Costa AOR
- 2001-03-13 Sold (MLS) $450,000 bridgeMLS, Bay East AOR, or Contra Costa AOR
- 2001-03-01 Sold (Public Records) $450,000 Public Records
- 2000-10-17 Listing Removed — bridgeMLS, Bay East AOR, or Contra Costa AOR
- 2000-08-16 Listed $460,000 bridgeMLS, Bay East AOR, or Contra Costa AOR
Property tax history
+5.2%/yrLatest (2025): $22,627 · +4.4% YoY. Source: county tax records.
Cash-flow waterfall
monthlySold comps — $/sqft
last 12 mo · ≤1 miLoading sold comps…