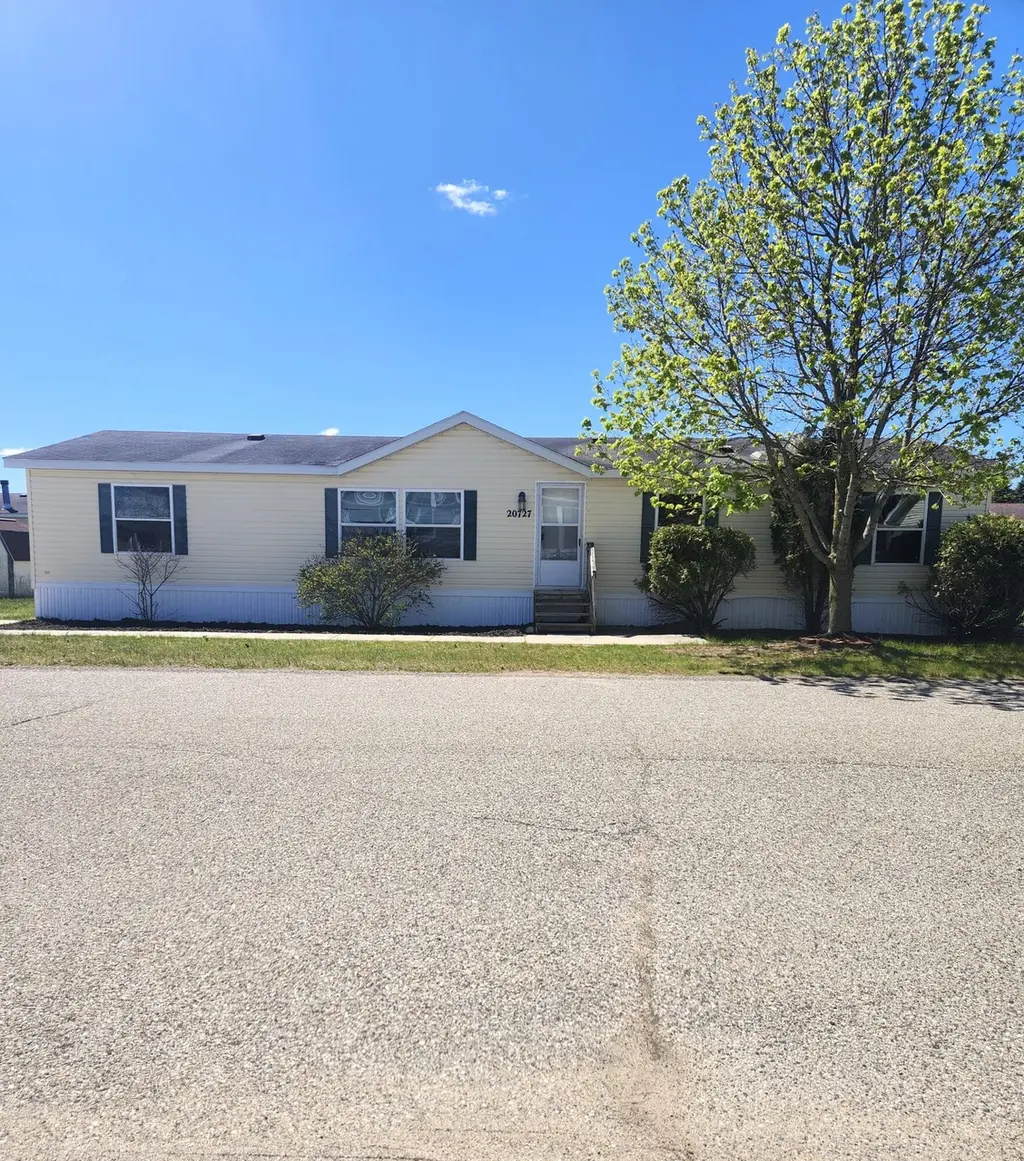
20727 Kalamazoo Rd #37 · Big Rapids, MI
Flood risk 1/10 · Minimal
- FEMA flood zone
- X (unshaded)
- Chance of flooding over 30 yrs
- 0.0%
- Est. flood insurance / yr
- $507 – $1,088
Fire risk 2/10 · Minimal
- Est. fire insurance / yr
- $784 – $1,456
Heat risk 2/10 · Minimal
- Hot days now (above 95°F)
- 7 days/yr
- Hot days in 30 yrs
- 15 days/yr
Wind risk 1/10 · Minimal
- Chance of severe wind over 30 yrs
- —
Air-quality risk 2/10 · Minimal
- Unhealthy air days now
- 1 days/yr
- Unhealthy air days in 30 yrs
- 1 days/yr
Risk factors via First Street. Map © Google.
Why this score? — see what drove the B- grade
The composite is a weighted blend of 9 inputs, each scored 0–100. Each bar is that input's sub-score; the figure is the points it added to the 100-point composite (weight × sub-score).
- Cash flow +23.9/30.0
- ARV discount +13.5/15.0
- 1% rule +10.0/10.0
- DSCR +7.7/10.0
- Livability +3.7/5.0
- Schools +3.6/10.0
- Rent growth +2.5/5.0
- Condition / age +2.2/5.0
- Appreciation +0.0/10.0
$60,000
🖨 Deal sheet 📄 Offer letter ✓ Due diligence
Listing remarks MLS
Country Manor Estates is now under new ownership and professional management! Looking for an affordable 3-bedroom, 2 full bath home? This welcoming community offers a variety of financing options to fit your needs. Enjoy clean, well-maintained grounds along with great amenities, including a playground, tennis, pickleball, and basketball court--perfect for families and active lifestyles. Lot rent is approximately $525/month + $110 for water, sewer and trash Please note: this is a mobile home community; no land is included in the sale. Buyer must complete park application and receive approval prior to closing. Buyers must pay a 6% sales tax and a $90.00 title transfer fee that goes to the Secretary of State Contact the listing agent today for more information or to schedule a tour!
Key facts
- Built 1998
Property features AI
Finance
- HOA & community: HOA with monthly fee of 525.00; Playground and tennis courts on site; HOA fee includes snow removal
Exterior
- Home design: Ranch-style home; Built in 1998
- Construction: Vinyl siding
- Exterior features: Public water
Interior
- Bathrooms: 2 full bathrooms
- Heating & cooling: Forced air heating
- Interior features: 8 total rooms; Slab basement
Neighborhood map
What this means for you Summary
Snapshot
- This is a 3-bed/2.0-bath manufactured listed at $60k. Condition is rated fair.
Deal economics
- At list price, monthly cash flow is $116 ($1k/yr) — positive.
- The deal already cash-flows at list — no discount required.
- Meets the 1% rule at list price ($1k rent vs $60k).
- Cap rate 8.6% vs local median 2.5% in Big Rapids — top-decile yield for the area; either an underpriced asset or a hidden risk that comps aren't pricing in. Stress-test before assuming the spread holds.
Location & tenants
- Location reads 73/100 on livability (#209 in MI) — a middle-class / working-renter tenant base. Strengths: cost of living A+, health & safety A+, housing A; Watch: amenities F, commute F, employment F.
- Big Rapids Public Schools (town): math 36% / reading 52% proficiency, ranked #176 of 540 in MI (top 33%) — families likely to look elsewhere, expect single-tenant / working-renter base with shorter leases.
- Market conditions: 191 active listings in the ZIP; 116 units permitted in Mecosta County in 2024 (0 in 5+ unit buildings).
Forward outlook
- Local home prices are declining (-3.0%/yr); year-one equity from $415 of loan paydown is wiped out by about $2k of value loss. Plan a longer hold.
- Mecosta County population projected to shrink 9% by 2050 — rents likely to lag national; underwrite the cash flow, not the appreciation.
Negotiation context
- Only 1 days on market — expect competitive offers; lowballing is unlikely to land.
- 3 sale attempts with the ask held roughly flat each time — persistent listings suggest the price (not the market) is what's stuck; bring a comps-based counter.
Risks & watch-outs
- Watch-outs: HOA is 39% of rent.
Questions for the listing agent
- Have any recent inspections been done? Can we get a copy of the seller's disclosures and any deferred-maintenance estimates?
- What does the HOA fee cover, when was the last increase, and are there any pending special assessments or reserve-fund shortfalls?
- Is there a deadline driving the sale (1031 exchange, divorce, estate, relocation)? That informs how much negotiation room exists.
- What's the average days-on-market for RENTAL listings here right now (not sales)? A rising rental-DOM trend means longer vacancies and softer asking-rent achievability than the comps imply.
- What's the recent tenant-quality profile in this submarket — average credit score on applications, eviction rate, late-payment / NSF rate, and stable-employment percentage? A property-management company in the area should have these aggregated.
- How much new for-sale + rental construction is in the pipeline within 1–3 miles? Heavy new supply typically softens prices + rents 12–24 months out; constrained supply supports both.
Investment metrics
- 1% rule
- 2.23% ✓
- Cap rate
- 8.62%
- Cash-on-cash
- 8.31%
- DSCR
- 1.37
- GRM
- 3.7
CMA / ARV
- ARV (on-the-fly)
- $69,312
- Comps found
- 4
Show comp detail 4 sales within ~0.75 mi
| Address | Dist | Beds/Ba | Sqft | Sold | Price | $/sf | Match |
|---|---|---|---|---|---|---|---|
| 20798 Saint Joseph Ave Lot 226 | 0.10mi | 3/2.0 | 1,216 (0%) | 1mo | $35,000 | $29 | 95 |
| 18365 Saint Joseph Dr #234 | 0.14mi | 3/2.0 | 1,216 (0%) | 1mo | $30,000 | $25 | 93 |
| 18336 St Joseph Ave #222 | 0.16mi | 3/2.0 | 1,216 (0%) | 6mo | $69,900 | $57 | 88 |
| 21269 19 Mile Rd | 0.67mi | 2/2.0 (-1) | 1,288 (+6%) | 8mo | $119,900 | $93 | 47 |
Match score weights: distance 35% · size 25% · config 20% · recency 20%. Top-matched comps best support the ARV.
Projected returns pro-forma
-3.0% appreciation · 3.0% rent growth · sell at horizon
- IRR
- -3.1%
- Equity multiple
- 0.88×
- Total profit
- $-1,973
- Equity at exit
- $8,946
- IRR
- 7.1%
- Equity multiple
- 1.55×
- Total profit
- $9,212
- Equity at exit
- $5,188
Cash invested: $16,800 (down + closing). Projections, not guarantees.
Landlord ↔ Tenant lean methodology
- Overall (STATE)
- 62 Landlord-Friendly
- State Michigan
- 62 Landlord-Friendly · EVEN
- County
- — inherits STATE
- City
- — inherits STATE
ZIP-level market 49307
- Active inventory
- 191
- Price-to-rent
- 3.7×
Monthly cashflow live
- Estimated rent
- $1,337 medium interval (Pro) →
- Mortgage (P&I)
- −$315
- Tax est. 1.5%
- −$75 /mo · $900/yr
- Insurance
- −$25
- HOA
- −$525
- Vacancy / Maint / Mgmt
- −$281
- Net cashflow
- $116
Break-even live
UW: 25.0% down · 7.5% · 30yr · 1.5% tax · 5.0% vac · 8.0% maint · 8.0% mgmt
Financing live
Cash to close
- Down payment
- $15,000
- Closing costs
- $1,800
- Reserves months
- —
- Total cash needed
- —
Loan-product check · same deal, 3 products live
Conventional
25% down · 7.5% · 30yr
- Down + closing
- —
- Monthly P&I
- —
- Monthly cashflow
- —
- DSCR
- —
- Eligible?
- —
Personal DTI + credit; lowest rate.
DSCR
20% down · 8.5% · 30yr
- Down + closing
- —
- Monthly P&I
- —
- Monthly cashflow
- —
- DSCR
- —
- Eligible?
- —
No personal income docs; deal must DSCR.
Hard money
10% down · 12.0% · 12mo
- Down + closing
- —
- Monthly P&I
- —
- Monthly cashflow
- —
- DSCR
- —
- Eligible?
- —
Short-term bridge; refi at stabilization.
HOA detail
- Monthly dues
- $525 · $6,300/yr
- Likely covers
- watersewertrashlandscaping
Listing history 2 events
-
2026-06-04remarks 699-char remark
-
2026-06-04$60,000 Pending 1 DOM
ⓘ Source: listings_history table (triggers on properties + properties_extension) + one-shot
backfill from property_details.listing_events for pre-trigger history.
Climate risk First Street
- Flood 1/10 Low FEMA zone X (unshaded) · 0% chance over 30 yrs
- Wildfire 2/10 Low
- Heat 2/10 Low 7 d/yr ≥95°F today · 15 d/yr by 30 yrs out
- Wind 1/10 Low
- Air quality 2/10 Low 1 unhealthy d/yr today · 1 by 30 yrs out
Nearby sold comps map
Loading sold comps map…
Walkable amenities ~0.75 mi
Loading nearby amenities…
Taxation est. · year 1
- Rental income
- $16,040
- − Mortgage interest
- −$3,361
- − Property taxes
- −$900
- − Insurance
- −$300
- − Repairs & maintenance
- −$1,283
- − Management
- −$1,283
- − HOA
- −$6,300
- − Depreciation
- −$1,745
- Taxable income
- $867
- Est. tax owed @ 24.0%
- −$208
- After-tax cash flow
- $1,187/yr
For passive investors: Depreciation is non-cash, so a rental often shows a tax loss while cash-flowing — sheltering income. Rental losses are passive: they offset passive income freely, and up to $25,000/yr can offset ordinary (W-2) income if you actively participate and your MAGI is under $100k (phasing out to $0 by $150k); unused losses carry forward. On sale, claimed depreciation is recaptured at up to 25%, and gains may owe capital-gains tax (a 1031 exchange can defer both). Figures are a year-1 estimate at your 24.0% rate — not tax advice; consult a CPA.
Condition & rehab AI · 2 photos
The home is in fair condition with some cosmetic repairs needed, such as painting and landscaping. These updates would significantly increase its resale and rental value.
Repairs flagged
- Minor Paint — The paint on the exterior shows some wear.
- Minor Landscaping — There is some overgrowth in the front yard that could be trimmed and maintained.
Value-add opportunities
- Both Paint the exterior — Painting the exterior will improve the home's curb appeal and increase its value.
- Both Trim and maintain landscaping — A well-maintained front yard can enhance the home's appearance and increase its value.
- Both Replace HVAC condensers — The HVAC condensers are visible in the satellite image and may need replacement to ensure the home is energy-efficient and comfortable.
Renovation cost estimate screening
| Repair item | Severity | Est. cost |
|---|---|---|
| Paint · The paint on the exterior shows some wear. | Minor | $500–3,000 |
| Landscaping · There is some overgrowth in the front yard that could be trimmed and maintained. | Minor | $500–3,000 |
| Total estimated repair cost · 2 items | $1,000–6,000 |
Value-add ROI direction
- Both Paint the exterior — Painting the exterior will improve the home's curb appeal and increase its value. ↑
- Both Trim and maintain landscaping — A well-maintained front yard can enhance the home's appearance and increase its value. ↑
- Both Replace HVAC condensers — The HVAC condensers are visible in the satellite image and may need replacement to ensure the home is energy-efficient and comfortable. ↑
ⓘ Cost ranges are severity-bucket heuristics (US national rule-of-thumb). Get contractor quotes + a written scope before underwriting a rehab budget.
Schools (NCES district)
- District
- Big Rapids Public Schools
- NCES district ID
- 2605780
- Math proficiency
- 36% ▼ -4.00%
- Reading proficiency
- 52% ▲ 4.00%
- Median HH income
- $35,568
- Composite
- 36.37/100
- National rank
- #4685
- State rank
- #176 of 540 in MI
Livability — Big Rapids
- Score
- 73/100
- State rank
- #209
- US rank
- #5231
Category grades
Schools grade is shown separately in the Schools card above.
Census & demographics
- County
- Mecosta County · 18,407 people
- City population
- 18,407
- Metro
- Big Rapids, MI
- Population (ZIP)
- 18,407
- Household income
- $60,358
- Rent vs Own
- Severe rent burden
- 667.0
Population outlook (Mecosta County) Hauer SSP2
- Today (2025)
- 42,954 people
- By 2030
- 42,954 · +0.0%
- By 2040
- 41,574 · -3.2%
- By 2050
- 39,250 · -8.6%
- By 2075
- 32,628 · -24.0%
- By 2100
- 27,476 · -36.0%
Race, ethnicity, and origin ACS 2023
- Neighborhood character
- Predominantly White (87%)
- Race & ethnicity
- White 87% Two or more races 5% Black 4% Hispanic / Latino 3% Asian 1%
- Common ancestry
- Romanian 6% Iranian 5% Lithuanian 3%
- Foreign-born
- 2% · Canada
- Languages at home
- 97% English-only · Spanish 1% Other Asian/Pacific 1%
Political lean MEDSL · Mecosta
- 2024 margin
- Solid R (+30.0) · D 34.2% · R 64.2% · Other 1.6%
- 2008→2024 swing
- -29.3pp toward R · 2008: -0.7pp · 2024: -30.0pp
- All cycles
- 2024: R+30.0 2020: R+28.0 2016: R+26.1 2012: R+9.8 2008: R+0.7
Not yet ingested
- Civics
- —
Market trends
- HPI YoY
- ▼ -107.88%
- Current HPI
- 199.8828
- Rent YoY
- —
- Metro
- Big Rapids, MI
- State GDP YoY
- ▲ 1.37%
- F500 in state
- 28
Industry mix (Fortune 500 HQ in MI)
| Industry | F500 HQs | Revenue |
|---|---|---|
| Automotive Parts | 3 | $48B |
|
||
| Automotive | 2 | $372B |
|
||
| Chemicals | 1 | $45B |
|
||
| Automotive Retail | 1 | $29B |
|
||
| Healthcare / Medical Devices | 1 | $23B |
|
||
| Automotive Technology | 1 | $20B |
|
||
Price history
+0.0% since first listed6 events — show timeline
- 2026-06-03 Pending — SW Michigan MLS
- 2026-06-03 Listing Removed — MiRealSource-MiMLS
- 2026-06-03 Listed $60,000 MiRealSource-MiMLS
- 2026-06-03 Listing Removed — REALCOMP
- 2026-06-03 Listed $60,000 REALCOMP
- 2026-06-03 Listed $60,000 SW Michigan MLS
Cash-flow waterfall
monthlySold comps — $/sqft
last 12 mo · ≤1 miLoading sold comps…