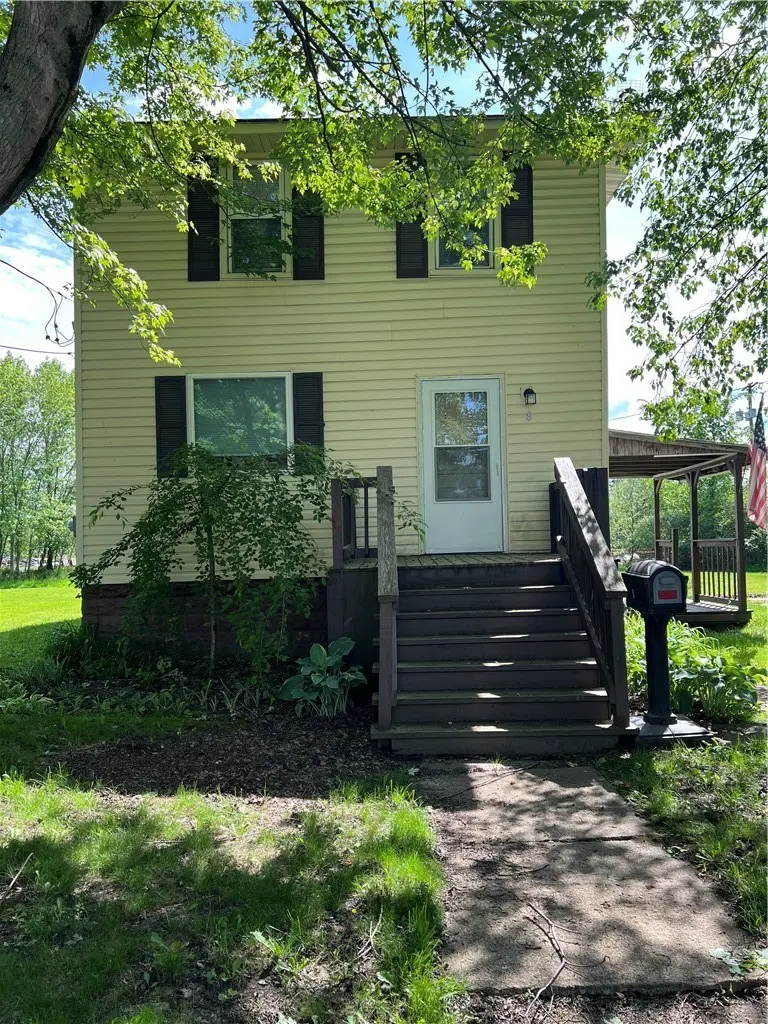
8 Lancaster Ave · Greenville, PA
Flood risk 1/10 · Minimal
- FEMA flood zone
- AE
- Chance of flooding over 30 yrs
- 0.0%
- Est. flood insurance / yr
- $1,737 – $8,500
Fire risk 1/10 · Minimal
- Est. fire insurance / yr
- $511 – $949
Heat risk 2/10 · Minimal
- Hot days now (above 95°F)
- 7 days/yr
- Hot days in 30 yrs
- 18 days/yr
Wind risk 1/10 · Minimal
- Chance of severe wind over 30 yrs
- —
Air-quality risk 2/10 · Minimal
- Unhealthy air days now
- 1 days/yr
- Unhealthy air days in 30 yrs
- 3 days/yr
Risk factors via First Street. Map © Google.
Why this score? — see what drove the B- grade
The composite is a weighted blend of 9 inputs, each scored 0–100. Each bar is that input's sub-score; the figure is the points it added to the 100-point composite (weight × sub-score).
- Cash flow +30.0/30.0
- 1% rule +10.0/10.0
- DSCR +10.0/10.0
- ARV discount +7.5/15.0
- Livability +3.8/5.0
- Schools +3.5/10.0
- Rent growth +2.5/5.0
- Condition / age +2.5/5.0
- Appreciation +0.0/10.0
$45,000
🖨 Deal sheet 📄 Offer letter ✓ Due diligence
Listing remarks
Four bedroom home on level lot in Greenville Boro. Large eat in Oak Kitchen with massive center island. Lots of storage . Open concept first floor. French doors lead to open deck area. The second floor features four bedrooms and a modern bath.
Key facts
- Open deck area
- Level lot
- French doors
Tags
Property features AI
Exterior
- Parking: Off-street parking for 2 vehicles
- Utilities: Public water; Public sewer
- Home design: 2-story frame home with vinyl siding; Asphalt roof; Resale property
- Construction: Frame construction with vinyl siding; Asphalt roof
- Exterior features: Lot approximately 0.21 acres (dimensions about 75x115)
Interior
- Kitchen: Refrigerator; Stove; Some electric appliances
- Bedrooms: Upper-level bedrooms: three bedrooms (approx. 10x12, 10x10, 9x11); Additional upper-level room: 9x16 (could serve as bedroom or bonus room)
- Flooring: Carpet; Vinyl
- Bathrooms: 1 full bathroom
- Heating & cooling: Gas forced-air heating
- Interior features: Interior entry basement; Unfinished basement; Electric fireplace (1)
- Laundry & utility: Basement utility space
Neighborhood map
What this means for you Summary
Snapshot
- This is a 4-bed/1.0-bath single-family listed at $45k.
Deal economics
- At list price, monthly cash flow is $269 ($3k/yr) — positive.
- The deal already cash-flows at list — no discount required.
- Meets the 1% rule at list price ($1k rent vs $45k).
- Recommended offer: $44k (1.5% below list) — sets the bar for market timing.
Location & tenants
- Location reads 75/100 on livability (#420 in PA, #3,829 nationally) — a middle-class / working-renter tenant base. Strengths: cost of living A+, health & safety A+, housing A; Watch: employment D+, amenities F, commute F.
- Greenville Area SD (town): math 33% / reading 50% proficiency, ranked #342 of 539 in PA (top 64%) — families likely to look elsewhere, expect single-tenant / working-renter base with shorter leases.
- Market conditions: 70 active listings in the ZIP; 62 units permitted in Mercer County in 2024 (0 in 5+ unit buildings).
Forward outlook
- Local home prices are declining (-3.0%/yr); year-one equity from $311 of loan paydown is wiped out by about $1k of value loss. Plan a longer hold.
- Mercer County population projected at -22% by 2050 — secular population decline; favor cash flow + early exit over multi-decade hold.
- At projected returns (-3.0% appreciation + 3.0% rent growth), your $13k cash investment doubles in ~5 years — after that, you're playing with house money.
Negotiation context
- It's been on market 15 days — a 2% lower offer ($44k) is reasonable based on typical stale-listing flexibility.
Risks & watch-outs
- Watch-outs: property tax is 2.8% of price; flood insurance adds $427/mo; built in 1900 — expect roof / HVAC / electrical / plumbing capex.
- Climate carrying-cost: in FEMA flood zone AE (mandatory federal flood insurance) — expect insurance premiums to compound above CPI over the hold.
Questions for the listing agent
- Built in 1900 — when were the roof, HVAC, electrical panel, plumbing, and water heater last replaced?
- Property tax is high relative to price — has the assessment been appealed recently, and will the sale trigger a re-assessment?
- What's the actual annual flood-insurance premium (NFIP or private), and is the property in a SFHA with mandatory coverage?
- Is there a deadline driving the sale (1031 exchange, divorce, estate, relocation)? That informs how much negotiation room exists.
- What's the average days-on-market for RENTAL listings here right now (not sales)? A rising rental-DOM trend means longer vacancies and softer asking-rent achievability than the comps imply.
- What's the recent tenant-quality profile in this submarket — average credit score on applications, eviction rate, late-payment / NSF rate, and stable-employment percentage? A property-management company in the area should have these aggregated.
- How much new for-sale + rental construction is in the pipeline within 1–3 miles? Heavy new supply typically softens prices + rents 12–24 months out; constrained supply supports both.
Investment metrics
- 1% rule
- 2.97% ✓
- Cap rate
- 24.85%
- Cash-on-cash
- 66.27%
- DSCR
- 3.95
- GRM
- 2.8
CMA / ARV
- ARV (on-the-fly)
- $220,320
- Comps found
- 3
Show comp detail 3 sales within ~0.75 mi
| Address | Dist | Beds/Ba | Sqft | Sold | Price | $/sf | Match |
|---|---|---|---|---|---|---|---|
| 19 Ruth St | 0.24mi | 3/1.5 (-1) | 1,376 (-4%) | 11mo | $210,000 | $153 | 65 |
| 38 N Mercer St | 0.70mi | 4/1.0 | 1,568 (+9%) | 15mo | $30,500 | $19 | 40 |
| 72 First Ave | 0.75mi | 4/2.0 | 1,232 (-14%) | 20mo | $200,000 | $162 | 20 |
Match score weights: distance 35% · size 25% · config 20% · recency 20%. Top-matched comps best support the ARV.
Projected returns pro-forma
-3.0% appreciation · 3.0% rent growth · sell at horizon
- IRR
- 19.7%
- Equity multiple
- 1.81×
- Total profit
- $10,169
- Equity at exit
- $6,710
- IRR
- 28.3%
- Equity multiple
- 3.56×
- Total profit
- $32,206
- Equity at exit
- $3,891
Cash invested: $12,600 (down + closing). Projections, not guarantees.
Landlord ↔ Tenant lean methodology
- Overall (STATE)
- 62 Landlord-Friendly
- State Pennsylvania
- 62 Landlord-Friendly · EVEN
- County
- — inherits STATE
- City
- — inherits STATE
ZIP-level market 16125
- Home prices YoY
- -29.0%
- Active inventory
- 70
- Price-to-rent
- 2.8×
Monthly cashflow live
- Estimated rent
- $1,337 medium interval (Pro) →
- Mortgage (P&I)
- −$236
- Tax from tax record
- −$105 /mo · $1,265/yr
- Insurance
- −$19
- Flood insurance flood zone
- −$427 /mo · $5,118/yr
- HOA
- −$0
- Vacancy / Maint / Mgmt
- −$281
- Net cashflow
- $269
Break-even live
UW: 25.0% down · 7.5% · 30yr · 1.5% tax · 5.0% vac · 8.0% maint · 8.0% mgmt
Financing live
Cash to close
- Down payment
- $11,250
- Closing costs
- $1,350
- Reserves months
- —
- Total cash needed
- —
Loan-product check · same deal, 3 products live
Conventional
25% down · 7.5% · 30yr
- Down + closing
- —
- Monthly P&I
- —
- Monthly cashflow
- —
- DSCR
- —
- Eligible?
- —
Personal DTI + credit; lowest rate.
DSCR
20% down · 8.5% · 30yr
- Down + closing
- —
- Monthly P&I
- —
- Monthly cashflow
- —
- DSCR
- —
- Eligible?
- —
No personal income docs; deal must DSCR.
Hard money
10% down · 12.0% · 12mo
- Down + closing
- —
- Monthly P&I
- —
- Monthly cashflow
- —
- DSCR
- —
- Eligible?
- —
Short-term bridge; refi at stabilization.
Listing history 10 events
-
2026-06-12statusdays on market $45,000 Pending 15 DOM
-
2026-06-09days on market $45,000 Active 14 DOM
-
2026-06-08days on market $45,000 Active 13 DOM
-
2026-06-08days on market $45,000 Active 12 DOM
-
2026-06-07days on market $45,000 Active 11 DOM
-
2026-06-04pricedays on market $45,000 Active 8 DOM
-
2026-06-02days on market $60,000 Active 7 DOM
-
2026-06-01days on market $60,000 Active 6 DOM
-
2026-05-31days on market $60,000 Active 5 DOM
-
2026-05-26$60,000 Active
ⓘ Source: listings_history table (triggers on properties + properties_extension) + one-shot
backfill from property_details.listing_events for pre-trigger history.
Tax reassessment forecast PA · Partial reset (capped growth)
- Current annual tax
- $1,265 · $105/mo
- Projected year-2 tax
- $1,265 · $105/mo
- Expected delta
- $0/yr ($0/mo · 0.0%)
ⓘ Screening estimate from a state-policy table — verify with the county assessor before closing.
Climate risk First Street
- Flood 1/10 Low FEMA zone AE · 0% chance over 30 yrs
- Wildfire 1/10 Low
- Heat 2/10 Low 7 d/yr ≥95°F today · 18 d/yr by 30 yrs out
- Wind 1/10 Low
- Air quality 2/10 Low 1 unhealthy d/yr today · 3 by 30 yrs out
Nearby sold comps map
Loading sold comps map…
Walkable amenities ~0.75 mi
Loading nearby amenities…
Taxation est. · year 1
- Rental income
- $16,040
- − Mortgage interest
- −$2,521
- − Property taxes
- −$1,265
- − Insurance
- −$5,344
- − Repairs & maintenance
- −$1,283
- − Management
- −$1,283
- − Depreciation
- −$1,309
- Taxable income
- $3,035
- Est. tax owed @ 24.0%
- −$728
- After-tax cash flow
- $2,503/yr
For passive investors: Depreciation is non-cash, so a rental often shows a tax loss while cash-flowing — sheltering income. Rental losses are passive: they offset passive income freely, and up to $25,000/yr can offset ordinary (W-2) income if you actively participate and your MAGI is under $100k (phasing out to $0 by $150k); unused losses carry forward. On sale, claimed depreciation is recaptured at up to 25%, and gains may owe capital-gains tax (a 1031 exchange can defer both). Figures are a year-1 estimate at your 24.0% rate — not tax advice; consult a CPA.
Schools (NCES district)
- District
- Greenville Area SD
- NCES district ID
- 4211160
- Math proficiency
- 33% ▼ -14.00%
- Reading proficiency
- 50% ▼ -15.00%
- Median HH income
- $42,111
- Composite
- 34.92/100
- National rank
- #5069
- State rank
- #342 of 539 in PA
Livability — Greenville
- Score
- 75/100
- State rank
- #420
- US rank
- #3829
Category grades
Schools grade is shown separately in the Schools card above.
Census & demographics
- Census place
- Greenville, PA
- County
- Mercer · 21,752 people
- City population
- 17,088
- Population (ZIP)
- 17,088
- Household income
- $56,851
- Rent vs Own
- Severe rent burden
- 15.4
Population outlook (Mercer County) Hauer SSP2
- Today (2025)
- 108,341 people
- By 2030
- 104,269 · -3.8%
- By 2040
- 94,624 · -12.7%
- By 2050
- 84,891 · -21.6%
- By 2075
- 65,094 · -39.9%
- By 2100
- 47,657 · -56.0%
Race, ethnicity, and origin ACS 2023
- Neighborhood character
- Predominantly White (94%)
- Race & ethnicity
- White 94% Two or more races 4%
- Common ancestry
- Romanian 5% Slovak 2% Serbian 2%
- Foreign-born
- 1%
- Languages at home
- 97% English-only · German/W. Germanic 2%
Political lean MEDSL · Mercer
- 2024 margin
- Solid R (+30.2) · D 34.5% · R 64.7%
- 2008→2024 swing
- -29.9pp toward R · 2008: -0.3pp · 2024: -30.2pp
- All cycles
- 2024: R+30.2 2020: R+26.0 2016: R+25.0 2012: R+2.5 2008: R+0.3
Not yet ingested
- Civics
- —
Market trends
- HPI YoY
- ▼ -63.97%
- Current HPI
- 156.3732
- Rent YoY
- —
- Metro
- —
- State GDP YoY
- ▲ 1.68%
- F500 in state
- 34
Industry mix (Fortune 500 HQ in PA)
| Industry | F500 HQs | Revenue |
|---|---|---|
| Healthcare | 2 | $309B |
|
||
| Insurance | 2 | $27B |
|
||
| Telecommunications / Media | 1 | $124B |
|
||
| Industrial Distribution | 1 | $22B |
|
||
| Financial Services | 1 | $20B |
|
||
| Chemicals / Materials | 1 | $18B |
|
||
Price history
1 event — show timeline
- 2026-05-26 Listed $60,000 West Penn MLS
Property tax history
+0.3%/yrLatest (2025): $1,265 · +2.8% YoY. Source: county tax records.
Cash-flow waterfall
monthlySold comps — $/sqft
last 12 mo · ≤1 miLoading sold comps…