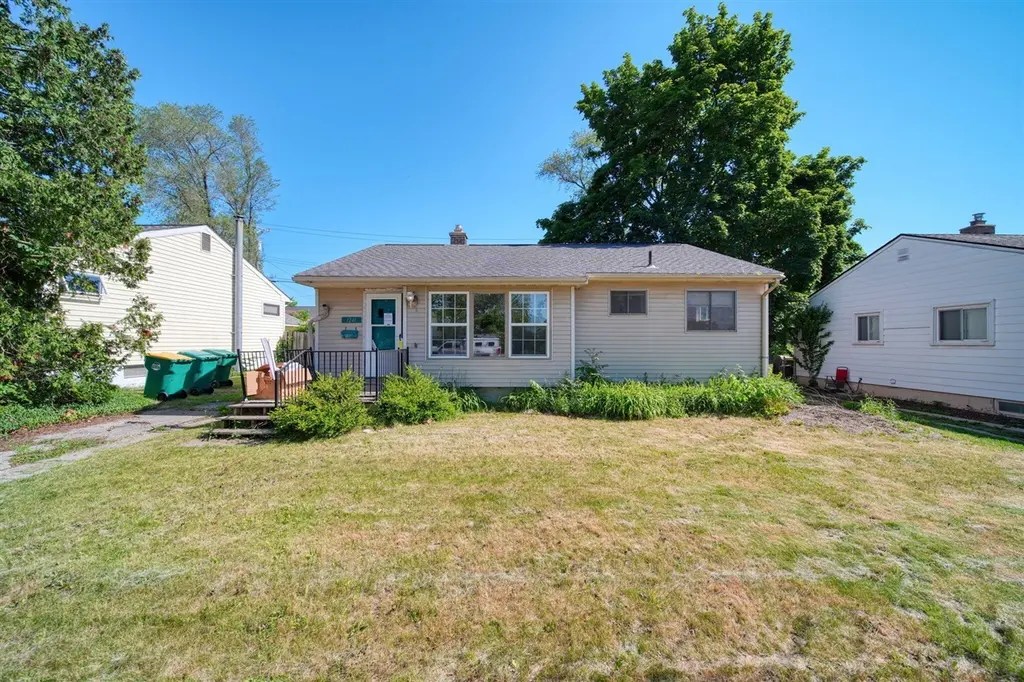
1241 Grove Rd · Ypsilanti, MI
Flood risk 1/10 · Minimal
- FEMA flood zone
- X (unshaded)
- Chance of flooding over 30 yrs
- 0.0%
- Est. flood insurance / yr
- $473 – $860
Fire risk 1/10 · Minimal
- Est. fire insurance / yr
- $784 – $1,456
Heat risk 3/10 · Minor
- Hot days now (above 97°F)
- 7 days/yr
- Hot days in 30 yrs
- 15 days/yr
Wind risk 2/10 · Minimal
- Chance of severe wind over 30 yrs
- —
Air-quality risk 2/10 · Minimal
- Unhealthy air days now
- 1 days/yr
- Unhealthy air days in 30 yrs
- 2 days/yr
Risk factors via First Street. Map © Google.
Why this score? — see what drove the C+ grade
The composite is a weighted blend of 9 inputs, each scored 0–100. Each bar is that input's sub-score; the figure is the points it added to the 100-point composite (weight × sub-score).
- Cash flow +23.0/30.0
- ARV discount +15.0/15.0
- DSCR +7.4/10.0
- 1% rule +5.6/10.0
- Livability +4.0/5.0
- Rent growth +3.6/5.0
- Condition / age +2.5/5.0
- Schools +1.3/10.0
- Appreciation +0.0/10.0
$180,000
🖨 Deal sheet 📄 Offer letter ✓ Due diligence
Listing remarks MLS
Opportunity awaits in Ypsilanti Township! This 3-bedroom, 1-bath home offers views of Ford Lake and endless potential for the right buyer. Featuring a functional layout with eat in kitchen, including stainless appliances, a spacious living area and a partially finished basement that provides additional living, recreation, or storage space. Enjoy being conveniently located near parks, shopping, dining, and major commuter routes. Priced below market value, the home does require TLC and updates, making it an excellent opportunity for investors, renovators, or buyers looking to build equity and customize a home to their taste. Whether you're seeking a primary residence, rental property, or renovation project, this home offers a desirable location and great potential. Bring your vision and transform this Ford Lake-view property into something special!
Key facts
- 6,534 sq ft lot
- 2 garage spots
- Built 1952
Property features AI
Exterior
- Parking: Detached 2-car garage
- Utilities: Natural gas connected; Cable connected; Public water
- Home design: Ranch-style single family home; Built in 1952; Public water; Property faces unspecified direction
- Construction: Vinyl siding; Shingle roof; Built in 1952; Full basement foundation
- Exterior features: Sidewalk
Interior
- Kitchen: Oven; Range; Microwave; Refrigerator; Freezer; Dishwasher
- Bathrooms: 1 full bathroom
- Heating & cooling: Forced air heating; Wall-mounted air conditioning units
- Interior features: Eat-in kitchen; Replacement windows with window treatments; Full basement; 6 total rooms
- Laundry & utility: Washer; Dryer; Natural gas water heater
Neighborhood map
What this means for you Summary
Snapshot
- This is a 3-bed/1.0-bath single-family listed at $180k.
Deal economics
- At list price, monthly cash flow is $320 ($4k/yr) — positive.
- The deal already cash-flows at list — no discount required.
- Meets the 1% rule at list price ($2k rent vs $180k).
- Cap rate 8.4% vs local median 4.0% in Ypsilanti — top-decile yield for the area; either an underpriced asset or a hidden risk that comps aren't pricing in. Stress-test before assuming the spread holds.
Location & tenants
- Location reads 81/100 on livability (#71 in MI, #1,539 nationally) — a professional / high-income tenant draw. Strengths: amenities A+, commute A+, cost of living A+; Watch: crime F, employment D-.
- Ypsilanti Community Schools (suburban): math 11% / reading 20% proficiency, ranked #501 of 540 in MI (top 93%) — low school quality limits family demand, transient renter base, plan for 1-2y turnover; 69% free/reduced lunch — lower-income household profile, screen leases tightly.
- Market conditions: Rents rising fast (+4.4%/yr); 166 active listings in the ZIP; 6 comparable units currently listed for rent nearby; rentals at typical pace (median 21d on market — plan ~3-4 weeks tenant-placement turnaround); 996 units permitted in Washtenaw County in 2024 (492 in 5+ unit buildings).
- This rent runs 36% of the median local income ($63k/yr) — at the standard rent-burdened threshold; future hikes will face affordability resistance.
Forward outlook
- Local home prices are declining (-3.0%/yr); year-one equity from $1k of loan paydown is wiped out by about $5k of value loss. Plan a longer hold.
- Washtenaw County population projected at +25% by 2050 — long-run rental-demand tailwind backs the buy-and-hold thesis.
Negotiation context
- Only 10 days on market — expect competitive offers; lowballing is unlikely to land.
- 7 sale attempts since 10y ago with the ask held roughly flat each time — persistent listings suggest the price (not the market) is what's stuck; bring a comps-based counter.
- Current owner paid $133k; 36% above their basis — modest negotiation headroom, anchor on the comps not their cost.
Risks & watch-outs
- Watch-outs: built in 1952 — expect roof / HVAC / electrical / plumbing capex.
Questions for the listing agent
- Built in 1952 — when were the roof, HVAC, electrical panel, plumbing, and water heater last replaced?
- Is there a deadline driving the sale (1031 exchange, divorce, estate, relocation)? That informs how much negotiation room exists.
- Crime grade is F in this area — have there been break-ins, vandalism, or insurance claims at this property in the last 3 years? What carrier currently insures it and at what premium?
- What's the average days-on-market for RENTAL listings here right now (not sales)? A rising rental-DOM trend means longer vacancies and softer asking-rent achievability than the comps imply.
- What's the recent tenant-quality profile in this submarket — average credit score on applications, eviction rate, late-payment / NSF rate, and stable-employment percentage? A property-management company in the area should have these aggregated.
- How much new for-sale + rental construction is in the pipeline within 1–3 miles? Heavy new supply typically softens prices + rents 12–24 months out; constrained supply supports both.
Investment metrics
- 1% rule
- 1.06% ✓
- Cap rate
- 8.43%
- Cash-on-cash
- 7.62%
- DSCR
- 1.34
- GRM
- 7.9
CMA / ARV
- ARV (on-the-fly)
- $242,316
- Comps found
- 12
Show comp detail 12 sales within ~0.75 mi
| Address | Dist | Beds/Ba | Sqft | Sold | Price | $/sf | Match |
|---|---|---|---|---|---|---|---|
| 1163 Grove Rd | 0.12mi | 3/1.0 | 1,458 (-4%) | 2mo | $255,000 | $175 | 85 |
| 1111 Hull Ave | 0.51mi | 3/1.0 | 1,540 (+1%) | 5mo | $245,000 | $159 | 70 |
| 1476 Foley Ave | 0.41mi | 3/1.0 | 1,650 (+8%) | 1mo | $230,000 | $139 | 66 |
| 1427 Jay Ave | 0.40mi | 3/1.5 | 1,600 (+5%) | 6mo | $246,000 | $154 | 66 |
| 1237 Lester Ave | 0.32mi | 3/1.5 | 1,677 (+10%) | 2mo | $255,900 | $153 | 64 |
| 1179 Coleman St | 0.58mi | 3/1.0 | 1,450 (-5%) | 4mo | $259,560 | $179 | 61 |
| 1132 Juneau Rd | 0.32mi | 4/2.0 (+1) | 1,702 (+12%) | 1mo | $300,000 | $176 | 56 |
| 1001 Juneau Rd | 0.47mi | 3/1.5 | 1,702 (+12%) | 6mo | $252,000 | $148 | 52 |
| 1586 Foley Ave | 0.48mi | 3/1.5 | 1,748 (+15%) | 3mo | $222,500 | $127 | 48 |
| 1717 Foley Ave | 0.66mi | 3/1.0 | 1,375 (-10%) | 6mo | $158,000 | $115 | 48 |
| 1176 Borgstrom Ave | 0.51mi | 3/2.0 | 1,742 (+14%) | 1mo | $325,000 | $187 | 47 |
| 1202 Jay Ave | 0.63mi | 3/1.5 | 1,725 (+13%) | 4mo | $284,750 | $165 | 43 |
Match score weights: distance 35% · size 25% · config 20% · recency 20%. Top-matched comps best support the ARV.
Projected returns pro-forma
-3.0% appreciation · 4.38% rent growth · sell at horizon
- IRR
- -3.2%
- Equity multiple
- 0.88×
- Total profit
- $-6,117
- Equity at exit
- $26,839
- IRR
- 7.9%
- Equity multiple
- 1.64×
- Total profit
- $32,170
- Equity at exit
- $15,563
Cash invested: $50,400 (down + closing). Projections, not guarantees.
Landlord ↔ Tenant lean methodology
- Overall (STATE)
- 62 Landlord-Friendly
- State Michigan
- 62 Landlord-Friendly · EVEN
- County
- — inherits STATE
- City
- — inherits STATE
ZIP-level market 48198
- Rents YoY
- 4.4%
- Active inventory
- 166
- Price-to-rent
- 7.9×
Monthly cashflow live
- Estimated rent
- $1,900 high interval (Pro) →
- Mortgage (P&I)
- −$944
- Tax from tax record
- −$162 /mo · $1,942/yr
- Insurance
- −$75
- HOA
- −$0
- Vacancy / Maint / Mgmt
- −$399
- Net cashflow
- $320
Break-even live
UW: 25.0% down · 7.5% · 30yr · 1.5% tax · 5.0% vac · 8.0% maint · 8.0% mgmt
Financing live
Cash to close
- Down payment
- $45,000
- Closing costs
- $5,400
- Reserves months
- —
- Total cash needed
- —
Loan-product check · same deal, 3 products live
Conventional
25% down · 7.5% · 30yr
- Down + closing
- —
- Monthly P&I
- —
- Monthly cashflow
- —
- DSCR
- —
- Eligible?
- —
Personal DTI + credit; lowest rate.
DSCR
20% down · 8.5% · 30yr
- Down + closing
- —
- Monthly P&I
- —
- Monthly cashflow
- —
- DSCR
- —
- Eligible?
- —
No personal income docs; deal must DSCR.
Hard money
10% down · 12.0% · 12mo
- Down + closing
- —
- Monthly P&I
- —
- Monthly cashflow
- —
- DSCR
- —
- Eligible?
- —
Short-term bridge; refi at stabilization.
Rent comps 6 comps
| Address | Beds | Baths | Sqft | Rent | $/sqft | DOM | Units | Dist |
|---|---|---|---|---|---|---|---|---|
| 1428 Village Ln Ypsilanti, MI | 1.0–2.0 | 1.0 | 860 | $1,550 | $1.80 | 44d | 1 | 0.47mi |
| 8753 Spinnaker Way Ypsilanti, MI | 3.0 | 1.0–2.0 | 893 | $2,010 | $2.25 | 10d | 16 | 0.64mi |
| 1311 Nash Ave Ypsilanti, MI | 3.0 | 1.0 | 1200 | $1,800 | $1.50 | 18d | 1 | 1.05mi |
| 719 Oswego Ave Ypsilanti, MI | 3.0 | 1.0 | 1200 | $1,800 | $1.50 | 20d | 1 | 1.12mi |
| 2355 Briardale Ct Ypsilanti, MI | 3.0 | 1.0 | 1200 | $1,800 | $1.50 | 44d | 1 | 1.16mi |
| 677 Onandaga Ave Ypsilanti, MI | 4.0 | 2.0 | 1412 | $2,300 | $1.63 | 2d | 1 | 1.17mi |
Listing history 8 events
-
2026-06-15status $180,000 Pending 10 DOM
-
2026-06-15days on market $180,000 Active - Contingent 10 DOM
-
2026-06-13days on market $180,000 Active - Contingent 8 DOM
-
2026-06-10status $180,000 Active - Contingent 4 DOM
-
2026-06-09days on market $180,000 Active 4 DOM
-
2026-06-08days on market $180,000 Active 3 DOM
-
2026-06-07remarks 699-char remark
-
2026-06-07$180,000 Active 2 DOM
ⓘ Source: listings_history table (triggers on properties + properties_extension) + one-shot
backfill from property_details.listing_events for pre-trigger history.
Tax reassessment forecast MI · Partial reset (capped growth)
- Current annual tax
- $1,942 · $162/mo
- Projected year-2 tax
- $2,357 · $196/mo
- Expected delta
- +$415/yr (+$35/mo · 21.4%)
ⓘ Screening estimate from a state-policy table — verify with the county assessor before closing.
Climate risk First Street
- Flood 1/10 Low FEMA zone X (unshaded) · 0% chance over 30 yrs
- Wildfire 1/10 Low
- Heat 3/10 Moderate 7 d/yr ≥97°F today · 15 d/yr by 30 yrs out
- Wind 2/10 Low
- Air quality 2/10 Low 1 unhealthy d/yr today · 2 by 30 yrs out
Nearby sold comps map
Loading sold comps map…
Walkable amenities ~0.75 mi
Loading nearby amenities…
Taxation est. · year 1
- Rental income
- $22,798
- − Mortgage interest
- −$10,083
- − Property taxes
- −$1,942
- − Insurance
- −$900
- − Repairs & maintenance
- −$1,824
- − Management
- −$1,824
- − Depreciation
- −$5,236
- Taxable income
- $989
- Est. tax owed @ 24.0%
- −$237
- After-tax cash flow
- $3,604/yr
For passive investors: Depreciation is non-cash, so a rental often shows a tax loss while cash-flowing — sheltering income. Rental losses are passive: they offset passive income freely, and up to $25,000/yr can offset ordinary (W-2) income if you actively participate and your MAGI is under $100k (phasing out to $0 by $150k); unused losses carry forward. On sale, claimed depreciation is recaptured at up to 25%, and gains may owe capital-gains tax (a 1031 exchange can defer both). Figures are a year-1 estimate at your 24.0% rate — not tax advice; consult a CPA.
Schools (NCES district)
- District
- Ypsilanti Community Schools
- NCES district ID
- 2636630
- Math proficiency
- 11% ▼ -8.00%
- Reading proficiency
- 20% ▼ -3.00%
- Median HH income
- $37,759
- Composite
- 12.98/100
- National rank
- #9572
- State rank
- #501 of 540 in MI
Livability — Ypsilanti
- Score
- 81/100
- State rank
- #71
- US rank
- #1539
Category grades
Schools grade is shown separately in the Schools card above.
Census & demographics
- County
- Washtenaw County · 306,860 people
- City population
- 105,769
- Metro
- Ann Arbor, MI
- Population (ZIP)
- 39,244
- Household income
- $63,326
- Rent vs Own
- Severe rent burden
- 1998.0
Population outlook (Washtenaw County) Hauer SSP2
- Today (2025)
- 402,878 people
- By 2030
- 424,104 · +5.3%
- By 2040
- 464,633 · +15.3%
- By 2050
- 504,728 · +25.3%
- By 2075
- 614,463 · +52.5%
- By 2100
- 676,181 · +67.8%
Race, ethnicity, and origin ACS 2023
- Neighborhood character
- Diverse neighborhood (Simpson 0.66)
- Race & ethnicity
- White 48% Black 32% Two or more races 11% Hispanic / Latino 8% Asian 2%
- Hispanic origin (detail)
- Mexican 4%
- Common ancestry
- Romanian 3% Italian 2% Slovak 2%
- Foreign-born
- 9% · Canada, China, South Korea
- Languages at home
- 88% English-only · Spanish 7% Other Indo-European 1% Arabic 1%
Political lean MEDSL · Washtenaw
- 2024 margin
- Solid D (+44.4) · D 71.0% · R 26.6% · Other 2.4%
- 2008→2024 swing
- +3.5pp toward D · 2008: 41.0pp · 2024: 44.4pp
- All cycles
- 2024: D+44.4 2020: D+46.6 2016: D+41.5 2012: D+36.0 2008: D+41.0
Not yet ingested
- Civics
- —
Market trends
- HPI YoY
- ▼ -224.96%
- Current HPI
- 204.1228
- Rent YoY
- ▲ 4.38%
- Metro
- Ann Arbor, MI
- State GDP YoY
- ▲ 1.37%
- F500 in state
- 28
Industry mix (Fortune 500 HQ in MI)
| Industry | F500 HQs | Revenue |
|---|---|---|
| Automotive Parts | 3 | $48B |
|
||
| Automotive | 2 | $372B |
|
||
| Chemicals | 1 | $45B |
|
||
| Automotive Retail | 1 | $29B |
|
||
| Healthcare / Medical Devices | 1 | $23B |
|
||
| Automotive Technology | 1 | $20B |
|
||
Price history
+239.6% since first listed29 events — show timeline
- 2026-06-05 Listed $180,000 REALCOMP
- 2026-06-05 Listed $180,000 SW Michigan MLS
- 2026-06-05 Listed $180,000 MiRealSource-MiMLS
- 2026-06-04 Coming Soon $180,000 MiRealSource-MiMLS
- 2026-06-04 Coming Soon $180,000 SW Michigan MLS
- 2017-01-12 Sold (Public Records) $132,600 Public Records
- 2017-01-10 Pending — AAMLS
- 2017-01-09 Sold (MLS) $132,600 SW Michigan MLS
- 2017-01-09 Sold (MLS) $132,600 MiRealSource-MiMLS
- 2017-01-09 Sold (MLS) $132,600 AAMLS
- 2017-01-09 Sold (MLS) $132,600 REALCOMP
- 2017-01-08 Listing Removed — REALCOMP
- 2017-01-07 Listing Removed — MiRealSource-MiMLS
- 2017-01-07 Delisted — AAMLS
- 2016-12-01 Contingent — MiRealSource-MiMLS
- 2016-12-01 Contingent — REALCOMP
- 2016-12-01 Contingent — AAMLS
- 2016-10-27 Price Changed $127,500 MiRealSource-MiMLS
- 2016-10-27 Price Changed $127,500 REALCOMP
- 2016-10-27 Price Changed $127,500 AAMLS
- 2016-09-27 Price Changed $132,500 MiRealSource-MiMLS
- 2016-09-27 Price Changed $132,500 REALCOMP
- 2016-09-27 Price Changed $132,500 AAMLS
- 2016-08-29 Listed $139,900 MiRealSource-MiMLS
- 2016-08-29 Listed $139,900 REALCOMP
- 2016-08-29 Listed $139,900 AAMLS
- 2016-08-29 Listed $127,500 SW Michigan MLS
- 1993-02-18 Sold (Public Records) $53,000 Public Records
- 1993-02-18 Sold (Public Records) $53,000 Public Records
Property tax history
-0.9%/yrLatest (2025): $1,942 · -38.8% YoY. Source: county tax records.
Cash-flow waterfall
monthlySold comps — $/sqft
last 12 mo · ≤1 miLoading sold comps…