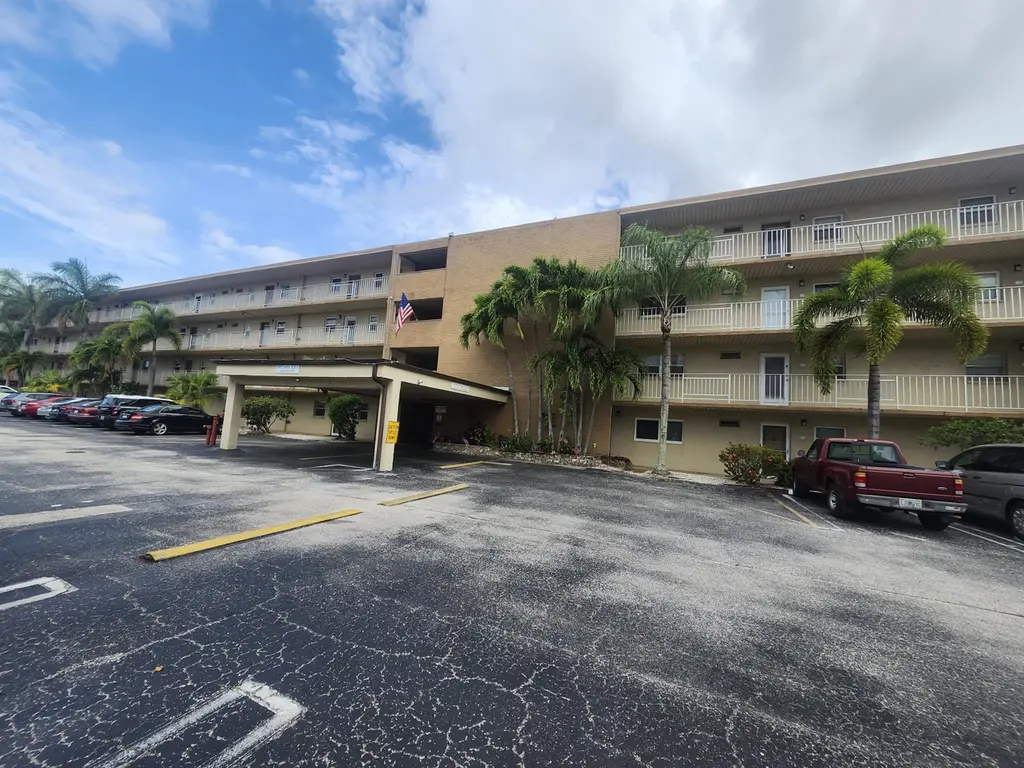
330 NE 26th Ave #411 · Boynton Beach, FL
Flood risk 1/10 · Minimal
- FEMA flood zone
- X (unshaded)
- Chance of flooding over 30 yrs
- 0.0%
- Est. flood insurance / yr
- $507 – $1,088
Fire risk 1/10 · Minimal
- Est. fire insurance / yr
- $947 – $1,759
Heat risk 9/10 · Severe
- Hot days now (above 105°F)
- 7 days/yr
- Hot days in 30 yrs
- 26 days/yr
Wind risk 10/10 · Severe
- Chance of severe wind over 30 yrs
- 99.0%
Air-quality risk 2/10 · Minimal
- Unhealthy air days now
- 0 days/yr
- Unhealthy air days in 30 yrs
- 2 days/yr
Risk factors via First Street. Map © Google.
Why this score? — see what drove the B grade
The composite is a weighted blend of 9 inputs, each scored 0–100. Each bar is that input's sub-score; the figure is the points it added to the 100-point composite (weight × sub-score).
- Cash flow +30.0/30.0
- 1% rule +10.0/10.0
- DSCR +10.0/10.0
- ARV discount +7.5/15.0
- Schools +4.3/10.0
- Livability +3.6/5.0
- Rent growth +3.4/5.0
- Condition / age +2.2/5.0
- Appreciation +0.0/10.0
$75,000
🖨 Deal sheet (PDF) 📄 Offer letter ✓ Due diligence
Listing remarks MLS
ACROSS FROM CONGREGATION BETH KODESH, BEING OFFERED FURNISHED LOWEST PRICED UNIT IN BUILDING FULLY FURNISHED EXCEPT FOR MASTER BEDROOM! EASY TO SHOW ON ''''''SUPRA'''' CALL LO 561-982-7776 OR 561-447-8191''
Key facts
- 2 clubhouses
- Garden view
- Tennis pickleball
Tags
Property features AI
Finance
- Financial info: Pets not allowed
- HOA & community: Has association; Monthly HOA fee; Association amenities include: billiard room, clubhouse, fitness center, jogging path, laundry, picnic area, parking, pool, shuffleboard court, spa/hot tub, tennis courts, community room, library, maintenance; HOA covers cable TV, internet, grounds and structure maintenance, pest control, security, sewer, trash, water, common areas, elevator, roof repairs, recreation facilities, and pool service; Senior community
Exterior
- Parking: Assigned parking plus guest parking; One open parking space
- Security: Smoke detectors
- Utilities: Public water; Public sewer; Cable available; Water available
- Home design: Condominium; Updated/remodeled resale unit; Faces west; Building has 4 stories; Entry on main level
- Construction: CBS construction; Flat roof
- Exterior features: Glass-enclosed patio/porch; Not waterfront; Accessible common areas and grip-accessible features
Interior
- Kitchen: Disposal; Dishwasher; Electric range; Microwave; Refrigerator; Freezer
- Bedrooms: Two bedrooms on the main level
- Flooring: Carpet; Tile
- Bathrooms: Two full bathrooms on the main level
- Heating & cooling: Central electric heating; Central air conditioning; Ceiling fans
- Interior features: Walk-in closets; Bedroom layout with stacked configuration; Dome kitchen; Smoke detectors
- Laundry & utility: Laundry available in the association
Neighborhood map
What this means for you Summary
Snapshot
- This is a 2-bed/2.0-bath condo listed at $75k. Condition is rated fair.
Deal economics
- At list price, monthly cash flow is $522 ($6k/yr) — positive.
- The deal already cash-flows at list — no discount required.
- Meets the 1% rule at list price ($2k rent vs $75k).
- Cap rate 14.7% vs local median 4.3% in Boynton Beach — top-decile yield for the area; either an underpriced asset or a hidden risk that comps aren't pricing in. Stress-test before assuming the spread holds.
Location & tenants
- Location reads 72/100 on livability (#351 in FL) — a middle-class / working-renter tenant base. Strengths: housing A+, health & safety B+, cost of living B; Watch: amenities D+, crime D-, commute F.
- Palm Beach (suburban): math 46% / reading 53% proficiency, ranked #34 of 73 in FL (top 47%) — families likely to look elsewhere, expect single-tenant / working-renter base with shorter leases.
- Zoned schools: Rolling Green Elementary School (math 21% / reading 26%, grade F, #2,061 of 2,144 statewide, top 96%, 692 students, 88% FRL); Congress Community Middle School (math 21% / reading 28%, grade F, #522 of 571 statewide, top 93%, 988 students, 72% FRL); Boynton Beach Community High (math 13% / reading 25%, grade F, #565 of 667 statewide, top 85%, 1,547 students, 65% FRL) — zoned schools average 75% FRL vs 52% district-wide (23 pts higher); higher-poverty schools than district average — tighter screening recommended.
- Zoned-school proficiency averages 22% at this address vs 50% district-wide (-27 pts) — the specific schools serving this property underperform the Palm Beach average; the district grade overstates school quality for this exact location.
- Market conditions: Rents rising (+3.6%/yr); 539 active listings in the ZIP; 40 comparable units currently listed for rent nearby; rentals at typical pace (median 22d on market — plan ~3-4 weeks tenant-placement turnaround); 3,974 units permitted in Palm Beach County in 2024 (1,012 in 5+ unit buildings).
Forward outlook
- Local home prices are declining (-3.0%/yr); year-one equity from $519 of loan paydown is wiped out by about $2k of value loss. Plan a longer hold.
- Palm Beach County population projected at +30% by 2050 — long-run rental-demand tailwind backs the buy-and-hold thesis.
- At projected returns (-3.0% appreciation + 3.6% rent growth), your $21k cash investment doubles in ~4 years — after that, you're playing with house money.
Negotiation context
- Only 13 days on market — expect competitive offers; lowballing is unlikely to land.
- 2 sale attempts since 28y ago with the ask held roughly flat each time — persistent listings suggest the price (not the market) is what's stuck; bring a comps-based counter.
- Current owner paid $20k; list at $75k implies a 266% gain — meaningful room to come down on a strong offer.
Risks & watch-outs
- Watch-outs: HOA is 28% of rent.
- Climate carrying-cost: severe wind risk, 99% chance of damaging wind over 30y; extreme-heat days projected 7→26/yr by 2055 (HVAC capex compounding) — expect insurance premiums to compound above CPI over the hold.
Questions for the listing agent
- Have any recent inspections been done? Can we get a copy of the seller's disclosures and any deferred-maintenance estimates?
- Built in 1974 — when were the roof, HVAC, electrical panel, plumbing, and water heater last replaced?
- What does the HOA fee cover, when was the last increase, and are there any pending special assessments or reserve-fund shortfalls?
- Any open or pending special assessments — roof, HVAC, plumbing, elevator, façade? What's the per-unit balance and payoff schedule, and is the seller paying it off at close or rolling it to the buyer?
- Is there a deadline driving the sale (1031 exchange, divorce, estate, relocation)? That informs how much negotiation room exists.
- Crime grade is D in this area — have there been break-ins, vandalism, or insurance claims at this property in the last 3 years? What carrier currently insures it and at what premium?
- What's the average days-on-market for RENTAL listings here right now (not sales)? A rising rental-DOM trend means longer vacancies and softer asking-rent achievability than the comps imply.
- What's the recent tenant-quality profile in this submarket — average credit score on applications, eviction rate, late-payment / NSF rate, and stable-employment percentage? A property-management company in the area should have these aggregated.
- How much new apartment / multifamily construction is in the pipeline within 1–3 miles? Heavy new supply (>2% of stock underway) typically softens rents 12–24 months out; light construction supports rent growth.
Investment metrics
- 1% rule
- 2.70% ✓
- Cap rate
- 14.65%
- Cash-on-cash
- 29.86%
- DSCR
- 2.33
- GRM
- 3.1
CMA / ARV
No comps found within radius.
Projected returns pro-forma
-3.0% appreciation · 3.64% rent growth · sell at horizon
- IRR
- 25.8%
- Equity multiple
- 2.09×
- Total profit
- $22,807
- Equity at exit
- $11,183
- IRR
- 34.2%
- Equity multiple
- 4.32×
- Total profit
- $69,673
- Equity at exit
- $6,485
Cash invested: $21,000 (down + closing). Projections, not guarantees.
Landlord ↔ Tenant lean methodology
- Overall (STATE)
- 87 Strongly Landlord-Friendly
- State Florida
- 87 Strongly Landlord-Friendly · R+3
- County
- — inherits STATE
- City
- — inherits STATE
ZIP-level market 33435
- Rents YoY
- 3.6%
- Active inventory
- 539
- Price-to-rent
- 3.1×
Monthly cashflow live
- Estimated rent
- $2,023 high interval (Pro) →
- Mortgage (P&I)
- −$393
- Tax est. 1.5%
- −$94 /mo · $1,125/yr
- Insurance
- −$31
- HOA
- −$557
- Vacancy / Maint / Mgmt
- −$425
- Net cashflow
- $522
Break-even live
Sensitivity live
| Price | -10% $574 | -5% $548 | +0% $522 | +5% $497 | +10% $471 |
|---|---|---|---|---|---|
| Rent | -10% $363 | -5% $443 | +0% $522 | +5% $602 | +10% $682 |
| Rate | -1.0pp $560 | -0.5pp $542 | base $522 | +0.5pp $503 | +1.0pp $483 |
UW: 25.0% down · 7.5% · 30yr · 1.5% tax · 5.0% vac · 8.0% maint · 8.0% mgmt
Financing live
Cash to close
- Down payment
- $18,750
- Closing costs
- $2,250
- Reserves months
- —
- Total cash needed
- —
Loan-product check · same deal, 3 products live
Conventional
25% down · 7.5% · 30yr
- Down + closing
- —
- Monthly P&I
- —
- Monthly cashflow
- —
- DSCR
- —
- Eligible?
- —
Personal DTI + credit; lowest rate.
DSCR
20% down · 8.5% · 30yr
- Down + closing
- —
- Monthly P&I
- —
- Monthly cashflow
- —
- DSCR
- —
- Eligible?
- —
No personal income docs; deal must DSCR.
Hard money
10% down · 12.0% · 12mo
- Down + closing
- —
- Monthly P&I
- —
- Monthly cashflow
- —
- DSCR
- —
- Eligible?
- —
Short-term bridge; refi at stabilization.
Rent comps 40 comps
| Address | Beds | Baths | Sqft | Rent | $/sqft | DOM | Units | Dist |
|---|---|---|---|---|---|---|---|---|
| 330 NE 26th Ave Unit 108 Boynton Beach, FL | 1.0 | 1.5 | 754 | $1,375 | $1.82 | 26d | 1 | 0.03mi |
| 330 NE 26th Ave Unit 108 Boynton Beach, FL | 1.0 | 1.5 | 754 | $1,600 | $2.12 | 4d | 1 | 0.03mi |
| 300 NE 26th Ave #1040 Boynton Beach, FL | 2.0 | 2.0 | 1080 | $1,559 | $1.44 | 26d | 1 | 0.08mi |
| 2615 NE 3rd Ct #4030 Boynton Beach, FL | 2.0 | 2.0 | 960 | $1,699 | $1.77 | 7d | 1 | 0.09mi |
| 2515 NE 2nd Ct #202 Boynton Beach, FL | 2.0 | 2.0 | 960 | $1,499 | $1.56 | 26d | 1 | 0.12mi |
| 2601 3rd Ct NE #202 Boynton Beach, FL | 2.0 | 2.0 | 982 | $1,500 | $1.53 | 20d | 1 | 0.12mi |
| 2615 NE 1st Ct #403 Boynton Beach, FL | 2.0 | 2.0 | 960 | $2,100 | $2.19 | 26d | 1 | 0.16mi |
| 2615 NE 1st Ct Boynton Beach, FL | 2.0 | 2.0 | 960 | $1,850 | $1.93 | 20d | 2 | 0.17mi |
| 230 NE 26th Ave #1070 Boynton Beach, FL | 1.0 | 1.5 | 754 | $1,620 | $2.15 | 13d | 1 | 0.17mi |
| 230 NE 26th Ave Boynton Beach, FL | 1.0–2.0 | 1.5–2.0 | 857 | $1,650 | $1.93 | 19d | 2 | 0.18mi |
| 130 NE 26th Ave #307 Boynton Beach, FL | 2.0 | 2.0 | 982 | $3,500 | $3.56 | 26d | 1 | 0.25mi |
| 4 Crossings Cir Unit B Boynton Beach, FL | 2.0 | 1.5 | 864 | $1,950 | $2.26 | 26d | 1 | 0.27mi |
| 7 Crossings Cir Boynton Beach, FL | 2.0 | 1.5 | 864 | $2,500 | $2.89 | 26d | 1 | 0.29mi |
| 2400 NE 1st Ln #206 Boynton Beach, FL | 1.0 | 1.5 | 754 | $1,800 | $2.39 | 17d | 1 | 0.30mi |
| 661 Waterside Dr Hypoluxo, FL | 2.0 | 2.0 | 768 | $2,000 | $2.60 | 26d | 1 | 0.32mi |
| 2213 NE 1st Ct #103 Boynton Beach, FL | 1.0 | 1.5 | 624 | $1,350 | $2.16 | 26d | 1 | 0.33mi |
| 17 Crossings Cir Unit E Boynton Beach, FL | 2.0 | 2.0 | 864 | $1,900 | $2.20 | 26d | 1 | 0.33mi |
| 14 Crossings Cir Unit E Boynton Beach, FL | 2.0 | 2.0 | 953 | $2,300 | $2.41 | 26d | 1 | 0.33mi |
| 117 Waterside Dr #117 Hypoluxo, FL | 2.0 | 2.0 | 768 | $2,000 | $2.60 | 26d | 1 | 0.34mi |
| 176 Waterside Dr Hypoluxo, FL | 3.0 | 2.0 | 1024 | $2,500 | $2.44 | 21d | 1 | 0.34mi |
| 977 Miner Rd Lantana, FL | 3.0 | 1.0 | 1100 | $3,195 | $2.90 | 4d | 1 | 0.35mi |
| 30 Crossings Cir Unit H Boynton Beach, FL | 2.0 | 2.0 | 864 | $2,400 | $2.78 | 20d | 1 | 0.35mi |
| 1219 Highland Rd Lantana, FL | 3.0 | 2.0 | 744 | $2,350 | $3.16 | 1d | 1 | 0.37mi |
| 1214 Highview Rd Lantana, FL | 3.0 | 2.0 | 768 | $2,300 | $2.99 | 4d | 1 | 0.39mi |
| 27 Crossings Cir Unit H Boynton Beach, FL | 2.0 | 2.0 | 864 | $1,900 | $2.20 | 17d | 1 | 0.40mi |
| 2202 NE 3rd St Boynton Beach, FL | 3.0 | 2.0 | 902 | $3,000 | $3.33 | 18d | 1 | 0.41mi |
| 24 Crossings Cir Unit H Boynton Beach, FL | 2.0 | 2.0 | 864 | $2,050 | $2.37 | 26d | 1 | 0.44mi |
| 2202 NE 4th St #10 Boynton Beach, FL | 2.0 | 1.0 | 757 | $1,900 | $2.51 | 5d | 1 | 0.46mi |
| 2100 N Seacrest Blvd Boynton Beach, FL | 3.0 | 1.0 | 1056 | $2,900 | $2.75 | 18d | 1 | 0.46mi |
| 108 NE 20th Ave #206 Boynton Beach, FL | 2.0 | 2.0 | 860 | $1,800 | $2.09 | 21d | 1 | 0.50mi |
| 3265 E Palm Dr Boynton Beach, FL | 3.0 | 2.0 | 744 | $2,600 | $3.49 | 26d | 1 | 0.57mi |
| 1097 Wilkinson Rd Unit B Lantana, FL | 2.0 | 1.0 | 855 | $2,200 | $2.57 | 4d | 1 | 0.62mi |
| 1097 Wilkinson Rd Unit B Lantana, FL | 2.0 | 1.0 | 855 | $2,200 | $2.57 | 3d | 1 | 0.62mi |
| 311 NE 17th Ave #204 Boynton Beach, FL | 2.0 | 2.0 | 1100 | $1,650 | $1.50 | 26d | 1 | 0.62mi |
| 2008 S Federal Hwy Unit C207 Boynton Beach, FL | 2.0 | 2.0 | 963 | $2,000 | $2.08 | 26d | 1 | 0.64mi |
| 410 NE 17th Ave #101 Boynton Beach, FL | 2.0 | 1.5 | 1080 | $1,500 | $1.39 | 9d | 1 | 0.65mi |
| 25 S Loafing St Unit 25 Hypoluxo, FL | 2.0 | 1.0 | 552 | $1,500 | $2.72 | 4d | 1 | 0.69mi |
| 25 S Loafing St Unit 25 Hypoluxo, FL | 2.0 | 1.0 | 552 | $1,500 | $2.72 | 26d | 1 | 0.69mi |
| 22 S Loafing St Hypoluxo, FL | 2.0 | 1.0 | 696 | $1,300 | $1.87 | 26d | 1 | 0.69mi |
| 640 Oak St Boynton Beach, FL | 2.0 | 1.0 | 765 | $2,690 | $3.52 | 9d | 1 | 0.73mi |
HOA detail condo
- Monthly dues
- $557 · $6,684/yr
- Assessments
- None detected in remarks — confirm with the listing agent.
Listing history 8 events
-
2026-06-21days on market $75,000 Active 13 DOM
-
2026-06-18days on market $75,000 Active 10 DOM
-
2026-06-17days on market $75,000 Active 9 DOM
-
2026-06-16days on market $75,000 Active 8 DOM
-
2026-06-15days on market $75,000 Active 7 DOM
-
2026-06-13days on market $75,000 Active 5 DOM
-
2026-06-09remarks 699-char remark
-
2026-06-09$75,000 Active 1 DOM
ⓘ Source: listings_history table (triggers on properties + properties_extension) + one-shot
backfill from property_details.listing_events for pre-trigger history.
Climate risk First Street
- Flood 1/10 Low FEMA zone X (unshaded) · 0% chance over 30 yrs
- Wildfire 1/10 Low
- Heat 9/10 Extreme 7 d/yr ≥105°F today · 26 d/yr by 30 yrs out
- Wind 10/10 Extreme 99% chance of damaging wind over 30 yrs
- Air quality 2/10 Low 0 unhealthy d/yr today · 2 by 30 yrs out
Nearby sold comps map
Loading sold comps map…
Walkable amenities ~0.75 mi
Loading nearby amenities…
Taxation est. · year 1
- Rental income
- $24,270
- − Mortgage interest
- −$4,201
- − Property taxes
- −$1,125
- − Insurance
- −$375
- − Repairs & maintenance
- −$1,942
- − Management
- −$1,942
- − HOA
- −$6,684
- − Depreciation
- −$2,182
- Taxable income
- $5,820
- Est. tax owed @ 24.0%
- −$1,397
- After-tax cash flow
- $4,873/yr
For passive investors: Depreciation is non-cash, so a rental often shows a tax loss while cash-flowing — sheltering income. Rental losses are passive: they offset passive income freely, and up to $25,000/yr can offset ordinary (W-2) income if you actively participate and your MAGI is under $100k (phasing out to $0 by $150k); unused losses carry forward. On sale, claimed depreciation is recaptured at up to 25%, and gains may owe capital-gains tax (a 1031 exchange can defer both). Figures are a year-1 estimate at your 24.0% rate — not tax advice; consult a CPA.
Condition & rehab AI · 12 photos
This 2-bedroom, 2-bath condo in a well-maintained 55+ active community requires moderate renovations to update the kitchen and bathroom, which would significantly increase its resale and rental value.
Repairs flagged
- Major kitchen cabinets — dated and in need of replacement
- Major kitchen appliances — outdated and in need of replacement
- Minor bathroom fixtures — basic and in need of updating
Value-add opportunities
- Resale update kitchen cabinets and appliances — modernizing the kitchen would attract more buyers
- Resale update bathroom fixtures — modernizing the bathroom would attract more buyers
- Both paint interior walls — improving the interior appearance would attract both buyers and renters
- Both replace carpet in living room — replacing the carpet would improve the living room's appearance and attract more renters
Renovation cost estimate screening
| Repair item | Severity | Est. cost |
|---|---|---|
| kitchen cabinets · dated and in need of replacement | Major | $15,000–50,000 |
| kitchen appliances · outdated and in need of replacement | Major | $15,000–50,000 |
| bathroom fixtures · basic and in need of updating | Minor | $500–3,000 |
| Total estimated repair cost · 3 items | $30,500–103,000 |
Value-add ROI direction
- Resale update kitchen cabinets and appliances — modernizing the kitchen would attract more buyers ↑
- Resale update bathroom fixtures — modernizing the bathroom would attract more buyers ↑
- Both paint interior walls — improving the interior appearance would attract both buyers and renters ↑
- Both replace carpet in living room — replacing the carpet would improve the living room's appearance and attract more renters ↑
ⓘ Cost ranges are severity-bucket heuristics (US national rule-of-thumb). Get contractor quotes + a written scope before underwriting a rehab budget.
Schools (NCES district)
- District
- Palm Beach
- NCES district ID
- 1201500
- Math proficiency
- 46% ▼ -16.00%
- Reading proficiency
- 53% ▼ -4.00%
- Median HH income
- $53,943
- Composite
- 42.72/100
- National rank
- #3160
- State rank
- #34 of 73 in FL
Livability — Boynton Beach
- Score
- 72/100
- State rank
- #351
- US rank
- #6098
Category grades
Schools grade is shown separately in the Schools card above.
Census & demographics
- Census place
- Boynton Beach, FL
- County
- Palm Beach County · 1,438,312 people
- City population
- 148,060
- Metro
- Miami-Fort Lauderdale-Pompano Beach, FL
- Population (ZIP)
- 37,833
- Household income
- $67,979
- Rent vs Own
- Severe rent burden
- 1623.0
Population outlook (Palm Beach County) Hauer SSP2
- Today (2025)
- 1,637,487 people
- By 2030
- 1,743,255 · +6.5%
- By 2040
- 1,948,712 · +19.0%
- By 2050
- 2,132,979 · +30.3%
- By 2075
- 2,530,027 · +54.5%
- By 2100
- 2,706,979 · +65.3%
Race, ethnicity, and origin ACS 2023
- Neighborhood character
- Diverse neighborhood (Simpson 0.65)
- Race & ethnicity
- White 41% Black 40% Hispanic / Latino 15% Two or more races 10%
- Hispanic origin (detail)
- Mexican 3% Puerto Rican 3% Cuban 2% Dominican 1%
- Common ancestry
- Hispanic 23% Romanian 2% Lithuanian 2%
- Foreign-born
- 30% · Canada, Jamaica
- Languages at home
- 61% English-only · French/Haitian/Cajun 24% Spanish 11% Other Indo-European 2%
Political lean MEDSL · Palm Beach
- 2024 margin
- Toss-up / Even · D 50.0% · R 49.2%
- 2008→2024 swing
- -22.1pp toward R · 2008: 22.9pp · 2024: 0.8pp
- All cycles
- 2024: D+0.8 2020: D+12.8 2016: D+15.3 2012: D+17.0 2008: D+22.9
Not yet ingested
- Civics
- —
Market trends
- HPI YoY
- ▼ -345.86%
- Current HPI
- 371.0527
- Rent YoY
- ▲ 3.64%
- Metro
- Miami-Fort Lauderdale-Pompano Beach, FL
- State GDP YoY
- ▲ 3.28%
- F500 in state
- 36
Industry mix (Fortune 500 HQ in FL)
| Industry | F500 HQs | Revenue |
|---|---|---|
| Industrial Technology | 2 | $29B |
|
||
| Insurance | 2 | $17B |
|
||
| Retail | 1 | $60B |
|
||
| Technology Distribution | 1 | $58B |
|
||
| Homebuilding | 1 | $35B |
|
||
| Technology Manufacturing | 1 | $35B |
|
||
Price history
+201.2% since first listed4 events — show timeline
- 2026-06-08 Listed $75,000 Beaches MLS
- 1998-12-14 Sold (MLS) $20,500 Beaches MLS
- 1998-12-03 Listing Removed — Beaches MLS
- 1998-08-29 Listed $24,900 Beaches MLS
Cash-flow waterfall
monthlySold comps — $/sqft
last 12 mo · ≤1 miLoading sold comps…