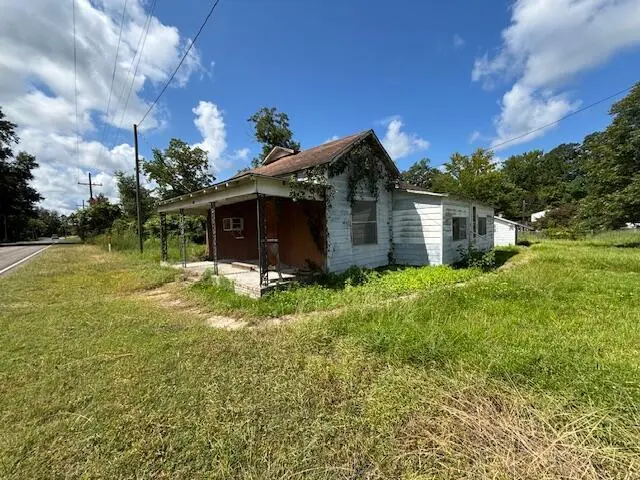
508 La-110 · Merryville, LA
Flood risk 3/10 · Minor
- FEMA flood zone
- X (unshaded)
- Chance of flooding over 30 yrs
- 0.2%
- Est. flood insurance / yr
- $507 – $1,088
Fire risk 3/10 · Minor
- Est. fire insurance / yr
- $1,269 – $2,357
Heat risk 8/10 · Major
- Hot days now (above 111°F)
- 7 days/yr
- Hot days in 30 yrs
- 22 days/yr
Wind risk 8/10 · Major
- Chance of severe wind over 30 yrs
- 99.0%
Air-quality risk 1/10 · Minimal
- Unhealthy air days now
- 0 days/yr
- Unhealthy air days in 30 yrs
- 0 days/yr
Risk factors via First Street. Map © Google.
Why this score? — see what drove the B grade
The composite is a weighted blend of 9 inputs, each scored 0–100. Each bar is that input's sub-score; the figure is the points it added to the 100-point composite (weight × sub-score).
- Cash flow +30.0/30.0
- 1% rule +10.0/10.0
- DSCR +10.0/10.0
- ARV discount +7.5/15.0
- Appreciation +4.5/10.0
- Livability +3.2/5.0
- Schools +3.0/10.0
- Rent growth +2.5/5.0
- Condition / age +1.0/5.0
$45,000
🖨 Deal sheet 📄 Offer letter ✓ Due diligence
Listing remarks MLS
This home is ready for a full remodel and offers tons of potential! Imagine the endless opportunities for customization, this property is perfect for investors and buyers looking for a perfect project!
Key facts
- 1 acre lot
- Listed 297 days
Neighborhood map
What this means for you Summary
Snapshot
- This is a 3-bed/1.0-bath single-family listed at $45k. Condition is rated poor.
Deal economics
- At list price, monthly cash flow is $615 ($7k/yr) — positive.
- The deal already cash-flows at list — no discount required.
- Meets the 1% rule at list price ($1k rent vs $45k).
- Recommended offer: $40k (12.0% below list) — sets the bar for market timing.
Location & tenants
- Location reads 63/100 on livability (#196 in LA) — a middle-class / working-renter tenant base. Strengths: cost of living A+, housing A, crime B; Watch: amenities F, commute F, employment F.
- Beauregard Parish (rural): math 30% / reading 41% proficiency, ranked #32 of 98 in LA (top 33%) — families likely to look elsewhere, expect single-tenant / working-renter base with shorter leases.
- Market conditions: 29 active listings in the ZIP; 83 units permitted in Beauregard Parish in 2024 (0 in 5+ unit buildings).
Forward outlook
- Local home prices are declining (-1.0%/yr); year-one equity from $311 of loan paydown is wiped out by about $434 of value loss. Plan a longer hold.
- At projected returns (-1.0% appreciation + 3.0% rent growth), your $13k cash investment doubles in ~2 years — after that, you're playing with house money.
Negotiation context
- It's been on market 298 days — a 12% lower offer ($40k) is reasonable based on typical stale-listing flexibility.
- 2 sale attempts with the ask held roughly flat each time — persistent listings suggest the price (not the market) is what's stuck; bring a comps-based counter.
Risks & watch-outs
- Climate carrying-cost: severe wind risk, 99% chance of damaging wind over 30y; extreme-heat days projected 7→22/yr by 2055 (HVAC capex compounding) — expect insurance premiums to compound above CPI over the hold.
Questions for the listing agent
- It's been on market 298 days. Have you received any prior offers? Is the seller open to a 12% concession, seller financing, or rate buy-down credit?
- Have any recent inspections been done? Can we get a copy of the seller's disclosures and any deferred-maintenance estimates?
- Why hasn't it sold? Are there any deal-killer items the seller is aware of (foundation, flood, title, zoning, code violations)?
- Is there a deadline driving the sale (1031 exchange, divorce, estate, relocation)? That informs how much negotiation room exists.
- What's the average days-on-market for RENTAL listings here right now (not sales)? A rising rental-DOM trend means longer vacancies and softer asking-rent achievability than the comps imply.
- What's the recent tenant-quality profile in this submarket — average credit score on applications, eviction rate, late-payment / NSF rate, and stable-employment percentage? A property-management company in the area should have these aggregated.
- How much new for-sale + rental construction is in the pipeline within 1–3 miles? Heavy new supply typically softens prices + rents 12–24 months out; constrained supply supports both.
Investment metrics
- 1% rule
- 2.61% ✓
- Cap rate
- 22.70%
- Cash-on-cash
- 58.61%
- DSCR
- 3.61
- GRM
- 3.2
CMA / ARV
- ARV (median comp)
- $116,146
- List price
- $45,000
- Delta
- -61.26%
- Verdict
- UNDERPRICED
- Comps
- 1 within 2.0 mi
Projected returns pro-forma
-0.97% appreciation · 3.0% rent growth · sell at horizon
- IRR
- 59.4%
- Equity multiple
- 3.85×
- Total profit
- $35,897
- Equity at exit
- $10,936
- IRR
- 62.4%
- Equity multiple
- 7.79×
- Total profit
- $85,541
- Equity at exit
- $11,546
Cash invested: $12,600 (down + closing). Projections, not guarantees.
Landlord ↔ Tenant lean methodology
- Overall (STATE)
- 90 Strongly Landlord-Friendly
- State Louisiana
- 90 Strongly Landlord-Friendly · R+12
- County
- — inherits STATE
- City
- — inherits STATE
ZIP-level market 70653
- Home prices YoY
- -1.6%
- Active inventory
- 29
- Price-to-rent
- 3.2×
Monthly cashflow live
- Estimated rent
- $1,173 medium interval (Pro) →
- Mortgage (P&I)
- −$236
- Tax est. 1.5%
- −$56 /mo · $675/yr
- Insurance
- −$19
- HOA
- −$0
- Vacancy / Maint / Mgmt
- −$246
- Net cashflow
- $615
Break-even live
UW: 25.0% down · 7.5% · 30yr · 1.5% tax · 5.0% vac · 8.0% maint · 8.0% mgmt
Financing live
Cash to close
- Down payment
- $11,250
- Closing costs
- $1,350
- Reserves months
- —
- Total cash needed
- —
Loan-product check · same deal, 3 products live
Conventional
25% down · 7.5% · 30yr
- Down + closing
- —
- Monthly P&I
- —
- Monthly cashflow
- —
- DSCR
- —
- Eligible?
- —
Personal DTI + credit; lowest rate.
DSCR
20% down · 8.5% · 30yr
- Down + closing
- —
- Monthly P&I
- —
- Monthly cashflow
- —
- DSCR
- —
- Eligible?
- —
No personal income docs; deal must DSCR.
Hard money
10% down · 12.0% · 12mo
- Down + closing
- —
- Monthly P&I
- —
- Monthly cashflow
- —
- DSCR
- —
- Eligible?
- —
Short-term bridge; refi at stabilization.
Listing history 18 events
-
2026-06-19days on market $45,000 Active 298 DOM
-
2026-06-18days on market $45,000 Active 297 DOM
-
2026-06-17days on market $45,000 Active 296 DOM
-
2026-06-16days on market $45,000 Active 295 DOM
-
2026-06-15days on market $45,000 Active 294 DOM
-
2026-06-14days on market $45,000 Active 292 DOM
-
2026-06-13days on market $45,000 Active 291 DOM
-
2026-06-10days on market $45,000 Active 289 DOM
-
2026-06-09days on market $45,000 Active 288 DOM
-
2026-06-08days on market $45,000 Active 287 DOM
-
2026-06-07days on market $45,000 Active 286 DOM
-
2026-06-03days on market $45,000 Active 282 DOM
-
2026-06-02days on market $45,000 Active 281 DOM
-
2026-06-01days on market $45,000 Active 280 DOM
-
2026-05-31days on market $45,000 Active 279 DOM
-
2026-05-30days on market $45,000 Active 278 DOM
-
2025-09-11$45,000 Active 201-char remark
Show marketing remark (201 chars)
This home is ready for a full remodel and offers tons of potential! Imagine the endless opportunities for customization, this property is perfect for investors and buyers looking for a perfect project!
-
2025-08-25$45,000 Active 201-char remark
Show marketing remark (201 chars)
This home is ready for a full remodel and offers tons of potential! Imagine the endless opportunities for customization, this property is perfect for investors and buyers looking for a perfect project!
ⓘ Source: listings_history table (triggers on properties + properties_extension) + one-shot
backfill from property_details.listing_events for pre-trigger history.
Climate risk First Street
- Flood 3/10 Moderate FEMA zone X (unshaded) · 20% chance over 30 yrs
- Wildfire 3/10 Moderate
- Heat 8/10 Severe 7 d/yr ≥111°F today · 22 d/yr by 30 yrs out
- Wind 8/10 Severe 99% chance of damaging wind over 30 yrs
- Air quality 1/10 Low 0 unhealthy d/yr today · 0 by 30 yrs out
Nearby sold comps map
Loading sold comps map…
Walkable amenities ~0.75 mi
Loading nearby amenities…
Taxation est. · year 1
- Rental income
- $14,072
- − Mortgage interest
- −$2,521
- − Property taxes
- −$675
- − Insurance
- −$225
- − Repairs & maintenance
- −$1,126
- − Management
- −$1,126
- − Depreciation
- −$1,309
- Taxable income
- $7,091
- Est. tax owed @ 24.0%
- −$1,702
- After-tax cash flow
- $5,684/yr
For passive investors: Depreciation is non-cash, so a rental often shows a tax loss while cash-flowing — sheltering income. Rental losses are passive: they offset passive income freely, and up to $25,000/yr can offset ordinary (W-2) income if you actively participate and your MAGI is under $100k (phasing out to $0 by $150k); unused losses carry forward. On sale, claimed depreciation is recaptured at up to 25%, and gains may owe capital-gains tax (a 1031 exchange can defer both). Figures are a year-1 estimate at your 24.0% rate — not tax advice; consult a CPA.
Condition & rehab AI · 13 photos
This home requires extensive repairs and updates to bring it up to a livable condition. The exterior siding, flooring, and walls are in poor condition, and the roof may also need attention. Upgrading these areas can significantly increase the home's value and make it more attractive to buyers and renters.
Repairs flagged
- Major Exterior siding — Peeling paint and overgrown vegetation indicate significant damage
- Major Kitchen flooring — Worn and dirty carpet with visible stains and wear
- Major Bathroom flooring — Dirty and outdated fixtures with visible stains and wear
- Major Interior walls — Worn and dirty walls with visible stains and wear
- Major Roof — No visible roof damage, but the overall condition of the exterior suggests potential issues
Value-add opportunities
- Both Exterior siding — A fresh coat of paint and new siding can significantly improve the curb appeal and value of the home
- Both Kitchen flooring — Replacing the worn carpet with a new, durable flooring option can improve the overall look and feel of the home
- Both Bathroom flooring — Upgrading the outdated fixtures and flooring in the bathroom can improve the overall look and functionality of the home
- Both Interior walls — Painting and possibly updating the interior walls can improve the overall look and feel of the home
- Both Roof — Re-roofing can improve the overall condition of the home and potentially increase its value
Renovation cost estimate screening
| Repair item | Severity | Est. cost |
|---|---|---|
| Exterior siding · Peeling paint and overgrown vegetation indicate significant damage | Major | $15,000–50,000 |
| Kitchen flooring · Worn and dirty carpet with visible stains and wear | Major | $15,000–50,000 |
| Bathroom flooring · Dirty and outdated fixtures with visible stains and wear | Major | $15,000–50,000 |
| Interior walls · Worn and dirty walls with visible stains and wear | Major | $15,000–50,000 |
| Roof · No visible roof damage, but the overall condition of the exterior suggests potential issues | Major | $15,000–50,000 |
| Total estimated repair cost · 5 items | $75,000–250,000 |
Value-add ROI direction
- Both Exterior siding — A fresh coat of paint and new siding can significantly improve the curb appeal and value of the home ↑
- Both Kitchen flooring — Replacing the worn carpet with a new, durable flooring option can improve the overall look and feel of the home ↑
- Both Bathroom flooring — Upgrading the outdated fixtures and flooring in the bathroom can improve the overall look and functionality of the home ↑
- Both Interior walls — Painting and possibly updating the interior walls can improve the overall look and feel of the home ↑
- Both Roof — Re-roofing can improve the overall condition of the home and potentially increase its value ↑
ⓘ Cost ranges are severity-bucket heuristics (US national rule-of-thumb). Get contractor quotes + a written scope before underwriting a rehab budget.
Schools (NCES district)
- District
- Beauregard Parish
- NCES district ID
- 2200180
- Math proficiency
- 30% ▼ -40.00%
- Reading proficiency
- 41% ▼ -35.00%
- Median HH income
- $46,033
- Composite
- 30.34/100
- National rank
- #6265
- State rank
- #32 of 98 in LA
Livability — Merryville
- Score
- 63/100
- State rank
- #196
- US rank
- #15511
Category grades
Schools grade is shown separately in the Schools card above.
Census & demographics
- Census place
- Merryville, LA
- Population (ZIP)
- 3,297
Population outlook (Beauregard County) Hauer SSP2
- Today (2025)
- 37,760 people
- By 2030
- 38,140 · +1.0%
- By 2040
- 38,518 · +2.0%
- By 2050
- 38,164 · +1.1%
- By 2075
- 36,437 · -3.5%
- By 2100
- 32,493 · -13.9%
Race, ethnicity, and origin ACS 2023
- Neighborhood character
- Predominantly White (90%)
- Race & ethnicity
- White 90% Black 6% Two or more races 3%
- Common ancestry
- Slovak 6% Lithuanian 5% Italian 3%
- Foreign-born
- 0%
- Languages at home
- 99% English-only · French/Haitian/Cajun 1% Spanish 0%
Political lean MEDSL · Beauregard
- 2024 margin
- Solid R (+71.3) · D 13.8% · R 85.1% · Other 1.1%
- 2008→2024 swing
- -16.9pp toward R · 2008: -54.3pp · 2024: -71.3pp
- All cycles
- 2024: R+71.3 2020: R+67.5 2016: R+65.3 2012: R+58.2 2008: R+54.3
Not yet ingested
- Civics
- —
Market trends
- HPI YoY
- ▼ -0.97%
- Current HPI
- 59.0168
- Rent YoY
- —
- Metro
- —
- State GDP YoY
- ▲ 3.29%
- F500 in state
- 10
Industry mix (Fortune 500 HQ in LA)
| Industry | F500 HQs | Revenue |
|---|---|---|
| Telecommunications | 2 | $23B |
|
||
| Utilities | 1 | $12B |
|
||
| Wholesale / Distribution | 1 | $5B |
|
||
| Advertising | 1 | $2B |
|
||
Price history
+0.0% since first listed2 events — show timeline
- 2025-09-11 Listed $45,000 SWLAR
- 2025-08-25 Listed $45,000 GFPAR
Cash-flow waterfall
monthlySold comps — $/sqft
last 12 mo · ≤1 miLoading sold comps…