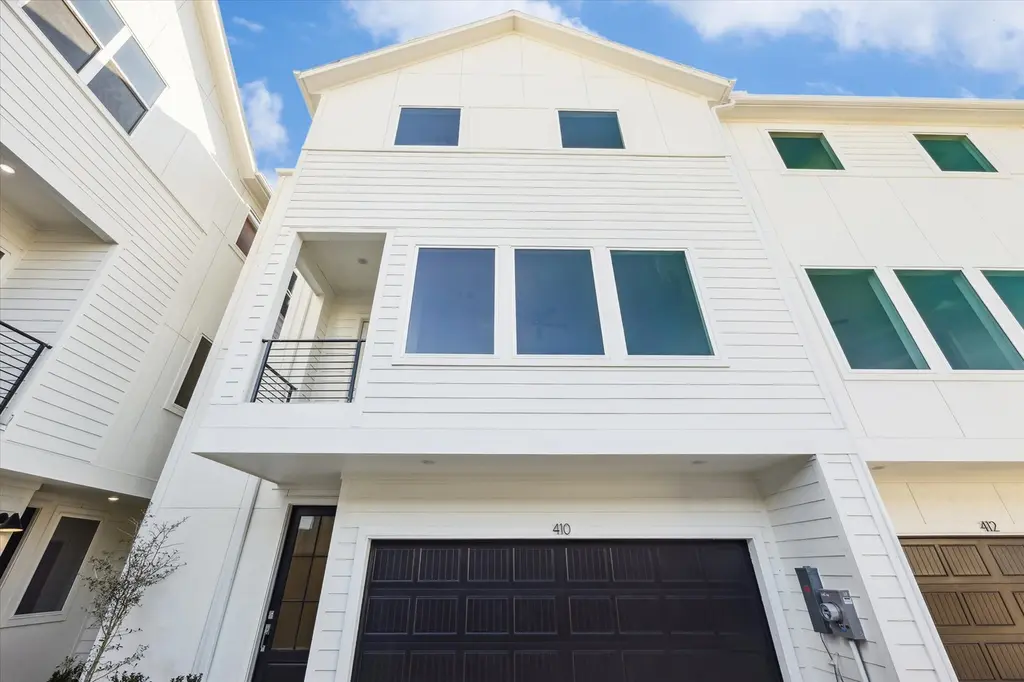
410 N Stiles St · Houston, TX
Flood risk No data
- FEMA flood zone
- —
- Chance of flooding over 30 yrs
- —
- Est. flood insurance / yr
- —
Fire risk No data
- Est. fire insurance / yr
- —
Heat risk No data
- Hot days now (above threshold)
- —
- Hot days in 30 yrs
- —
Wind risk No data
- Chance of severe wind over 30 yrs
- —
Air-quality risk No data
- Unhealthy air days now
- —
- Unhealthy air days in 30 yrs
- —
Risk factors via First Street. Map © Google.
Why this score? — see what drove the D grade
The composite is a weighted blend of 9 inputs, each scored 0–100. Each bar is that input's sub-score; the figure is the points it added to the 100-point composite (weight × sub-score).
- ARV discount +10.5/15.0
- Appreciation +10.0/10.0
- Cash flow +9.0/30.0
- Livability +3.7/5.0
- Schools +2.7/10.0
- DSCR +2.5/10.0
- Condition / age +2.5/5.0
- 1% rule +1.9/10.0
- Rent growth +1.8/5.0
$359,900
🖨 Deal sheet (PDF) 📄 Offer letter ✓ Due diligence
Listing remarks MLS
Welcome to North Bryan Park, a boutique community by City Choice Homes. This stylish three-story home offers 3 bedrooms and a spacious open-concept second floor designed for comfortable everyday living and entertaining. Beyond the home, you'll enjoy the vibrant lifestyle that the East End offers - easy access to downtown hot spots, amazing restaurants that are walk distance, and proximity to parks. Experience the perfect blend of a City Choice Home and a thriving community in this historic neighborhood. Tour the model home today!
Key facts
- 2 garage spots
- Built 2026
- Listed 72 days
Neighborhood map
What this means for you Summary
Snapshot
- This is a 3-bed/3.5-bath land listed at $360k.
Deal economics
- At list price, monthly cash flow is $-283 ($-3k/yr) — negative.
- To cash-flow at today's rent, offer at most $310k (13.9% below list).
- To meet the 1% rule (rent ≥ 1% of price), the offer needs to be $249k (30.9% below list).
- Recommended offer: $249k (30.9% below list) — sets the bar for 1% rule.
- Cap rate 5.3% vs local median 3.2% in Houston — top-decile yield for the area; either an underpriced asset or a hidden risk that comps aren't pricing in. Stress-test before assuming the spread holds.
Location & tenants
- Location reads 74/100 on livability (#184 in TX, #4,771 nationally) — a middle-class / working-renter tenant base. Strengths: amenities A+, cost of living A+, housing A+; Watch: crime F.
- Houston ISD (urban): math 27% / reading 35% proficiency, ranked #593 of 826 in TX (top 72%) — families likely to look elsewhere, expect single-tenant / working-renter base with shorter leases; 71% free/reduced lunch — lower-income household profile, screen leases tightly.
- Zoned schools: Burnet El (math 12% / reading 32%, grade F, #3,333 of 4,322 statewide, top 80%, 407 students, 91% FRL); Navarro Middle (math 8% / reading 13%, grade F, #1,639 of 1,662 statewide, top 99%, 547 students, 98% FRL); Austin H S (math 9% / reading 18%, grade F, #1,530 of 1,632 statewide, top 94%, 1,448 students, 97% FRL) — zoned schools average 96% FRL vs 71% district-wide (24 pts higher); higher-poverty schools than district average — tighter screening recommended.
- Zoned-school proficiency averages 15% at this address vs 31% district-wide (-16 pts) — the specific schools serving this property underperform the Houston ISD average; the district grade overstates school quality for this exact location.
- Market conditions: Rents soft (-2.9%/yr); 161 active listings in the ZIP; 23 comparable units currently listed for rent nearby; rentals leasing fast (median 9d on market — plan ~1-2 weeks tenant-placement turnaround); 29,883 units permitted in Harris County in 2024 (8,621 in 5+ unit buildings).
- At $2,486/mo this rent would consume 59% of the median local household income ($50k/yr) (locally 655% of renters already pay >50% of income on rent) — very limited rent-growth headroom before tenants either downsize or default.
Forward outlook
- In year one you build about $38k of equity ($2k loan paydown + $36k appreciation (10.0% local appreciation)).
- Harris County population projected at +47% by 2050 — long-run rental-demand tailwind backs the buy-and-hold thesis.
- By year 2, paydown + projected appreciation supports a ~$62k cash-out refi (75% LTV) — recoverable capital for the next deal without selling this one.
Negotiation context
- It's been on market 72 days — a 6% lower offer ($338k) is reasonable based on typical stale-listing flexibility.
- 2 sale attempts; this cycle's ask is 14441% above the opening price — seller raised mid-cycle; expect resistance to lowballs.
Questions for the listing agent
- What do current leases actually rent for vs. the listed asking? Can we see a recent rent roll and the last 12 months of T-12 income?
- It's been on market 72 days. Have you received any prior offers? Is the seller open to a 31% concession, seller financing, or rate buy-down credit?
- What does the HOA fee cover, when was the last increase, and are there any pending special assessments or reserve-fund shortfalls?
- Why hasn't it sold? Are there any deal-killer items the seller is aware of (foundation, flood, title, zoning, code violations)?
- Is there a deadline driving the sale (1031 exchange, divorce, estate, relocation)? That informs how much negotiation room exists.
- Schools are D-rated, which usually means shorter tenancies and higher turnover. Who's the typical renter profile here, and what's been the actual vacancy rate?
- Crime grade is F in this area — have there been break-ins, vandalism, or insurance claims at this property in the last 3 years? What carrier currently insures it and at what premium?
- The area grade is low — what's the realistic commute time and amenity access for the typical tenant pool here? Any planned neighborhood developments (good or bad) we should know about?
- What's the average days-on-market for RENTAL listings here right now (not sales)? A rising rental-DOM trend means longer vacancies and softer asking-rent achievability than the comps imply.
- What's the recent tenant-quality profile in this submarket — average credit score on applications, eviction rate, late-payment / NSF rate, and stable-employment percentage? A property-management company in the area should have these aggregated.
- How much new for-sale + rental construction is in the pipeline within 1–3 miles? Heavy new supply typically softens prices + rents 12–24 months out; constrained supply supports both.
Investment metrics
- 1% rule
- 0.69% ✗
- Cap rate
- 5.35%
- Cash-on-cash
- -3.37%
- DSCR
- 0.85
- GRM
- 12.1
CMA / ARV
- ARV (median comp)
- $385,820
- List price
- $359,900
- Delta
- -6.72%
- Verdict
- FAIR
- Comps
- 20 within 1.0 mi
Projected returns pro-forma
10.0% appreciation · 0.0% rent growth · sell at horizon
- IRR
- 21.1%
- Equity multiple
- 2.69×
- Total profit
- $170,568
- Equity at exit
- $324,226
- IRR
- 18.5%
- Equity multiple
- 5.99×
- Total profit
- $503,226
- Equity at exit
- $699,207
Cash invested: $100,772 (down + closing). Projections, not guarantees.
Landlord ↔ Tenant lean methodology
- Overall (STATE)
- 87 Strongly Landlord-Friendly
- State Texas
- 87 Strongly Landlord-Friendly · R+5
- County
- — inherits STATE
- City
- — inherits STATE
ZIP-level market 77011
- Home prices YoY
- 30.1%
- Rents YoY
- -2.9%
- Active inventory
- 161
- Price-to-rent
- 12.1×
Monthly cashflow live
- Estimated rent
- $2,486 high interval (Pro) →
- Mortgage (P&I)
- −$1,887
- Tax from tax record
- −$102 /mo · $1,220/yr
- Insurance
- −$150
- HOA
- −$108
- Vacancy / Maint / Mgmt
- −$522
- Net cashflow
- $-283
Break-even live
Sensitivity live
| Price | -10% $-80 | -5% $-182 | +0% $-283 | +5% $-385 | +10% $-487 |
|---|---|---|---|---|---|
| Rent | -10% $-480 | -5% $-382 | +0% $-283 | +5% $-185 | +10% $-87 |
| Rate | -1.0pp $-102 | -0.5pp $-192 | base $-283 | +0.5pp $-377 | +1.0pp $-472 |
UW: 25.0% down · 7.5% · 30yr · 1.5% tax · 5.0% vac · 8.0% maint · 8.0% mgmt
Financing live
Cash to close
- Down payment
- $89,975
- Closing costs
- $10,797
- Reserves months
- —
- Total cash needed
- —
Loan-product check · same deal, 3 products live
Conventional
25% down · 7.5% · 30yr
- Down + closing
- —
- Monthly P&I
- —
- Monthly cashflow
- —
- DSCR
- —
- Eligible?
- —
Personal DTI + credit; lowest rate.
DSCR
20% down · 8.5% · 30yr
- Down + closing
- —
- Monthly P&I
- —
- Monthly cashflow
- —
- DSCR
- —
- Eligible?
- —
No personal income docs; deal must DSCR.
Hard money
10% down · 12.0% · 12mo
- Down + closing
- —
- Monthly P&I
- —
- Monthly cashflow
- —
- DSCR
- —
- Eligible?
- —
Short-term bridge; refi at stabilization.
Rent comps 23 comps
| Address | Beds | Baths | Sqft | Rent | $/sqft | DOM | Units | Dist |
|---|---|---|---|---|---|---|---|---|
| 207 Edgewood St Houston, TX | 3.0 | 4.0 | 2577 | $3,250 | $1.26 | 45d | 1 | 0.42mi |
| 2 Jenkins St Houston, TX | 3.0 | 2.0 | 1242 | $2,250 | $1.81 | 45d | 1 | 0.47mi |
| 5502 Texas St Unit 1514806P Houston, TX | 3.0 | 2.5 | 1808 | $7,179 | $3.97 | 0d | 1 | 0.67mi |
| 5504 Texas St Unit 1514810P Houston, TX | 3.0 | 2.5 | 1808 | $7,146 | $3.95 | 0d | 1 | 0.68mi |
| 6403 Avenue C Unit 1019625P Houston, TX | 2.0–8.0 | 1.0–4.0 | 1232 | $3,836 | $3.11 | 0d | 2 | 0.94mi |
| 4952 Polk St Unit 1531100P Houston, TX | 1.0–2.0 | 1.0–2.0 | 1258 | $2,285 | $1.82 | 0d | 2 | 0.99mi |
| 4952 Polk St Unit 1531107P Houston, TX | 2.0 | 2.0 | 1980 | $2,327 | $1.18 | 9d | 1 | 0.99mi |
| 5121 Polk St Unit 1 Houston, TX | 2.0 | 1.0 | 1300 | $1,600 | $1.23 | 26d | 1 | 0.99mi |
| 4009 Lamar St Unit A Houston, TX | 2.0 | 2.0 | 1368 | $1,699 | $1.24 | 1d | 1 | 1.08mi |
| 800 Middle St Houston, TX | 1.0–4.0 | 1.0–2.0 | 1003 | $1,593 | $1.59 | 7d | 1 | 1.12mi |
| 4001 Dallas St Unit 1029264P Houston, TX | 3.0 | 3.0 | 2174 | $5,220 | $2.40 | 0d | 1 | 1.16mi |
| 308 Grove St Houston, TX | 3.0 | 3.0 | 1701 | $2,350 | $1.38 | 9d | 1 | 1.35mi |
| 3419 Gillespie St Houston, TX | 3.0 | 3.5 | 2168 | $2,300 | $1.06 | 45d | 1 | 1.40mi |
| 4109 Hare St Unit A Houston, TX | 4.0 | 2.5 | 1913 | $6,950 | $3.63 | 45d | 1 | 1.41mi |
| 4109 Hare St Unit 1019559P Houston, TX | 4.0 | 2.5 | 1905 | $6,852 | $3.60 | 9d | 1 | 1.41mi |
| 3226 McKinney St Houston, TX | 3.0 | 3.0 | 2274 | $2,500 | $1.10 | 45d | 1 | 1.41mi |
| 3410 Baer St Houston, TX | 3.0 | 4.0 | 2040 | $3,500 | $1.72 | 45d | 1 | 1.43mi |
| 2414 East Dr Unit Canal St unit Houston, TX | 3.0 | 3.5 | 2063 | $2,950 | $1.43 | 9d | 1 | 1.45mi |
| 2404 Navigation Blvd Unit 2187 Houston, TX | 2.0 | 2.0 | 1309 | $2,321 | $1.77 | 0d | 1 | 1.47mi |
| 2404 Navigation Blvd Unit 422 Houston, TX | 2.0 | 2.0 | 1309 | $2,296 | $1.75 | 9d | 1 | 1.47mi |
| 2404 Navigation Blvd Unit 2441 Houston, TX | 2.0 | 2.0 | 1309 | $2,280 | $1.74 | 0d | 1 | 1.47mi |
| 2404 Navigation Blvd Unit 424 Houston, TX | 2.0 | 2.0 | 1309 | $2,296 | $1.75 | 7d | 1 | 1.47mi |
| 2816 Rusk St Houston, TX | 3.0 | 3.5 | 2107 | $2,800 | $1.33 | 45d | 1 | 1.50mi |
HOA detail
- Monthly dues
- $108 · $1,296/yr
Listing history 15 events
-
2026-06-21days on market $359,900 Active 72 DOM
-
2026-06-18days on market $359,900 Active 69 DOM
-
2026-06-17days on market $359,900 Active 68 DOM
-
2026-06-16days on market $359,900 Active 67 DOM
-
2026-06-15days on market $359,900 Active 66 DOM
-
2026-06-13days on market $359,900 Active 64 DOM
-
2026-06-10days on market $359,900 Active 60 DOM
-
2026-06-08days on market $359,900 Active 59 DOM
-
2026-06-07days on market $359,900 Active 58 DOM
-
2026-06-04days on market $359,900 Active 55 DOM
-
2026-06-01days on market $359,900 Active 52 DOM
-
2026-05-31days on market $359,900 Active 51 DOM
-
2026-05-07historical $2,475
-
2026-04-17$2,475
-
2026-04-10$359,900 Active 535-char remark
Show marketing remark (535 chars)
Welcome to North Bryan Park, a boutique community by City Choice Homes. This stylish three-story home offers 3 bedrooms and a spacious open-concept second floor designed for comfortable everyday living and entertaining. Beyond the home, you'll enjoy the vibrant lifestyle that the East End offers - easy access to downtown hot spots, amazing restaurants that are walk distance, and proximity to parks. Experience the perfect blend of a City Choice Home and a thriving community in this historic neighborhood. Tour the model home today!
ⓘ Source: listings_history table (triggers on properties + properties_extension) + one-shot
backfill from property_details.listing_events for pre-trigger history.
Tax reassessment forecast TX · Resets to sale price
- Current annual tax
- $1,220 · $102/mo
- Projected year-2 tax
- $6,586 · $549/mo
- Expected delta
- +$5,367/yr (+$447/mo · 440.1%)
ⓘ Screening estimate from a state-policy table — verify with the county assessor before closing.
Nearby sold comps map
Loading sold comps map…
Walkable amenities ~0.75 mi
Loading nearby amenities…
Taxation est. · year 1
- Rental income
- $29,826
- − Mortgage interest
- −$20,160
- − Property taxes
- −$1,220
- − Insurance
- −$1,800
- − Repairs & maintenance
- −$2,386
- − Management
- −$2,386
- − HOA
- −$1,296
- − Depreciation
- −$10,470
- Taxable loss
- −$9,891
- Est. tax savings @ 24.0%
- +$2,374
- After-tax cash flow
- $-1,027/yr
For passive investors: Depreciation is non-cash, so a rental often shows a tax loss while cash-flowing — sheltering income. Rental losses are passive: they offset passive income freely, and up to $25,000/yr can offset ordinary (W-2) income if you actively participate and your MAGI is under $100k (phasing out to $0 by $150k); unused losses carry forward. On sale, claimed depreciation is recaptured at up to 25%, and gains may owe capital-gains tax (a 1031 exchange can defer both). Figures are a year-1 estimate at your 24.0% rate — not tax advice; consult a CPA.
Schools (NCES district)
- District
- Houston ISD
- NCES district ID
- 4823640
- Math proficiency
- 27% ▼ -18.00%
- Reading proficiency
- 35% ▼ -6.00%
- Median HH income
- $46,054
- Composite
- 26.63/100
- National rank
- #7173
- State rank
- #593 of 826 in TX
Livability — Houston
- Score
- 74/100
- State rank
- #184
- US rank
- #4771
Category grades
Schools grade is shown separately in the Schools card above.
Census & demographics
- Census place
- Houston, TX
- County
- Harris County · 4,702,590 people
- City population
- 3,226,434
- Metro
- Houston-The Woodlands-Sugar Land, TX
- Population (ZIP)
- 14,940
- Household income
- $50,133
- Rent vs Own
- Severe rent burden
- 655.0
Population outlook (Harris County) Hauer SSP2
- Today (2025)
- 5,571,493 people
- By 2030
- 6,089,821 · +9.3%
- By 2040
- 7,142,806 · +28.2%
- By 2050
- 8,185,864 · +46.9%
- By 2075
- 10,574,329 · +89.8%
- By 2100
- 12,109,958 · +117.4%
Race, ethnicity, and origin ACS 2023
- Neighborhood character
- Predominantly Hispanic (88%)
- Race & ethnicity
- Hispanic / Latino 88% Two or more races 29% White 7% Black 3%
- Hispanic origin (detail)
- Mexican 81%
- Foreign-born
- 33% · Canada
- Languages at home
- 24% English-only · Spanish 76%
Political lean MEDSL · Harris
- 2024 margin
- Lean D (+5.5) · D 52.0% · R 46.4% · Other 1.6%
- 2008→2024 swing
- +3.9pp toward D · 2008: 1.6pp · 2024: 5.5pp
- All cycles
- 2024: D+5.5 2020: D+13.3 2016: D+12.4 2012: D+0.1 2008: D+1.6
Not yet ingested
- Civics
- —
Market trends
- HPI YoY
- ▲ 68.18%
- Current HPI
- 295.1198
- Rent YoY
- ▼ -2.93%
- Metro
- Houston-The Woodlands-Sugar Land, TX
- State GDP YoY
- ▲ 3.95%
- F500 in state
- 110
Industry mix (Fortune 500 HQ in TX)
| Industry | F500 HQs | Revenue |
|---|---|---|
| Energy | 16 | $1,198B |
|
||
| Technology | 5 | $198B |
|
||
| Engineering / Construction | 4 | $72B |
|
||
| Energy Services | 3 | $60B |
|
||
| Utilities | 3 | $41B |
|
||
| Healthcare | 2 | $330B |
|
||
Price history
-99.3% since first listed3 events — show timeline
- 2026-05-07 Rental Removed $2,475 HARMLS
- 2026-04-17 Listed for Rent $2,475 HARMLS
- 2026-04-10 Listed $359,900 HARMLS
Property tax history
+5.1%/yrLatest (2025): $1,220 · +21.8% YoY. Source: county tax records.
Cash-flow waterfall
monthlySold comps — $/sqft
last 12 mo · ≤1 miLoading sold comps…