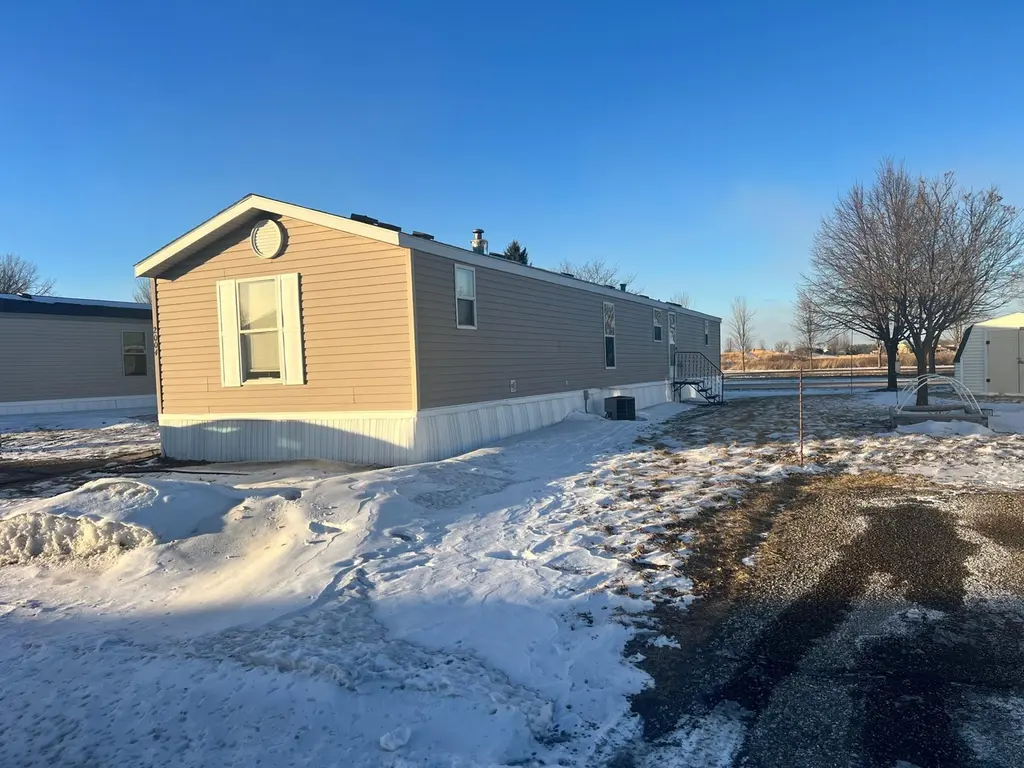
2004 Round Table Rd · North Mankato, MN
Flood risk 1/10 · Minimal
- FEMA flood zone
- X (unshaded)
- Chance of flooding over 30 yrs
- 0.0%
- Est. flood insurance / yr
- $507 – $1,088
Fire risk 3/10 · Minor
- Est. fire insurance / yr
- $888 – $1,650
Heat risk 2/10 · Minimal
- Hot days now (above 100°F)
- 7 days/yr
- Hot days in 30 yrs
- 15 days/yr
Wind risk 2/10 · Minimal
- Chance of severe wind over 30 yrs
- —
Air-quality risk 2/10 · Minimal
- Unhealthy air days now
- 1 days/yr
- Unhealthy air days in 30 yrs
- 1 days/yr
Risk factors via First Street. Map © Google.
Why this score? — see what drove the B grade
The composite is a weighted blend of 9 inputs, each scored 0–100. Each bar is that input's sub-score; the figure is the points it added to the 100-point composite (weight × sub-score).
- Cash flow +30.0/30.0
- 1% rule +10.0/10.0
- DSCR +10.0/10.0
- ARV discount +7.5/15.0
- Schools +4.4/10.0
- Livability +4.0/5.0
- Rent growth +2.5/5.0
- Condition / age +2.5/5.0
- Appreciation +0.0/10.0
$80,000
🖨 Deal sheet 📄 Offer letter ✓ Due diligence
Listing remarks MLS
Affordable mobile home in upper North Mankato. 3 bedrooms, 2 bathrooms. Newer appliances plus two sheds outside for added storage! Deck box stays with home as well as security system. Come take a look at this home before its gone!
Key facts
- 3,980 sq ft lot
- Built 2002
- Listed 136 days
Neighborhood map
What this means for you Summary
Snapshot
- This is a 3-bed/1.0-bath other listed at $80k.
Deal economics
- At list price, monthly cash flow is $887 ($11k/yr) — positive.
- The deal already cash-flows at list — no discount required.
- Meets the 1% rule at list price ($2k rent vs $80k).
- Recommended offer: $70k (12.0% below list) — sets the bar for market timing.
- Cap rate 19.6% vs local median 3.3% in North Mankato — top-decile yield for the area; either an underpriced asset or a hidden risk that comps aren't pricing in. Stress-test before assuming the spread holds.
Location & tenants
- Location reads 80/100 on livability (#71 in MN, #1,734 nationally) — a professional / high-income tenant draw. Strengths: schools A+, housing A+, crime A; Watch: amenities F, commute F.
- Mankato Public School District (urban): math 48% / reading 56% proficiency, ranked #98 of 301 in MN (top 33%) — acceptable for families but not a draw, mixed tenant base, ~2y average lease.
- Market conditions: 168 active listings in the ZIP; 5 comparable units currently listed for rent nearby; rentals lingering (median 44d on market — plan ~5-8 weeks vacancy on turnover, expect pricing pressure); 100% of comp listings sitting > 30 days — soft ceiling on asking rent; 109 units permitted in Nicollet County in 2024 (47 in 5+ unit buildings).
Forward outlook
- Local home prices are declining (-3.0%/yr); year-one equity from $553 of loan paydown is wiped out by about $2k of value loss. Plan a longer hold.
- At projected returns (-3.0% appreciation + 3.0% rent growth), your $22k cash investment doubles in ~3 years — after that, you're playing with house money.
Negotiation context
- It's been on market 137 days — a 12% lower offer ($70k) is reasonable based on typical stale-listing flexibility.
Questions for the listing agent
- It's been on market 137 days. Have you received any prior offers? Is the seller open to a 12% concession, seller financing, or rate buy-down credit?
- Why hasn't it sold? Are there any deal-killer items the seller is aware of (foundation, flood, title, zoning, code violations)?
- Is there a deadline driving the sale (1031 exchange, divorce, estate, relocation)? That informs how much negotiation room exists.
- Schools are A-rated — typically a magnet for longer-tenancy family renters. What's the average tenant stay here, and is there a school-zone premium baked into asking?
- What's the average days-on-market for RENTAL listings here right now (not sales)? A rising rental-DOM trend means longer vacancies and softer asking-rent achievability than the comps imply.
- What's the recent tenant-quality profile in this submarket — average credit score on applications, eviction rate, late-payment / NSF rate, and stable-employment percentage? A property-management company in the area should have these aggregated.
- How much new for-sale + rental construction is in the pipeline within 1–3 miles? Heavy new supply typically softens prices + rents 12–24 months out; constrained supply supports both.
Investment metrics
- 1% rule
- 2.16% ✓
- Cap rate
- 19.60%
- Cash-on-cash
- 47.53%
- DSCR
- 3.11
- GRM
- 3.9
CMA / ARV
- ARV (median comp)
- $263,382
- List price
- $80,000
- Delta
- -69.63%
- Verdict
- UNDERPRICED
- Comps
- 20 within 1.0 mi
Projected returns pro-forma
-3.0% appreciation · 3.0% rent growth · sell at horizon
- IRR
- 44.9%
- Equity multiple
- 2.94×
- Total profit
- $43,522
- Equity at exit
- $11,928
- IRR
- 50.8%
- Equity multiple
- 5.94×
- Total profit
- $110,571
- Equity at exit
- $6,917
Cash invested: $22,400 (down + closing). Projections, not guarantees.
Landlord ↔ Tenant lean methodology
- Overall (STATE)
- 46 Balanced
- State Minnesota
- 46 Balanced · D+2
- County
- — inherits STATE
- City
- — inherits STATE
ZIP-level market 56003
- Active inventory
- 168
- Price-to-rent
- 3.9×
Monthly cashflow live
- Estimated rent
- $1,725 high interval (Pro) →
- Mortgage (P&I)
- −$420
- Tax from tax record
- −$22 /mo · $270/yr
- Insurance
- −$33
- HOA
- −$0
- Vacancy / Maint / Mgmt
- −$362
- Net cashflow
- $887
Break-even live
UW: 25.0% down · 7.5% · 30yr · 1.5% tax · 5.0% vac · 8.0% maint · 8.0% mgmt
Financing live
Cash to close
- Down payment
- $20,000
- Closing costs
- $2,400
- Reserves months
- —
- Total cash needed
- —
Loan-product check · same deal, 3 products live
Conventional
25% down · 7.5% · 30yr
- Down + closing
- —
- Monthly P&I
- —
- Monthly cashflow
- —
- DSCR
- —
- Eligible?
- —
Personal DTI + credit; lowest rate.
DSCR
20% down · 8.5% · 30yr
- Down + closing
- —
- Monthly P&I
- —
- Monthly cashflow
- —
- DSCR
- —
- Eligible?
- —
No personal income docs; deal must DSCR.
Hard money
10% down · 12.0% · 12mo
- Down + closing
- —
- Monthly P&I
- —
- Monthly cashflow
- —
- DSCR
- —
- Eligible?
- —
Short-term bridge; refi at stabilization.
Rent comps 5 comps
| Address | Beds | Baths | Sqft | Rent | $/sqft | DOM | Units | Dist |
|---|---|---|---|---|---|---|---|---|
| 2306 Pleasant View Dr Unit 2306 North Mankato, MN | 3.0 | 2.0 | 1482 | $2,100 | $1.42 | 43d | 1 | 0.37mi |
| 2140 Rolling Green Trl Unit 2141 North Mankato, MN | 3.0 | 2.5 | 1440 | $1,850 | $1.28 | 43d | 1 | 0.40mi |
| 1628 Colony Ct Unit 8 North Mankato, MN | 2.0 | 1.0 | 900 | $900 | $1.00 | 43d | 1 | 1.15mi |
| 418 Allan Ave Unit 6 North Mankato, MN | 2.0 | 1.0 | 846 | $1,195 | $1.41 | 43d | 1 | 1.29mi |
| 414 Allan Ave North Mankato, MN | 2.0 | 1.0 | 818 | $1,195 | $1.46 | 43d | 2 | 1.32mi |
Listing history 18 events
-
2026-06-19days on market $80,000 Active 137 DOM
-
2026-06-18days on market $80,000 Active 136 DOM
-
2026-06-17days on market $80,000 Active 135 DOM
-
2026-06-16days on market $80,000 Active 134 DOM
-
2026-06-15days on market $80,000 Active 133 DOM
-
2026-06-14days on market $80,000 Active 131 DOM
-
2026-06-13days on market $80,000 Active 130 DOM
-
2026-06-10days on market $80,000 Active 128 DOM
-
2026-06-09days on market $80,000 Active 127 DOM
-
2026-06-08days on market $80,000 Active 126 DOM
-
2026-06-07days on market $80,000 Active 125 DOM
-
2026-06-05days on market $80,000 Active 122 DOM
-
2026-06-03days on market $80,000 Active 121 DOM
-
2026-06-02days on market $80,000 Active 120 DOM
-
2026-06-01days on market $80,000 Active 119 DOM
-
2026-05-31days on market $80,000 Active 118 DOM
-
2026-05-30days on market $80,000 Active 117 DOM
-
2026-02-02status Active 230-char remark
Show marketing remark (230 chars)
Affordable mobile home in upper North Mankato. 3 bedrooms, 2 bathrooms. Newer appliances plus two sheds outside for added storage! Deck box stays with home as well as security system. Come take a look at this home before its gone!
ⓘ Source: listings_history table (triggers on properties + properties_extension) + one-shot
backfill from property_details.listing_events for pre-trigger history.
Tax reassessment forecast MN · Partial reset (capped growth)
- Current annual tax
- $270 · $22/mo
- Projected year-2 tax
- $583 · $49/mo
- Expected delta
- +$313/yr (+$26/mo · 115.9%)
ⓘ Screening estimate from a state-policy table — verify with the county assessor before closing.
Climate risk First Street
- Flood 1/10 Low FEMA zone X (unshaded) · 0% chance over 30 yrs
- Wildfire 3/10 Moderate
- Heat 2/10 Low 7 d/yr ≥100°F today · 15 d/yr by 30 yrs out
- Wind 2/10 Low
- Air quality 2/10 Low 1 unhealthy d/yr today · 1 by 30 yrs out
Nearby sold comps map
Loading sold comps map…
Walkable amenities ~0.75 mi
Loading nearby amenities…
Taxation est. · year 1
- Rental income
- $20,697
- − Mortgage interest
- −$4,481
- − Property taxes
- −$270
- − Insurance
- −$400
- − Repairs & maintenance
- −$1,656
- − Management
- −$1,656
- − Depreciation
- −$2,327
- Taxable income
- $9,907
- Est. tax owed @ 24.0%
- −$2,378
- After-tax cash flow
- $8,269/yr
For passive investors: Depreciation is non-cash, so a rental often shows a tax loss while cash-flowing — sheltering income. Rental losses are passive: they offset passive income freely, and up to $25,000/yr can offset ordinary (W-2) income if you actively participate and your MAGI is under $100k (phasing out to $0 by $150k); unused losses carry forward. On sale, claimed depreciation is recaptured at up to 25%, and gains may owe capital-gains tax (a 1031 exchange can defer both). Figures are a year-1 estimate at your 24.0% rate — not tax advice; consult a CPA.
Schools (NCES district)
- District
- Mankato Public School District
- NCES district ID
- 2718780
- Math proficiency
- 48% ▼ -11.00%
- Reading proficiency
- 56% ▼ -8.00%
- Median HH income
- $49,469
- Composite
- 44.36/100
- National rank
- #2819
- State rank
- #98 of 301 in MN
Livability — North Mankato
- Score
- 80/100
- State rank
- #71
- US rank
- #1734
Category grades
Schools grade is shown separately in the Schools card above.
Census & demographics
- Census place
- North Mankato, MN
- Population (ZIP)
- 15,319
Population outlook (Nicollet County) Hauer SSP2
- Today (2025)
- 34,373 people
- By 2030
- 34,666 · +0.9%
- By 2040
- 34,616 · +0.7%
- By 2050
- 34,340 · -0.1%
- By 2075
- 33,171 · -3.5%
- By 2100
- 31,949 · -7.1%
Race, ethnicity, and origin ACS 2023
- Neighborhood character
- Predominantly White (87%)
- Race & ethnicity
- White 87% Two or more races 7% Hispanic / Latino 5% Black 2% Asian 2%
- Common ancestry
- Portuguese 14% Italian 4% Scottish 2%
- Foreign-born
- 3% · Canada, China
- Languages at home
- 96% English-only · Spanish 1% Other Indo-European 1%
Political lean MEDSL · Nicollet
- 2024 margin
- Toss-up / Even · D 48.8% · R 49.3% · Other 1.9%
- 2008→2024 swing
- -11.0pp toward R · 2008: 10.5pp · 2024: -0.5pp
- All cycles
- 2024: R+0.5 2020: D+3.2 2016: R+3.1 2012: D+7.9 2008: D+10.5
Not yet ingested
- Civics
- —
Market trends
- HPI YoY
- ▼ -138.37%
- Current HPI
- 165.5673
- Rent YoY
- —
- Metro
- —
- State GDP YoY
- ▲ 2.41%
- F500 in state
- 34
Industry mix (Fortune 500 HQ in MN)
| Industry | F500 HQs | Revenue |
|---|---|---|
| Healthcare | 2 | $407B |
|
||
| Retail | 2 | $150B |
|
||
| Consumer Goods | 2 | $32B |
|
||
| Industrial Machinery | 2 | $6B |
|
||
| Agriculture | 1 | $40B |
|
||
| Healthcare / Medical Devices | 1 | $32B |
|
||
Property tax history
+1.8%/yrLatest (2025): $270 · -4.9% YoY. Source: county tax records.
Cash-flow waterfall
monthlySold comps — $/sqft
last 12 mo · ≤1 miLoading sold comps…