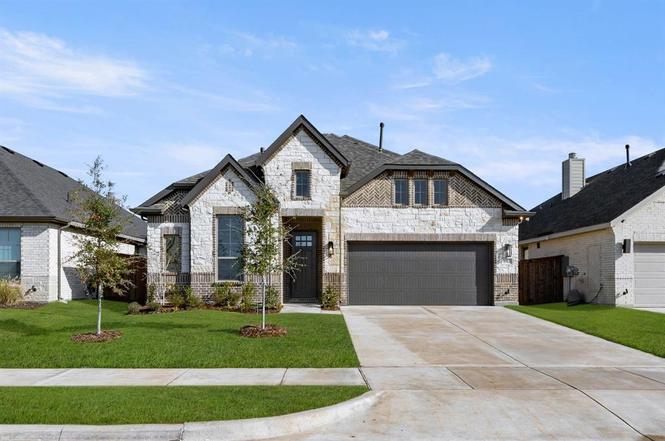
1913 Windsor · Mansfield, TX
Flood risk No data
- FEMA flood zone
- —
- Chance of flooding over 30 yrs
- —
- Est. flood insurance / yr
- —
Fire risk No data
- Est. fire insurance / yr
- —
Heat risk No data
- Hot days now (above threshold)
- —
- Hot days in 30 yrs
- —
Wind risk No data
- Chance of severe wind over 30 yrs
- —
Air-quality risk No data
- Unhealthy air days now
- —
- Unhealthy air days in 30 yrs
- —
Risk factors via First Street. Map © Google.
Why this score? — see what drove the D- grade
The composite is a weighted blend of 9 inputs, each scored 0–100. Each bar is that input's sub-score; the figure is the points it added to the 100-point composite (weight × sub-score).
- Appreciation +8.7/10.0
- ARV discount +7.6/15.0
- Cash flow +5.9/30.0
- Schools +4.6/10.0
- Livability +3.6/5.0
- Rent growth +3.1/5.0
- Condition / age +2.5/5.0
- 1% rule +1.5/10.0
- DSCR +0.3/10.0
$499,900
🖨 Deal sheet 📄 Offer letter ✓ Due diligence
Listing remarks
MLS# 21025828 - Built by J Houston Homes - Ready Now! ~ NEW JOHN HOUSTON HOME IN SOMERSET. This beautifully appointed 3 bedroom, 2.5 bathroom, and Game Room smart home offers comfort and convenience. As you step inside, you're greeted by a cozy wood-burning fireplace and large windows, making the living room feel spacious and inviting. The kitchen features a 36 gas cooktop, cabinets to the ceiling for extra storage, a wood-wrapped island, and a trash rollout. The primary suite is a true retreat, with it's generous bedroom layout, dual vanity with a shower, freestanding tub, and a spacious primary closet. You can find modern lightning and hardware throughout the home, making it feel elevated
Key facts
- Dual vanity
- 36 gas cooktop
- Wood wrapped island
Tags
Neighborhood map
What this means for you Summary
Snapshot
- This is a 3-bed/2.5-bath single-family listed at $500k.
Deal economics
- At list price, monthly cash flow is $-968 ($-12k/yr) — negative.
- To cash-flow at today's rent, offer at most $360k (28.0% below list).
- To meet the 1% rule (rent ≥ 1% of price), the offer needs to be $324k (35.1% below list).
- Recommended offer: $324k (35.1% below list) — sets the bar for 1% rule.
- Cap rate 4.0% vs local median 2.8% in Mansfield — top-decile yield for the area; either an underpriced asset or a hidden risk that comps aren't pricing in. Stress-test before assuming the spread holds.
Location & tenants
- Location reads 72/100 on livability (#243 in TX) — a middle-class / working-renter tenant base. Strengths: employment A+, housing A+, crime A; Watch: amenities F, commute F, health & safety D-.
- Mansfield ISD (suburban): math 47% / reading 53% proficiency, ranked #125 of 826 in TX (top 15%) — acceptable for families but not a draw, mixed tenant base, ~2y average lease.
- Zoned schools: Annette Perry El (math 44% / reading 41%, grade F, #1,313 of 4,322 statewide, top 31%, 522 students, 48% FRL).
- Market conditions: Rents rising (+2.4%/yr); 426 active listings in the ZIP; 6 comparable units currently listed for rent nearby; rentals at typical pace (median 24d on market — plan ~3-4 weeks tenant-placement turnaround); solid renter incomes; 2,152 units permitted in Johnson County in 2024 (76 in 5+ unit buildings).
- This rent runs 38% of the median local income ($102k/yr) — at the standard rent-burdened threshold; future hikes will face affordability resistance.
Forward outlook
- In year one you build about $40k of equity ($3k loan paydown + $37k appreciation (7.3% local appreciation)).
- Johnson County population projected at +24% by 2050 — long-run rental-demand tailwind backs the buy-and-hold thesis.
- By year 2, paydown + projected appreciation supports a ~$64k cash-out refi (75% LTV) — recoverable capital for the next deal without selling this one.
Negotiation context
- It's been on market 232 days — a 12% lower offer ($440k) is reasonable based on typical stale-listing flexibility.
Questions for the listing agent
- What do current leases actually rent for vs. the listed asking? Can we see a recent rent roll and the last 12 months of T-12 income?
- It's been on market 232 days. Have you received any prior offers? Is the seller open to a 35% concession, seller financing, or rate buy-down credit?
- What does the HOA fee cover, when was the last increase, and are there any pending special assessments or reserve-fund shortfalls?
- Why hasn't it sold? Are there any deal-killer items the seller is aware of (foundation, flood, title, zoning, code violations)?
- Is there a deadline driving the sale (1031 exchange, divorce, estate, relocation)? That informs how much negotiation room exists.
- Schools are A-rated — typically a magnet for longer-tenancy family renters. What's the average tenant stay here, and is there a school-zone premium baked into asking?
- The area grade is low — what's the realistic commute time and amenity access for the typical tenant pool here? Any planned neighborhood developments (good or bad) we should know about?
- What's the average days-on-market for RENTAL listings here right now (not sales)? A rising rental-DOM trend means longer vacancies and softer asking-rent achievability than the comps imply.
- What's the recent tenant-quality profile in this submarket — average credit score on applications, eviction rate, late-payment / NSF rate, and stable-employment percentage? A property-management company in the area should have these aggregated.
- How much new for-sale + rental construction is in the pipeline within 1–3 miles? Heavy new supply typically softens prices + rents 12–24 months out; constrained supply supports both.
Investment metrics
- 1% rule
- 0.65% ✗
- Cap rate
- 3.97%
- Cash-on-cash
- -8.30%
- DSCR
- 0.63
- GRM
- 12.8
CMA / ARV
- ARV (on-the-fly)
- $500,550
- Comps found
- 12
Show comp detail 12 sales within ~0.75 mi
| Address | Dist | Beds/Ba | Sqft | Sold | Price | $/sf | Match |
|---|---|---|---|---|---|---|---|
| 1913 Windsor | 0.00mi | 3/2.5 | 2,350 (0%) | 1mo | $499,900 | $213 | 99 |
| 2114 Redding Dr | 0.26mi | 4/3.0 (+1) | 2,253 (-4%) | 1mo | $493,990 | $219 | 74 |
| 2113 Ash Ct | 0.05mi | 4/3.0 (+1) | 2,591 (+10%) | 6mo | $509,990 | $197 | 68 |
| 2208 Birch St | 0.61mi | 4/2.5 (+1) | 2,367 (+1%) | 2mo | $599,990 | $253 | 64 |
| 2504 Veranda Way | 0.37mi | 4/3.0 (+1) | 2,524 (+7%) | 1mo | $459,900 | $182 | 63 |
| 2216 Wexley Dr | 0.08mi | 4/3.5 (+1) | 2,657 (+13%) | 5mo | $499,990 | $188 | 62 |
| 2415 Melrose Dr | 0.36mi | 3/2.5 | 2,595 (+10%) | 7mo | $537,990 | $207 | 60 |
| 2608 Acton Dr | 0.65mi | 4/3.0 (+1) | 2,253 (-4%) | 1mo | $522,990 | $232 | 55 |
| 2215 Birch St | 0.65mi | 4/2.5 (+1) | 2,230 (-5%) | 6mo | $524,990 | $235 | 52 |
| 2702 Vista Pkwy | 0.72mi | 4/3.0 (+1) | 2,476 (+5%) | 1mo | $520,000 | $210 | 50 |
| 2508 Lakeway Ln | 0.74mi | 3/3.0 | 2,527 (+8%) | 2mo | $554,990 | $220 | 49 |
| 1603 Birch St | 0.67mi | 4/3.0 (+1) | 2,678 (+14%) | 2mo | $515,000 | $192 | 37 |
Match score weights: distance 35% · size 25% · config 20% · recency 20%. Top-matched comps best support the ARV.
Projected returns pro-forma
7.32% appreciation · 2.39% rent growth · sell at horizon
- IRR
- 11.9%
- Equity multiple
- 1.86×
- Total profit
- $120,906
- Equity at exit
- $356,938
- IRR
- 12.4%
- Equity multiple
- 3.81×
- Total profit
- $392,971
- Equity at exit
- $687,771
Cash invested: $139,972 (down + closing). Projections, not guarantees.
Landlord ↔ Tenant lean methodology
- Overall (STATE)
- 87 Strongly Landlord-Friendly
- State Texas
- 87 Strongly Landlord-Friendly · R+5
- County
- — inherits STATE
- City
- — inherits STATE
ZIP-level market 76084
- Home prices YoY
- 2.1%
- Rents YoY
- 2.4%
- Active inventory
- 426
- Price-to-rent
- 12.8×
Monthly cashflow live
- Estimated rent
- $3,242 high interval (Pro) →
- Mortgage (P&I)
- −$2,622
- Tax est. 1.5%
- −$625 /mo · $7,498/yr
- Insurance
- −$208
- HOA
- −$75
- Vacancy / Maint / Mgmt
- −$681
- Net cashflow
- $-968
Break-even live
UW: 25.0% down · 7.5% · 30yr · 1.5% tax · 5.0% vac · 8.0% maint · 8.0% mgmt
Financing live
Cash to close
- Down payment
- $124,975
- Closing costs
- $14,997
- Reserves months
- —
- Total cash needed
- —
Loan-product check · same deal, 3 products live
Conventional
25% down · 7.5% · 30yr
- Down + closing
- —
- Monthly P&I
- —
- Monthly cashflow
- —
- DSCR
- —
- Eligible?
- —
Personal DTI + credit; lowest rate.
DSCR
20% down · 8.5% · 30yr
- Down + closing
- —
- Monthly P&I
- —
- Monthly cashflow
- —
- DSCR
- —
- Eligible?
- —
No personal income docs; deal must DSCR.
Hard money
10% down · 12.0% · 12mo
- Down + closing
- —
- Monthly P&I
- —
- Monthly cashflow
- —
- DSCR
- —
- Eligible?
- —
Short-term bridge; refi at stabilization.
Rent comps 6 comps
| Address | Beds | Baths | Sqft | Rent | $/sqft | DOM | Units | Dist |
|---|---|---|---|---|---|---|---|---|
| 1612 Birch St Mansfield, TX | 4.0 | 3.0 | 2593 | $3,399 | $1.31 | 24d | 1 | 0.65mi |
| 2614 High Bluff Dr Mansfield, TX | 4.0 | 3.0 | 2852 | $3,600 | $1.26 | 12d | 1 | 0.85mi |
| 2309 Lannister St Mansfield, TX | 4.0 | 2.0 | 2174 | $3,300 | $1.52 | 43d | 1 | 1.01mi |
| 1702 Swayback Ln Mansfield, TX | 4.0 | 3.5 | 2694 | $3,900 | $1.45 | 1d | 1 | 1.22mi |
| 1824 Buckeye Ln Mansfield, TX | 4.0 | 2.5 | 2230 | $3,500 | $1.57 | 1d | 1 | 1.23mi |
| 1505 Misty Pasture Way Mansfield, TX | 4.0 | 3.0 | 2428 | $3,650 | $1.50 | 24d | 1 | 1.38mi |
HOA detail
- Monthly dues
- $75 · $900/yr
- Likely covers
- trashgas
Listing history 11 events
-
2026-03-27status Pending
-
2026-02-02price $499,900
-
2026-01-31price $509,900
-
2026-01-08price $499,900
-
2025-12-19price $509,900
-
2025-12-04price $514,900
-
2025-11-13price $519,900
-
2025-10-30price $524,900
-
2025-10-16price $529,900
-
2025-09-18price $534,900
-
2025-08-07$539,990 Active
ⓘ Source: listings_history table (triggers on properties + properties_extension) + one-shot
backfill from property_details.listing_events for pre-trigger history.
Nearby sold comps map
Loading sold comps map…
Walkable amenities ~0.75 mi
Loading nearby amenities…
Taxation est. · year 1
- Rental income
- $38,909
- − Mortgage interest
- −$28,002
- − Property taxes
- −$7,498
- − Insurance
- −$2,500
- − Repairs & maintenance
- −$3,113
- − Management
- −$3,113
- − HOA
- −$900
- − Depreciation
- −$14,543
- Taxable loss
- −$20,759
- Est. tax savings @ 24.0%
- +$4,982
- After-tax cash flow
- $-6,636/yr
For passive investors: Depreciation is non-cash, so a rental often shows a tax loss while cash-flowing — sheltering income. Rental losses are passive: they offset passive income freely, and up to $25,000/yr can offset ordinary (W-2) income if you actively participate and your MAGI is under $100k (phasing out to $0 by $150k); unused losses carry forward. On sale, claimed depreciation is recaptured at up to 25%, and gains may owe capital-gains tax (a 1031 exchange can defer both). Figures are a year-1 estimate at your 24.0% rate — not tax advice; consult a CPA.
Schools (NCES district)
- District
- Mansfield ISD
- NCES district ID
- 4828920
- Math proficiency
- 47% ▼ -17.00%
- Reading proficiency
- 53% ▼ -6.00%
- Median HH income
- $81,934
- Composite
- 45.82/100
- National rank
- #2558
- State rank
- #125 of 826 in TX
Livability — Mansfield
- Score
- 72/100
- State rank
- #243
- US rank
- #5833
Category grades
Schools grade is shown separately in the Schools card above.
Census & demographics
- Census place
- Mansfield, TX
- County
- Johnson County · 147,987 people
- City population
- 82,625
- Metro
- Dallas-Fort Worth-Arlington, TX
- Population (ZIP)
- 14,097
- Household income
- $102,115
- Rent vs Own
- Severe rent burden
- 70.0
Population outlook (Johnson County) Hauer SSP2
- Today (2025)
- 179,678 people
- By 2030
- 189,208 · +5.3%
- By 2040
- 207,261 · +15.4%
- By 2050
- 223,064 · +24.1%
- By 2075
- 259,979 · +44.7%
- By 2100
- 275,395 · +53.3%
Race, ethnicity, and origin ACS 2023
- Neighborhood character
- Diverse neighborhood (Simpson 0.63)
- Race & ethnicity
- White 52% Hispanic / Latino 30% Two or more races 24% Black 11% Asian 1%
- Hispanic origin (detail)
- Mexican 25% Puerto Rican 1%
- Common ancestry
- Romanian 2% Lithuanian 1% Slovak 1%
- Foreign-born
- 8% · Canada
- Languages at home
- 78% English-only · Spanish 18% Arabic 1% French/Haitian/Cajun 1%
Political lean MEDSL · Johnson
- 2024 margin
- Solid R (+51.4) · D 23.9% · R 75.3%
- 2008→2024 swing
- -3.9pp toward R · 2008: -47.5pp · 2024: -51.4pp
- All cycles
- 2024: R+51.4 2020: R+53.0 2016: R+58.3 2012: R+55.6 2008: R+47.5
Not yet ingested
- Civics
- —
Market trends
- HPI YoY
- ▲ 7.32%
- Current HPI
- 355.74
- Rent YoY
- ▲ 2.39%
- Metro
- Dallas-Fort Worth-Arlington, TX
- State GDP YoY
- ▲ 3.95%
- F500 in state
- 110
Industry mix (Fortune 500 HQ in TX)
| Industry | F500 HQs | Revenue |
|---|---|---|
| Energy | 16 | $1,198B |
|
||
| Technology | 5 | $198B |
|
||
| Engineering / Construction | 4 | $72B |
|
||
| Energy Services | 3 | $60B |
|
||
| Utilities | 3 | $41B |
|
||
| Healthcare | 2 | $330B |
|
||
Price history
-7.4% since first listed11 events — show timeline
- 2026-03-27 Pending — NTREIS
- 2026-02-02 Price Changed $499,900 NTREIS
- 2026-01-31 Price Changed $509,900 NTREIS
- 2026-01-08 Price Changed $499,900 NTREIS
- 2025-12-19 Price Changed $509,900 NTREIS
- 2025-12-04 Price Changed $514,900 NTREIS
- 2025-11-13 Price Changed $519,900 NTREIS
- 2025-10-30 Price Changed $524,900 NTREIS
- 2025-10-16 Price Changed $529,900 NTREIS
- 2025-09-18 Price Changed $534,900 NTREIS
- 2025-08-07 Listed $539,990 NTREIS
Cash-flow waterfall
monthlySold comps — $/sqft
last 12 mo · ≤1 miLoading sold comps…