 🏷️ Likely Rental
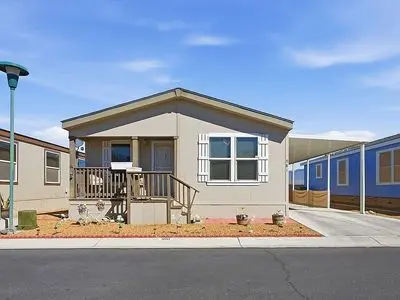
981 Montecito Dr · Pahrump, NV
Flood risk 1/10 · Minimal
- FEMA flood zone
- X (shaded)
- Chance of flooding over 30 yrs
- 0.0%
- Est. flood insurance / yr
- $507 – $1,088
Fire risk 5/10 · Moderate
- Est. fire insurance / yr
- $490 – $910
Heat risk 7/10 · Major
- Hot days now (above 103°F)
- 7 days/yr
- Hot days in 30 yrs
- 18 days/yr
Wind risk 1/10 · Minimal
- Chance of severe wind over 30 yrs
- —
Air-quality risk 1/10 · Minimal
- Unhealthy air days now
- 0 days/yr
- Unhealthy air days in 30 yrs
- 0 days/yr
Risk factors via First Street. Map © Google.
Why this score? — see what drove the C grade
The composite is a weighted blend of 9 inputs, each scored 0–100. Each bar is that input's sub-score; the figure is the points it added to the 100-point composite (weight × sub-score).
- Cash flow +19.7/30.0
- ARV discount +15.0/15.0
- DSCR +6.2/10.0
- 1% rule +4.4/10.0
- Livability +3.4/5.0
- Rent growth +3.2/5.0
- Condition / age +2.5/5.0
- Schools +2.2/10.0
- Appreciation +0.0/10.0
$140,000
🖨 Deal sheet 📄 Offer letter ✓ Due diligence
Listing remarks MLS
Inexpensive opportunity awaits with this 2018 model in the highly desired Desert Greens community! This 55+ community offers plenty of great amenities including golf, pool, spa, and bocci ball court. 2BR 2BA and easy to maintain! This home has a land lease of $425/month.
Key facts
- Built 2018
Neighborhood map
What this means for you Summary
Snapshot
- This is a 2-bed/1.0-bath manufactured listed at $140k.
Deal economics
- At list price, monthly cash flow is $165 ($2k/yr) — positive.
- The deal already cash-flows at list — no discount required.
- To meet the 1% rule (rent ≥ 1% of price), the offer needs to be $132k (6.0% below list).
- Recommended offer: $132k (6.0% below list) — sets the bar for 1% rule.
- Cap rate 7.7% vs local median 3.4% in Pahrump — top-decile yield for the area; either an underpriced asset or a hidden risk that comps aren't pricing in. Stress-test before assuming the spread holds.
Location & tenants
- Location reads 68/100 on livability (#30 in NV) — a middle-class / working-renter tenant base. Strengths: cost of living A+, housing A+, health & safety A+; Watch: employment D, schools F, crime F.
- Nye County School District (rural): math 20% / reading 33% proficiency, ranked #16 of 17 in NV (top 94%) — low school quality limits family demand, transient renter base, plan for 1-2y turnover.
- Market conditions: Rents rising (+2.7%/yr); 1116 active listings in the ZIP; 9 comparable units currently listed for rent nearby; rentals lingering (median 44d on market — plan ~5-8 weeks vacancy on turnover, expect pricing pressure); 100% of comp listings sitting > 30 days — soft ceiling on asking rent.
Forward outlook
- Local home prices are declining (-3.0%/yr); year-one equity from $968 of loan paydown is wiped out by about $4k of value loss. Plan a longer hold.
- Nye County population projected at -28% by 2050 — secular population decline; favor cash flow + early exit over multi-decade hold.
Negotiation context
- Only 0 days on market — expect competitive offers; lowballing is unlikely to land.
- 6 sale attempts since 8y ago with the ask held roughly flat each time — persistent listings suggest the price (not the market) is what's stuck; bring a comps-based counter.
- Current owner paid $115k; 22% above their basis — modest negotiation headroom, anchor on the comps not their cost.
Risks & watch-outs
- Climate carrying-cost: moderate wildfire risk; extreme-heat days projected 7→18/yr by 2055 (HVAC capex compounding) — expect insurance premiums to compound above CPI over the hold.
Questions for the listing agent
- Is there a deadline driving the sale (1031 exchange, divorce, estate, relocation)? That informs how much negotiation room exists.
- Schools are F-rated, which usually means shorter tenancies and higher turnover. Who's the typical renter profile here, and what's been the actual vacancy rate?
- Crime grade is F in this area — have there been break-ins, vandalism, or insurance claims at this property in the last 3 years? What carrier currently insures it and at what premium?
- What's the average days-on-market for RENTAL listings here right now (not sales)? A rising rental-DOM trend means longer vacancies and softer asking-rent achievability than the comps imply.
- What's the recent tenant-quality profile in this submarket — average credit score on applications, eviction rate, late-payment / NSF rate, and stable-employment percentage? A property-management company in the area should have these aggregated.
- How much new for-sale + rental construction is in the pipeline within 1–3 miles? Heavy new supply typically softens prices + rents 12–24 months out; constrained supply supports both.
Investment metrics
- 1% rule
- 0.94% ✗
- Cap rate
- 7.71%
- Cash-on-cash
- 5.06%
- DSCR
- 1.22
- GRM
- 8.9
CMA / ARV
- ARV (on-the-fly)
- $181,440
- Comps found
- 12
Show comp detail 12 sales within ~0.75 mi
| Address | Dist | Beds/Ba | Sqft | Sold | Price | $/sf | Match |
|---|---|---|---|---|---|---|---|
| 356 Saint Andrew St | 0.13mi | 2/2.0 | 1,032 (+2%) | 6mo | $170,000 | $165 | 81 |
| 410 Bel Air Ave | 0.18mi | 2/2.0 | 1,053 (+4%) | 0mo | $218,000 | $207 | 80 |
| 211 Montecito Dr | 0.19mi | 2/2.0 | 960 (-5%) | 2mo | $165,000 | $172 | 78 |
| 359 Saint Andrew St | 0.12mi | 2/2.0 | 995 (-1%) | 13mo | $140,000 | $141 | 77 |
| 251 Montecito Dr | 0.22mi | 2/2.0 | 1,063 (+6%) | 3mo | $179,000 | $168 | 74 |
| 440 Brentwood Dr | 0.23mi | 2/2.0 | 1,020 (+1%) | 12mo | $226,000 | $222 | 74 |
| 581 Montecito Dr | 0.26mi | 2/2.0 | 1,056 (+5%) | 4mo | $190,000 | $180 | 72 |
| 361 Montecito Dr | 0.25mi | 2/2.0 | 1,064 (+6%) | 5mo | $187,500 | $176 | 71 |
| 416 Bel Air Ave | 0.18mi | 2/2.0 | 1,056 (+5%) | 12mo | $205,000 | $194 | 69 |
| 310 Lafayette St | 0.41mi | 3/2.0 (+1) | 940 (-7%) | 4mo | $243,000 | $259 | 57 |
| 300 Montecito Dr | 0.22mi | 2/2.0 | 1,149 (+14%) | 8mo | $200,000 | $174 | 56 |
| 640 Alaska Way | 0.53mi | 2/2.0 | 920 (-9%) | 10mo | $210,000 | $228 | 49 |
Match score weights: distance 35% · size 25% · config 20% · recency 20%. Top-matched comps best support the ARV.
Projected returns pro-forma
-3.0% appreciation · 2.73% rent growth · sell at horizon
- IRR
- -8.8%
- Equity multiple
- 0.68×
- Total profit
- $-12,561
- Equity at exit
- $20,874
- IRR
- 0.4%
- Equity multiple
- 1.03×
- Total profit
- $1,000
- Equity at exit
- $12,105
Cash invested: $39,200 (down + closing). Projections, not guarantees.
Landlord ↔ Tenant lean methodology
- Overall (STATE)
- 71 Landlord-Friendly
- State Nevada
- 71 Landlord-Friendly · R+1
- County
- — inherits STATE
- City
- — inherits STATE
ZIP-level market 89048
- Home prices YoY
- -7.2%
- Rents YoY
- 2.7%
- Active inventory
- 1116
- Price-to-rent
- 8.9×
Monthly cashflow live
- Estimated rent
- $1,316 high interval (Pro) →
- Mortgage (P&I)
- −$734
- Tax from tax record
- −$82 /mo · $988/yr
- Insurance
- −$58
- HOA
- −$0
- Vacancy / Maint / Mgmt
- −$276
- Net cashflow
- $165
Break-even live
UW: 25.0% down · 7.5% · 30yr · 1.5% tax · 5.0% vac · 8.0% maint · 8.0% mgmt
Financing live
Cash to close
- Down payment
- $35,000
- Closing costs
- $4,200
- Reserves months
- —
- Total cash needed
- —
Loan-product check · same deal, 3 products live
Conventional
25% down · 7.5% · 30yr
- Down + closing
- —
- Monthly P&I
- —
- Monthly cashflow
- —
- DSCR
- —
- Eligible?
- —
Personal DTI + credit; lowest rate.
DSCR
20% down · 8.5% · 30yr
- Down + closing
- —
- Monthly P&I
- —
- Monthly cashflow
- —
- DSCR
- —
- Eligible?
- —
No personal income docs; deal must DSCR.
Hard money
10% down · 12.0% · 12mo
- Down + closing
- —
- Monthly P&I
- —
- Monthly cashflow
- —
- DSCR
- —
- Eligible?
- —
Short-term bridge; refi at stabilization.
Rent comps 9 comps
| Address | Beds | Baths | Sqft | Rent | $/sqft | DOM | Units | Dist |
|---|---|---|---|---|---|---|---|---|
| 551 Piltz Rd Pahrump, NV | 3.0 | 2.0 | 891 | $1,450 | $1.63 | 43d | 1 | 1.17mi |
| 1111 Sixshooter Ave Unit 3C Pahrump, NV | 2.0 | 2.0 | 910 | $1,150 | $1.26 | 43d | 1 | 1.18mi |
| 1081 Quartzite Ave #2 Pahrump, NV | 2.0 | 2.0 | 984 | $1,245 | $1.27 | 43d | 1 | 1.22mi |
| 452 Comstock St Pahrump, NV | 3.0 | 2.0 | 1211 | $1,250 | $1.03 | 43d | 1 | 1.24mi |
| 1080 S Potro Ave #3 Pahrump, NV | 2.0 | 2.0 | 984 | $1,245 | $1.27 | 43d | 1 | 1.25mi |
| 1480 W Irons St Pahrump, NV | 2.0 | 2.0 | 980 | $1,600 | $1.63 | 43d | 1 | 1.27mi |
| 1420 Ogallala St #2 Pahrump, NV | 3.0 | 2.0 | 1200 | $1,250 | $1.04 | 43d | 1 | 1.35mi |
| 1401 Ogallala St Unit 4 Pahrump, NV | 3.0 | 2.0 | 1009 | $1,350 | $1.34 | 43d | 1 | 1.38mi |
| 1041 Marne Ct Unit 4 Pahrump, NV | 2.0 | 2.0 | 901 | $1,235 | $1.37 | 43d | 1 | 1.42mi |
Listing history 16 events
-
2026-05-26$140,000
-
2024-03-19soldstatus $115,000 Closed 271-char remark
Show marketing remark (271 chars)
Inexpensive opportunity awaits with this 2018 model in the highly desired Desert Greens community! This 55+ community offers plenty of great amenities including golf, pool, spa, and bocci ball court. 2BR 2BA and easy to maintain! This home has a land lease of $425/month.
-
2024-02-29historical Active Under Contract 271-char remark
Show marketing remark (271 chars)
Inexpensive opportunity awaits with this 2018 model in the highly desired Desert Greens community! This 55+ community offers plenty of great amenities including golf, pool, spa, and bocci ball court. 2BR 2BA and easy to maintain! This home has a land lease of $425/month.
-
2024-02-13$119,900 Active 271-char remark
Show marketing remark (271 chars)
Inexpensive opportunity awaits with this 2018 model in the highly desired Desert Greens community! This 55+ community offers plenty of great amenities including golf, pool, spa, and bocci ball court. 2BR 2BA and easy to maintain! This home has a land lease of $425/month.
-
2024-02-06historical
-
2024-01-08price $124,900
-
2023-12-20$130,000 Active
-
2023-04-21historical
-
2023-04-05price $127,500
-
2023-03-01$137,500 Active
-
2018-11-01soldstatus $116,900 Sold
-
2018-08-23historical Contingent Offer
-
2018-06-20status Active
-
2018-06-19historical Contingent Offer
-
2018-06-15$116,990 Active
-
2016-05-04soldstatus $970,000
ⓘ Source: listings_history table (triggers on properties + properties_extension) + one-shot
backfill from property_details.listing_events for pre-trigger history.
Tax reassessment forecast NV · Resets to sale price
- Current annual tax
- $988 · $82/mo
- Projected year-2 tax
- $988 · $82/mo
- Expected delta
- $0/yr ($0/mo · 0.0%)
ⓘ Screening estimate from a state-policy table — verify with the county assessor before closing.
Climate risk First Street
- Flood 1/10 Low FEMA zone X (shaded) · 0% chance over 30 yrs
- Wildfire 5/10 Major
- Heat 7/10 Severe 7 d/yr ≥103°F today · 18 d/yr by 30 yrs out
- Wind 1/10 Low
- Air quality 1/10 Low 0 unhealthy d/yr today · 0 by 30 yrs out
Nearby sold comps map
Loading sold comps map…
Walkable amenities ~0.75 mi
Loading nearby amenities…
Taxation est. · year 1
- Rental income
- $15,797
- − Mortgage interest
- −$7,842
- − Property taxes
- −$988
- − Insurance
- −$700
- − Repairs & maintenance
- −$1,264
- − Management
- −$1,264
- − Depreciation
- −$4,073
- Taxable loss
- −$333
- Est. tax savings @ 24.0%
- +$80
- After-tax cash flow
- $2,062/yr
For passive investors: Depreciation is non-cash, so a rental often shows a tax loss while cash-flowing — sheltering income. Rental losses are passive: they offset passive income freely, and up to $25,000/yr can offset ordinary (W-2) income if you actively participate and your MAGI is under $100k (phasing out to $0 by $150k); unused losses carry forward. On sale, claimed depreciation is recaptured at up to 25%, and gains may owe capital-gains tax (a 1031 exchange can defer both). Figures are a year-1 estimate at your 24.0% rate — not tax advice; consult a CPA.
Schools (NCES district)
- District
- Nye County School District
- NCES district ID
- 3200360
- Math proficiency
- 20% ▼ -6.00%
- Reading proficiency
- 33% ▼ -5.00%
- Median HH income
- $41,447
- Composite
- 22.43/100
- National rank
- #8110
- State rank
- #16 of 17 in NV
Livability — Pahrump
- Score
- 68/100
- State rank
- #30
- US rank
- #9226
Category grades
Schools grade is shown separately in the Schools card above.
Census & demographics
- Census place
- Pahrump, NV
- County
- Nye County · 47,491 people
- City population
- 47,491
- Metro
- Pahrump, NV
- Population (ZIP)
- 26,486
- Household income
- $61,367
- Rent vs Own
- Severe rent burden
- 939.0
Population outlook (Nye County) Hauer SSP2
- Today (2025)
- 40,727 people
- By 2030
- 38,812 · -4.7%
- By 2040
- 33,952 · -16.6%
- By 2050
- 29,393 · -27.8%
- By 2075
- 21,122 · -48.1%
- By 2100
- 14,400 · -64.6%
Race, ethnicity, and origin ACS 2023
- Neighborhood character
- Predominantly White (71%)
- Race & ethnicity
- White 71% Hispanic / Latino 13% Two or more races 12% Black 3% Asian 2% Native American 1%
- Hispanic origin (detail)
- Mexican 8%
- Common ancestry
- Lithuanian 3% Slovak 3% Serbian 2%
- Foreign-born
- 8% · Canada, South Korea
- Languages at home
- 89% English-only · Spanish 9% Tagalog/Filipino 1%
Political lean MEDSL · Nye
- 2024 margin
- Solid R (+42.2) · D 28.0% · R 70.2% · Other 1.8%
- 2008→2024 swing
- -28.8pp toward R · 2008: -13.4pp · 2024: -42.2pp
- All cycles
- 2024: R+42.2 2020: R+40.4 2016: R+42.0 2012: R+24.2 2008: R+13.4
Not yet ingested
- Civics
- —
Market trends
- HPI YoY
- ▼ -21.52%
- Current HPI
- 277.4486
- Rent YoY
- ▲ 2.73%
- Metro
- Pahrump, NV
- State GDP YoY
- ▲ 3.08%
- F500 in state
- 6
Industry mix (Fortune 500 HQ in NV)
| Industry | F500 HQs | Revenue |
|---|---|---|
| Hotels / Casinos | 3 | $36B |
|
||
Price history
-85.6% since first listed16 events — show timeline
- 2026-05-26 Listed $140,000 FSBO.com
- 2024-03-19 Sold (MLS) $115,000 GLVAR
- 2024-02-29 Contingent — GLVAR
- 2024-02-13 Listed $119,900 GLVAR
- 2024-02-06 Listing Removed — GLVAR
- 2024-01-08 Price Changed $124,900 GLVAR
- 2023-12-20 Listed $130,000 GLVAR
- 2023-04-21 Listing Removed — GLVAR
- 2023-04-05 Price Changed $127,500 GLVAR
- 2023-03-01 Listed $137,500 GLVAR
- 2018-11-01 Sold (MLS) $116,900 GLVAR
- 2018-08-23 Contingent — GLVAR
- 2018-06-20 Relisted — GLVAR
- 2018-06-19 Contingent — GLVAR
- 2018-06-15 Listed $116,990 GLVAR
- 2016-05-04 Sold (Public Records) $970,000 Public Records
Property tax history
+25.1%/yrLatest (2025): $988 · +3.4% YoY. Source: county tax records.
Cash-flow waterfall
monthlySold comps — $/sqft
last 12 mo · ≤1 miLoading sold comps…