 🏷️ Likely Rental
523 & 525 Shady Oaks Harbor Rd · Liverpool, TX
Flood risk No data
- FEMA flood zone
- —
- Chance of flooding over 30 yrs
- —
- Est. flood insurance / yr
- —
Fire risk No data
- Est. fire insurance / yr
- —
Heat risk No data
- Hot days now (above threshold)
- —
- Hot days in 30 yrs
- —
Wind risk No data
- Chance of severe wind over 30 yrs
- —
Air-quality risk No data
- Unhealthy air days now
- —
- Unhealthy air days in 30 yrs
- —
Risk factors via First Street. Map © Google.
Why this score? — see what drove the B- grade
The composite is a weighted blend of 9 inputs, each scored 0–100. Each bar is that input's sub-score; the figure is the points it added to the 100-point composite (weight × sub-score).
- Cash flow +30.0/30.0
- DSCR +10.0/10.0
- 1% rule +9.5/10.0
- ARV discount +7.5/15.0
- Schools +3.9/10.0
- Livability +3.2/5.0
- Rent growth +3.0/5.0
- Condition / age +1.0/5.0
- Appreciation +0.0/10.0
$115,000
🖨 Deal sheet 📄 Offer letter ✓ Due diligence
Listing remarks MLS
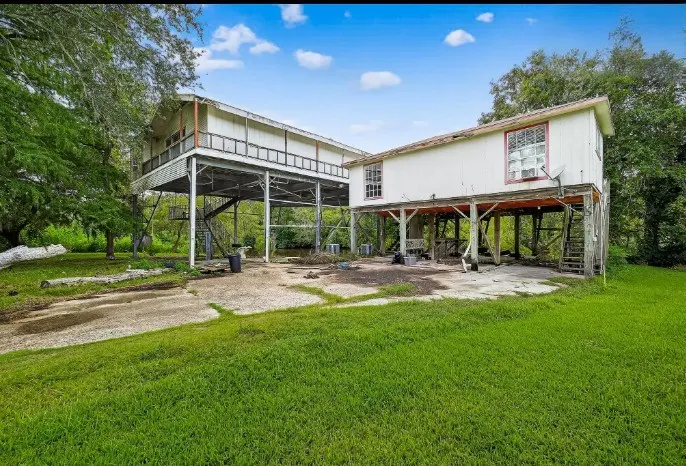
WATERFRONT INVESTMENT OPPORTUNITY – TWO PROPERTIES INCLUDED! Rare chance to purchase 523 & 525 Shady Oaks in Alvin, TX, sold together as a package. Situated along the scenic Corner Bayou this unique property features water access with a private dock and boat launch. Both homes are elevated approximately 25 feet on heavy-duty steel piers and beams. Investor special—both properties require full renovation and are ideal for a flip, rental, or redevelopment project. 525 Shady Oaks was previously rented month-to-month for $1,150. Tax IDs: 7521-0046-001 & 7521-0046-000. Use caution when accessing the property, especially stairs and deck areas. Enter at your own risk. Appointment required. Buyer to independently verify all measurements and property details.
Key facts
- Elevated on piers
- Private dock
- Boat launch
Tags
Neighborhood map
What this means for you Summary
Snapshot
- This is a 3-bed/3.0-bath single-family listed at $115k. Condition is rated poor.
Deal economics
- At list price, monthly cash flow is $518 ($6k/yr) — positive.
- The deal already cash-flows at list — no discount required.
- Meets the 1% rule at list price ($2k rent vs $115k).
- Recommended offer: $108k (6.0% below list) — sets the bar for market timing.
Location & tenants
- Location reads 65/100 on livability (#707 in TX) — a middle-class / working-renter tenant base. Strengths: crime A+, cost of living A+, housing A+; Watch: employment C-, schools F, amenities F.
- Alvin ISD (suburban): math 39% / reading 48% proficiency, ranked #255 of 826 in TX (top 31%) — families likely to look elsewhere, expect single-tenant / working-renter base with shorter leases.
- Market conditions: Rents rising (+1.9%/yr); 589 active listings in the ZIP; 3,960 units permitted in Brazoria County in 2024 (593 in 5+ unit buildings).
Forward outlook
- Local home prices are declining (-3.0%/yr); year-one equity from $795 of loan paydown is wiped out by about $3k of value loss. Plan a longer hold.
- Brazoria County population projected at +44% by 2050 — long-run rental-demand tailwind backs the buy-and-hold thesis.
- At projected returns (-3.0% appreciation + 1.9% rent growth), your $32k cash investment doubles in ~7 years — after that, you're playing with house money.
Negotiation context
- It's been on market 66 days — a 6% lower offer ($108k) is reasonable based on typical stale-listing flexibility.
Questions for the listing agent
- It's been on market 66 days. Have you received any prior offers? Is the seller open to a 6% concession, seller financing, or rate buy-down credit?
- Have any recent inspections been done? Can we get a copy of the seller's disclosures and any deferred-maintenance estimates?
- Built in 1969 — when were the roof, HVAC, electrical panel, plumbing, and water heater last replaced?
- Why hasn't it sold? Are there any deal-killer items the seller is aware of (foundation, flood, title, zoning, code violations)?
- Is there a deadline driving the sale (1031 exchange, divorce, estate, relocation)? That informs how much negotiation room exists.
- Schools are F-rated, which usually means shorter tenancies and higher turnover. Who's the typical renter profile here, and what's been the actual vacancy rate?
- What's the average days-on-market for RENTAL listings here right now (not sales)? A rising rental-DOM trend means longer vacancies and softer asking-rent achievability than the comps imply.
- What's the recent tenant-quality profile in this submarket — average credit score on applications, eviction rate, late-payment / NSF rate, and stable-employment percentage? A property-management company in the area should have these aggregated.
- How much new for-sale + rental construction is in the pipeline within 1–3 miles? Heavy new supply typically softens prices + rents 12–24 months out; constrained supply supports both.
Investment metrics
- 1% rule
- 1.45% ✓
- Cap rate
- 11.70%
- Cash-on-cash
- 19.32%
- DSCR
- 1.86
- GRM
- 5.8
CMA / ARV
- ARV (median comp)
- $271,106
- List price
- $115,000
- Delta
- -57.58%
- Verdict
- UNDERPRICED
- Comps
- 16 within 1.0 mi
Show comp detail 1 sale within ~0.75 mi
| Address | Dist | Beds/Ba | Sqft | Sold | Price | $/sf | Match |
|---|---|---|---|---|---|---|---|
| 74 Lazy Oak Ct | 0.23mi | 3/2.0 | 1,514 (+4%) | 24mo | $250,000 | $165 | 59 |
Match score weights: distance 35% · size 25% · config 20% · recency 20%. Top-matched comps best support the ARV.
Projected returns pro-forma
-3.0% appreciation · 1.87% rent growth · sell at horizon
- IRR
- 10.0%
- Equity multiple
- 1.39×
- Total profit
- $12,535
- Equity at exit
- $17,147
- IRR
- 18.2%
- Equity multiple
- 2.43×
- Total profit
- $46,032
- Equity at exit
- $9,943
Cash invested: $32,200 (down + closing). Projections, not guarantees.
Landlord ↔ Tenant lean methodology
- Overall (STATE)
- 87 Strongly Landlord-Friendly
- State Texas
- 87 Strongly Landlord-Friendly · R+5
- County
- — inherits STATE
- City
- — inherits STATE
ZIP-level market 77511
- Home prices YoY
- -18.6%
- Rents YoY
- 1.9%
- Active inventory
- 589
- Price-to-rent
- 5.8×
Monthly cashflow live
- Estimated rent
- $1,662 medium interval (Pro) →
- Mortgage (P&I)
- −$603
- Tax est. 1.5%
- −$144 /mo · $1,725/yr
- Insurance
- −$48
- HOA
- −$0
- Vacancy / Maint / Mgmt
- −$349
- Net cashflow
- $518
Break-even live
UW: 25.0% down · 7.5% · 30yr · 1.5% tax · 5.0% vac · 8.0% maint · 8.0% mgmt
Financing live
Cash to close
- Down payment
- $28,750
- Closing costs
- $3,450
- Reserves months
- —
- Total cash needed
- —
Loan-product check · same deal, 3 products live
Conventional
25% down · 7.5% · 30yr
- Down + closing
- —
- Monthly P&I
- —
- Monthly cashflow
- —
- DSCR
- —
- Eligible?
- —
Personal DTI + credit; lowest rate.
DSCR
20% down · 8.5% · 30yr
- Down + closing
- —
- Monthly P&I
- —
- Monthly cashflow
- —
- DSCR
- —
- Eligible?
- —
No personal income docs; deal must DSCR.
Hard money
10% down · 12.0% · 12mo
- Down + closing
- —
- Monthly P&I
- —
- Monthly cashflow
- —
- DSCR
- —
- Eligible?
- —
Short-term bridge; refi at stabilization.
Listing history 16 events
-
2026-06-18days on market $115,000 Active 66 DOM
-
2026-06-17days on market $115,000 Active 65 DOM
-
2026-06-16days on market $115,000 Active 64 DOM
-
2026-06-15days on market $115,000 Active 63 DOM
-
2026-06-13days on market $115,000 Active 61 DOM
-
2026-06-13days on market $115,000 Active 60 DOM
-
2026-06-09days on market $115,000 Active 57 DOM
-
2026-06-08days on market $115,000 Active 56 DOM
-
2026-06-07days on market $115,000 Active 55 DOM
-
2026-06-04days on market $115,000 Active 52 DOM
-
2026-06-03days on market $115,000 Active 51 DOM
-
2026-06-02days on market $115,000 Active 50 DOM
-
2026-06-01days on market $115,000 Active 49 DOM
-
2026-05-31days on market $115,000 Active 48 DOM
-
2026-05-04price $115,000 789-char remark
Show marketing remark (789 chars)
WATERFRONT INVESTMENT OPPORTUNITY – TWO PROPERTIES INCLUDED! Rare chance to purchase 523 & 525 Shady Oaks in Alvin, TX, sold together as a package. Situated along the scenic Corner Bayou this unique property features water access with a private dock and boat launch. Both homes are elevated approximately 25 feet on heavy-duty steel piers and beams. Investor special—both properties require full renovation and are ideal for a flip, rental, or redevelopment project. 525 Shady Oaks was previously rented month-to-month for $1,150. Tax IDs: 7521-0046-001 & 7521-0046-000. Use caution when accessing the property, especially stairs and deck areas. Enter at your own risk. Appointment required. Buyer to independently verify all measurements and property details.
-
2026-04-13$130,000 Active 789-char remark
Show marketing remark (789 chars)
WATERFRONT INVESTMENT OPPORTUNITY – TWO PROPERTIES INCLUDED! Rare chance to purchase 523 & 525 Shady Oaks in Alvin, TX, sold together as a package. Situated along the scenic Corner Bayou this unique property features water access with a private dock and boat launch. Both homes are elevated approximately 25 feet on heavy-duty steel piers and beams. Investor special—both properties require full renovation and are ideal for a flip, rental, or redevelopment project. 525 Shady Oaks was previously rented month-to-month for $1,150. Tax IDs: 7521-0046-001 & 7521-0046-000. Use caution when accessing the property, especially stairs and deck areas. Enter at your own risk. Appointment required. Buyer to independently verify all measurements and property details.
ⓘ Source: listings_history table (triggers on properties + properties_extension) + one-shot
backfill from property_details.listing_events for pre-trigger history.
Nearby sold comps map
Loading sold comps map…
Walkable amenities ~0.75 mi
Loading nearby amenities…
Taxation est. · year 1
- Rental income
- $19,946
- − Mortgage interest
- −$6,442
- − Property taxes
- −$1,725
- − Insurance
- −$575
- − Repairs & maintenance
- −$1,596
- − Management
- −$1,596
- − Depreciation
- −$3,345
- Taxable income
- $4,667
- Est. tax owed @ 24.0%
- −$1,120
- After-tax cash flow
- $5,100/yr
For passive investors: Depreciation is non-cash, so a rental often shows a tax loss while cash-flowing — sheltering income. Rental losses are passive: they offset passive income freely, and up to $25,000/yr can offset ordinary (W-2) income if you actively participate and your MAGI is under $100k (phasing out to $0 by $150k); unused losses carry forward. On sale, claimed depreciation is recaptured at up to 25%, and gains may owe capital-gains tax (a 1031 exchange can defer both). Figures are a year-1 estimate at your 24.0% rate — not tax advice; consult a CPA.
Condition & rehab AI · 12 photos
This property requires extensive renovation and repair, including exterior siding, roof, flooring, interior walls, HVAC, and landscaping. Significant investment is needed to bring it up to a livable condition.
Repairs flagged
- Major Exterior siding — Severe weathering and damage
- Major Roof — Exposed beams and structural issues
- Major Flooring — Exposed beams and structural issues
- Major Interior walls/paint — Exposed beams and structural issues
- Major HVAC/mechanicals — Exposed beams and structural issues
- Major Landscaping — Overgrown vegetation and general disrepair
Value-add opportunities
- Both Exterior siding and roof repair — Improves curb appeal and structural integrity
- Both Interior wall and paint repair — Enhances interior aesthetics and value
- Both HVAC and mechanical upgrades — Improves comfort and energy efficiency
- Both Landscaping and curb appeal improvements — Enhances overall property value and appeal
Renovation cost estimate screening
| Repair item | Severity | Est. cost |
|---|---|---|
| Exterior siding · Severe weathering and damage | Major | $15,000–50,000 |
| Roof · Exposed beams and structural issues | Major | $15,000–50,000 |
| Flooring · Exposed beams and structural issues | Major | $15,000–50,000 |
| Interior walls/paint · Exposed beams and structural issues | Major | $15,000–50,000 |
| HVAC/mechanicals · Exposed beams and structural issues | Major | $15,000–50,000 |
| Landscaping · Overgrown vegetation and general disrepair | Major | $15,000–50,000 |
| Total estimated repair cost · 6 items | $90,000–300,000 |
Value-add ROI direction
- Both Exterior siding and roof repair — Improves curb appeal and structural integrity ↑
- Both Interior wall and paint repair — Enhances interior aesthetics and value ↑
- Both HVAC and mechanical upgrades — Improves comfort and energy efficiency ↑
- Both Landscaping and curb appeal improvements — Enhances overall property value and appeal ↑
ⓘ Cost ranges are severity-bucket heuristics (US national rule-of-thumb). Get contractor quotes + a written scope before underwriting a rehab budget.
Schools (NCES district)
- District
- Alvin ISD
- NCES district ID
- 4808090
- Math proficiency
- 39% ▼ -11.00%
- Reading proficiency
- 48% ▬ 0.00%
- Median HH income
- $66,740
- Composite
- 38.96/100
- National rank
- #4080
- State rank
- #255 of 826 in TX
Livability — Liverpool
- Score
- 65/100
- State rank
- #707
- US rank
- #13166
Category grades
Schools grade is shown separately in the Schools card above.
Census & demographics
- County
- Brazoria County · 374,982 people
- Metro
- Houston-The Woodlands-Sugar Land, TX
- Population (ZIP)
- 51,892
- Household income
- $74,939
- Rent vs Own
- Severe rent burden
- 923.0
Population outlook (Brazoria County) Hauer SSP2
- Today (2025)
- 420,414 people
- By 2030
- 457,585 · +8.8%
- By 2040
- 532,232 · +26.6%
- By 2050
- 605,399 · +44.0%
- By 2075
- 779,358 · +85.4%
- By 2100
- 883,759 · +110.2%
Race, ethnicity, and origin ACS 2023
- Neighborhood character
- Diverse neighborhood (Simpson 0.58)
- Race & ethnicity
- White 50% Hispanic / Latino 41% Two or more races 21% Black 5% Asian 1%
- Hispanic origin (detail)
- Mexican 34%
- Common ancestry
- Lithuanian 3% Italian 2% Iranian 1%
- Foreign-born
- 13% · Canada, China, Jamaica
- Languages at home
- 71% English-only · Spanish 27% Other Asian/Pacific 1%
Political lean MEDSL · Brazoria
- 2024 margin
- R (+19.7) · D 39.5% · R 59.2% · Other 1.3%
- 2008→2024 swing
- +9.9pp toward D · 2008: -29.6pp · 2024: -19.7pp
- All cycles
- 2024: R+19.7 2020: R+18.2 2016: R+24.6 2012: R+34.2 2008: R+29.6
Not yet ingested
- Civics
- —
Market trends
- HPI YoY
- ▼ -63.72%
- Current HPI
- 278.5745
- Rent YoY
- ▲ 1.87%
- Metro
- Houston-The Woodlands-Sugar Land, TX
- State GDP YoY
- ▲ 3.95%
- F500 in state
- 110
Industry mix (Fortune 500 HQ in TX)
| Industry | F500 HQs | Revenue |
|---|---|---|
| Energy | 16 | $1,198B |
|
||
| Technology | 5 | $198B |
|
||
| Engineering / Construction | 4 | $72B |
|
||
| Energy Services | 3 | $60B |
|
||
| Utilities | 3 | $41B |
|
||
| Healthcare | 2 | $330B |
|
||
Price history
-11.5% since first listed2 events — show timeline
- 2026-05-04 Price Changed $115,000 HARMLS
- 2026-04-13 Listed $130,000 HARMLS
Cash-flow waterfall
monthlySold comps — $/sqft
last 12 mo · ≤1 miLoading sold comps…