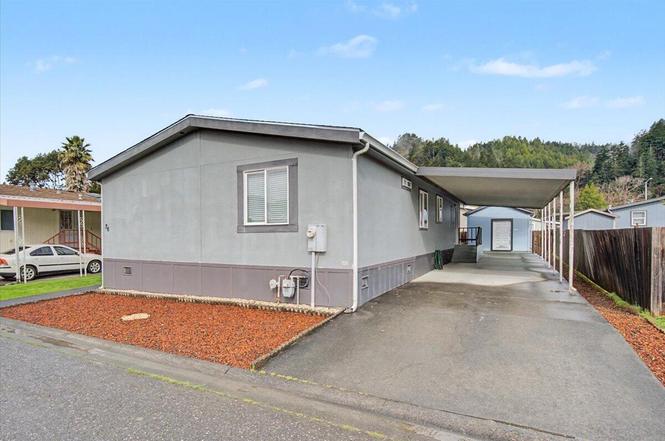
995 Riverside Dr #78 · Rio Dell, CA
Flood risk 1/10 · Minimal
- FEMA flood zone
- X (unshaded)
- Chance of flooding over 30 yrs
- 0.0%
- Est. flood insurance / yr
- $507 – $1,088
Fire risk 3/10 · Minor
- Est. fire insurance / yr
- $659 – $1,223
Heat risk 3/10 · Minor
- Hot days now (above 83°F)
- 8 days/yr
- Hot days in 30 yrs
- 19 days/yr
Wind risk 1/10 · Minimal
- Chance of severe wind over 30 yrs
- —
Air-quality risk 6/10 · Moderate
- Unhealthy air days now
- 10 days/yr
- Unhealthy air days in 30 yrs
- 11 days/yr
Risk factors via First Street. Map © Google.
Why this score? — see what drove the C+ grade
The composite is a weighted blend of 9 inputs, each scored 0–100. Each bar is that input's sub-score; the figure is the points it added to the 100-point composite (weight × sub-score).
- Cash flow +28.2/30.0
- DSCR +10.0/10.0
- ARV discount +7.5/15.0
- 1% rule +6.6/10.0
- Schools +2.6/10.0
- Rent growth +2.5/5.0
- Livability +2.5/5.0
- Condition / age +2.5/5.0
- Appreciation +0.0/10.0
$145,000
🖨 Deal sheet 📄 Offer letter ✓ Due diligence
Listing remarks
Seller offering to pay up to $1,600 of buyers closing costs, and can come furnished. Welcome to this inviting 3 bedroom, 2 bathroom home in Riverside Estates, Rio Dell. Featuring modernized flooring in the kitchen and living room, this home offers a clean, modern touch while maintaining a warm and comfortable feel. The thoughtful floor plan provides great separation of space, a private primary suite, and bright living areas perfect for everyday living. Located in a quiet community near the river and town conveniences, this is an ideal option for buyers seeking affordability without sacrificing comfort
Key facts
- Garage
- Built 2000
- Listed 110 days
Property features AI
Exterior
- Parking: 1-car garage
- Home design: Single family residential home; Located in Riverside Estates mobile home park (Skyline Homes Inc. P202-CT model)
- Construction: Manufactured by Skyline Homes Inc. (model P202-CT)
- Exterior features: Full fenced yard; Concrete road surface; Insulation for energy efficiency
Interior
- Interior features: Double pane windows; 9 total rooms
Neighborhood map
What this means for you Summary
Snapshot
- This is a 3-bed/2.0-bath manufactured listed at $145k.
Deal economics
- At list price, monthly cash flow is $459 ($6k/yr) — positive.
- The deal already cash-flows at list — no discount required.
- Meets the 1% rule at list price ($2k rent vs $145k).
- Recommended offer: $132k (9.0% below list) — sets the bar for market timing.
Location & tenants
- Location reads 50/100 on livability (#1,115 in CA) — a working-class tenant base; expect higher turnover. Watch: crime C-, health & safety C-, cost of living D.
- Fortuna Union High (town): math 17% / reading 44% proficiency, ranked #350 of 517 in CA (top 68%) — families likely to look elsewhere, expect single-tenant / working-renter base with shorter leases.
- Market conditions: 34 active listings in the ZIP; 188 units permitted in Humboldt County in 2024 (17 in 5+ unit buildings).
Forward outlook
- Local home prices are declining (-3.0%/yr); year-one equity from $1k of loan paydown is wiped out by about $4k of value loss. Plan a longer hold.
- Humboldt County population projected to shrink 4% by 2050 — rents likely to lag national; underwrite the cash flow, not the appreciation.
- At projected returns (-3.0% appreciation + 3.0% rent growth), your $41k cash investment doubles in ~9 years — after that, you're playing with house money.
Negotiation context
- It's been on market 110 days — a 9% lower offer ($132k) is reasonable based on typical stale-listing flexibility.
Questions for the listing agent
- It's been on market 110 days. Have you received any prior offers? Is the seller open to a 9% concession, seller financing, or rate buy-down credit?
- Why hasn't it sold? Are there any deal-killer items the seller is aware of (foundation, flood, title, zoning, code violations)?
- Is there a deadline driving the sale (1031 exchange, divorce, estate, relocation)? That informs how much negotiation room exists.
- Schools are F-rated, which usually means shorter tenancies and higher turnover. Who's the typical renter profile here, and what's been the actual vacancy rate?
- What's the average days-on-market for RENTAL listings here right now (not sales)? A rising rental-DOM trend means longer vacancies and softer asking-rent achievability than the comps imply.
- What's the recent tenant-quality profile in this submarket — average credit score on applications, eviction rate, late-payment / NSF rate, and stable-employment percentage? A property-management company in the area should have these aggregated.
- How much new for-sale + rental construction is in the pipeline within 1–3 miles? Heavy new supply typically softens prices + rents 12–24 months out; constrained supply supports both.
Investment metrics
- 1% rule
- 1.16% ✓
- Cap rate
- 10.09%
- Cash-on-cash
- 13.57%
- DSCR
- 1.60
- GRM
- 7.2
CMA / ARV
No comps found within radius.
Projected returns pro-forma
-3.0% appreciation · 3.0% rent growth · sell at horizon
- IRR
- 3.6%
- Equity multiple
- 1.14×
- Total profit
- $5,698
- Equity at exit
- $21,620
- IRR
- 13.1%
- Equity multiple
- 2.04×
- Total profit
- $42,401
- Equity at exit
- $12,537
Cash invested: $40,600 (down + closing). Projections, not guarantees.
Landlord ↔ Tenant lean methodology
- Overall (STATE)
- 18 Strongly Tenant-Friendly
- State California
- 18 Strongly Tenant-Friendly · D+13
- County
- — inherits STATE
- City
- — inherits STATE
ZIP-level market 95562
- Home prices YoY
- -27.9%
- Active inventory
- 34
- Price-to-rent
- 7.2×
Monthly cashflow live
- Estimated rent
- $1,683 medium interval (Pro) →
- Mortgage (P&I)
- −$760
- Tax from tax record
- −$50 /mo · $596/yr
- Insurance
- −$60
- HOA
- −$0
- Vacancy / Maint / Mgmt
- −$353
- Net cashflow
- $459
Break-even live
UW: 25.0% down · 7.5% · 30yr · 1.5% tax · 5.0% vac · 8.0% maint · 8.0% mgmt
Financing live
Cash to close
- Down payment
- $36,250
- Closing costs
- $4,350
- Reserves months
- —
- Total cash needed
- —
Loan-product check · same deal, 3 products live
Conventional
25% down · 7.5% · 30yr
- Down + closing
- —
- Monthly P&I
- —
- Monthly cashflow
- —
- DSCR
- —
- Eligible?
- —
Personal DTI + credit; lowest rate.
DSCR
20% down · 8.5% · 30yr
- Down + closing
- —
- Monthly P&I
- —
- Monthly cashflow
- —
- DSCR
- —
- Eligible?
- —
No personal income docs; deal must DSCR.
Hard money
10% down · 12.0% · 12mo
- Down + closing
- —
- Monthly P&I
- —
- Monthly cashflow
- —
- DSCR
- —
- Eligible?
- —
Short-term bridge; refi at stabilization.
Listing history 15 events
-
2026-06-12status $145,000 Pending 110 DOM
-
2026-06-09days on market $145,000 Active 110 DOM
-
2026-06-08days on market $145,000 Active 109 DOM
-
2026-06-07days on market $145,000 Active 108 DOM
-
2026-06-07days on market $145,000 Active 107 DOM
-
2026-06-05days on market $145,000 Active 106 DOM
-
2026-06-04days on market $145,000 Active 104 DOM
-
2026-06-02days on market $145,000 Active 103 DOM
-
2026-06-01days on market $145,000 Active 102 DOM
-
2026-05-31days on market $145,000 Active 101 DOM
-
2026-05-31days on market $145,000 Active 100 DOM
-
2026-05-01price $145,000
-
2026-04-01price $150,000
-
2026-03-04price $160,000
-
2026-02-19$170,000 Active
ⓘ Source: listings_history table (triggers on properties + properties_extension) + one-shot
backfill from property_details.listing_events for pre-trigger history.
Tax reassessment forecast CA · Resets to sale price
- Current annual tax
- $596 · $50/mo
- Projected year-2 tax
- $1,102 · $92/mo
- Expected delta
- +$506/yr (+$42/mo · 84.8%)
ⓘ Screening estimate from a state-policy table — verify with the county assessor before closing.
Climate risk First Street
- Flood 1/10 Low FEMA zone X (unshaded) · 0% chance over 30 yrs
- Wildfire 3/10 Moderate
- Heat 3/10 Moderate 8 d/yr ≥83°F today · 19 d/yr by 30 yrs out
- Wind 1/10 Low
- Air quality 6/10 Major 10 unhealthy d/yr today · 11 by 30 yrs out
Nearby sold comps map
Loading sold comps map…
Walkable amenities ~0.75 mi
Loading nearby amenities…
Taxation est. · year 1
- Rental income
- $20,199
- − Mortgage interest
- −$8,122
- − Property taxes
- −$596
- − Insurance
- −$725
- − Repairs & maintenance
- −$1,616
- − Management
- −$1,616
- − Depreciation
- −$4,218
- Taxable income
- $3,305
- Est. tax owed @ 24.0%
- −$793
- After-tax cash flow
- $4,718/yr
For passive investors: Depreciation is non-cash, so a rental often shows a tax loss while cash-flowing — sheltering income. Rental losses are passive: they offset passive income freely, and up to $25,000/yr can offset ordinary (W-2) income if you actively participate and your MAGI is under $100k (phasing out to $0 by $150k); unused losses carry forward. On sale, claimed depreciation is recaptured at up to 25%, and gains may owe capital-gains tax (a 1031 exchange can defer both). Figures are a year-1 estimate at your 24.0% rate — not tax advice; consult a CPA.
Schools (NCES district)
- District
- Fortuna Union High
- NCES district ID
- 0614190
- Math proficiency
- 17% ▼ -10.00%
- Reading proficiency
- 44% ▼ -8.00%
- Median HH income
- $41,411
- Composite
- 25.69/100
- National rank
- #7386
- State rank
- #350 of 517 in CA
Livability — Rio Dell
- Score
- 50/100
- State rank
- #1115
- US rank
- #25613
Category grades
Schools grade is shown separately in the Schools card above.
Census & demographics
- Census place
- Rio Dell, CA
- Population (ZIP)
- 3,384
Population outlook (Humboldt County) Hauer SSP2
- Today (2025)
- 135,550 people
- By 2030
- 134,798 · -0.6%
- By 2040
- 132,222 · -2.5%
- By 2050
- 130,850 · -3.5%
- By 2075
- 128,656 · -5.1%
- By 2100
- 120,238 · -11.3%
Race, ethnicity, and origin ACS 2023
- Neighborhood character
- Diverse neighborhood (Simpson 0.61)
- Race & ethnicity
- White 53% Hispanic / Latino 32% Two or more races 12% Native American 7% Asian 3% Black 2%
- Hispanic origin (detail)
- Mexican 24%
- Common ancestry
- Lithuanian 2% Iranian 2% Russian 2%
- Foreign-born
- 4% · Canada
- Languages at home
- 89% English-only · Spanish 7% Tagalog/Filipino 2% Vietnamese 1%
Political lean MEDSL · Humboldt
- 2024 margin
- Strong D (+28.4) · D 62.0% · R 33.6% · Other 4.5%
- 2008→2024 swing
- +0.2pp no change · 2008: 28.2pp · 2024: 28.4pp
- All cycles
- 2024: D+28.4 2020: D+33.4 2016: D+25.9 2012: D+26.2 2008: D+28.2
Not yet ingested
- Civics
- —
Market trends
- HPI YoY
- ▼ -87.56%
- Current HPI
- 226.26
- Rent YoY
- —
- Metro
- —
- State GDP YoY
- ▲ 3.21%
- F500 in state
- 116
Industry mix (Fortune 500 HQ in CA)
| Industry | F500 HQs | Revenue |
|---|---|---|
| Technology | 27 | $1,492B |
|
||
| Financial Services | 3 | $174B |
|
||
| Retail | 3 | $44B |
|
||
| Insurance | 3 | $26B |
|
||
| Media / Entertainment | 2 | $115B |
|
||
| Pharmaceuticals / Biotech | 2 | $62B |
|
||
Price history
-14.7% since first listed4 events — show timeline
- 2026-05-01 Price Changed $145,000 HAR
- 2026-04-01 Price Changed $150,000 HAR
- 2026-03-04 Price Changed $160,000 HAR
- 2026-02-19 Listed $170,000 HAR
Property tax history
-0.2%/yrLatest (2025): $596 · +3.2% YoY. Source: county tax records.
Cash-flow waterfall
monthlySold comps — $/sqft
last 12 mo · ≤1 miLoading sold comps…