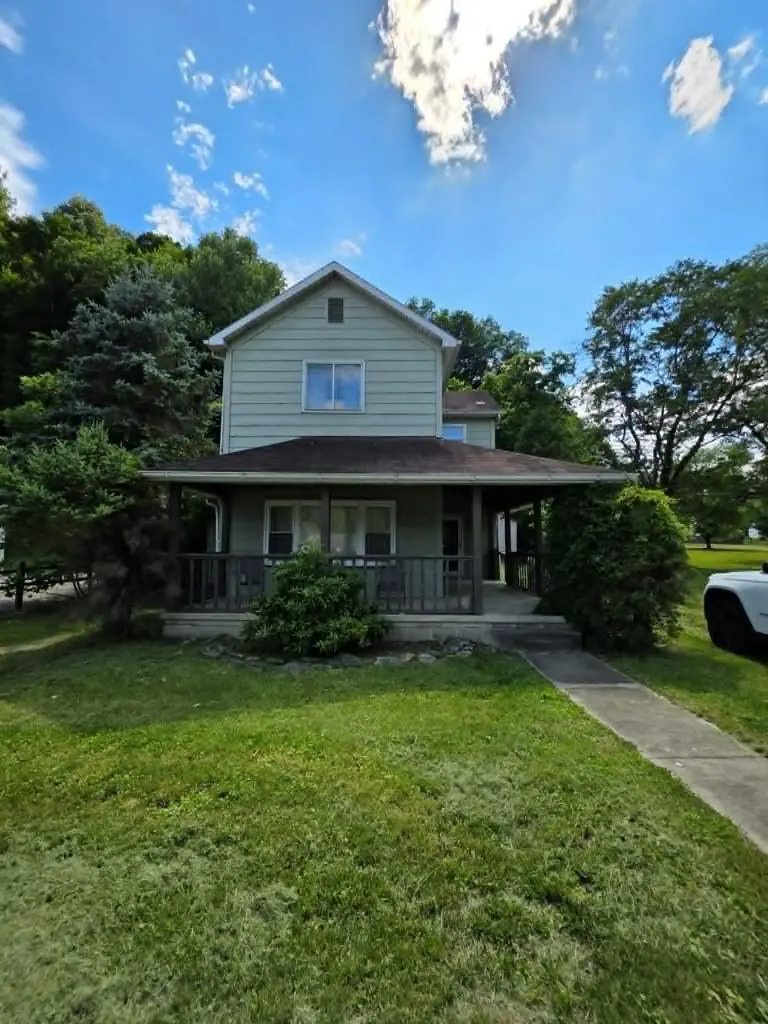
1645 St. Rt. 139 · Rosemount, OH
Flood risk 10/10 · Severe
- FEMA flood zone
- X (unshaded)
- Chance of flooding over 30 yrs
- 0.99%
- Est. flood insurance / yr
- $473 – $860
Fire risk 6/10 · Moderate
- Est. fire insurance / yr
- $713 – $1,323
Heat risk 4/10 · Minor
- Hot days now (above 101°F)
- 7 days/yr
- Hot days in 30 yrs
- 18 days/yr
Wind risk 2/10 · Minimal
- Chance of severe wind over 30 yrs
- 1.0%
Air-quality risk 2/10 · Minimal
- Unhealthy air days now
- 0 days/yr
- Unhealthy air days in 30 yrs
- 2 days/yr
Risk factors via First Street. Map © Google.
Why this score? — see what drove the B grade
The composite is a weighted blend of 9 inputs, each scored 0–100. Each bar is that input's sub-score; the figure is the points it added to the 100-point composite (weight × sub-score).
- Cash flow +30.0/30.0
- 1% rule +10.0/10.0
- DSCR +10.0/10.0
- ARV discount +7.5/15.0
- Schools +4.1/10.0
- Livability +3.5/5.0
- Rent growth +2.5/5.0
- Condition / age +2.5/5.0
- Appreciation +0.0/10.0
$99,900
🖨 Deal sheet (PDF) 📄 Offer letter ✓ Due diligence
Listing remarks
Opportunity awaits with this 3-bedroom, 2-bath fixer-upper situated on 1.2 acres in Clay Township. Offering 1,792 sq. ft. of living space plus a basement, this home is ready for your vision and updates. Features include attractive concrete front and side porches, a storage shed, and a spacious setting with plenty of room to enjoy. Property is being sold As-Is and will require repairs and renovation. Cash buyers or rehab loan financing only. Great potential for investors, flippers, or buyers looking to build equity through improvements.
Key facts
- Spacious setting
- Storage shed
- 1.2 acre lot
Tags
Property features AI
Exterior
- Parking: No garage
- Utilities: Public water; Public sewer
- Home design: Single family residence; Two levels; Residential property
- Construction: Block basement
- Exterior features: Asphalt roof
Interior
- Kitchen: Range
- Flooring: Laminate; Linoleum; Carpet; Wood
- Bathrooms: Two full bathrooms; One main-level bathroom
- Interior features: Eat-in kitchen; Has basement with block construction
- Laundry & utility: Laundry room
Neighborhood map
What this means for you Summary
Snapshot
- This is a 3-bed/1.0-bath single-family listed at $100k.
Deal economics
- At list price, monthly cash flow is $516 ($6k/yr) — positive.
- The deal already cash-flows at list — no discount required.
- Meets the 1% rule at list price ($2k rent vs $100k).
Location & tenants
- Location reads 69/100 on livability (#509 in OH) — a middle-class / working-renter tenant base. Strengths: crime A+, cost of living A+, housing A+; Watch: schools D-, amenities F, commute F.
- Clay Local (rural): math 47% / reading 49% proficiency, ranked #467 of 656 in OH (top 71%) — families likely to look elsewhere, expect single-tenant / working-renter base with shorter leases.
- Market conditions: 17 active listings in the ZIP; lower-income renter base — watch delinquency; 8 units permitted in Scioto County in 2024 (0 in 5+ unit buildings).
- At $1,565/mo this rent would consume 50% of the median local household income ($37k/yr) — very limited rent-growth headroom before tenants either downsize or default.
Forward outlook
- Local home prices are declining (-3.0%/yr); year-one equity from $691 of loan paydown is wiped out by about $3k of value loss. Plan a longer hold.
- Scioto County population projected at -24% by 2050 — secular population decline; favor cash flow + early exit over multi-decade hold.
- At projected returns (-3.0% appreciation + 3.0% rent growth), your $28k cash investment doubles in ~6 years — after that, you're playing with house money.
Negotiation context
- Only 14 days on market — expect competitive offers; lowballing is unlikely to land.
Risks & watch-outs
- Watch-outs: flood insurance adds $56/mo; built in 1900 — expect roof / HVAC / electrical / plumbing capex.
- Climate carrying-cost: severe flood risk; major wildfire risk — expect insurance premiums to compound above CPI over the hold.
Questions for the listing agent
- Built in 1900 — when were the roof, HVAC, electrical panel, plumbing, and water heater last replaced?
- What's the actual annual flood-insurance premium (NFIP or private), and is the property in a SFHA with mandatory coverage?
- Is there a deadline driving the sale (1031 exchange, divorce, estate, relocation)? That informs how much negotiation room exists.
- Schools are D-rated, which usually means shorter tenancies and higher turnover. Who's the typical renter profile here, and what's been the actual vacancy rate?
- What's the average days-on-market for RENTAL listings here right now (not sales)? A rising rental-DOM trend means longer vacancies and softer asking-rent achievability than the comps imply.
- What's the recent tenant-quality profile in this submarket — average credit score on applications, eviction rate, late-payment / NSF rate, and stable-employment percentage? A property-management company in the area should have these aggregated.
- How much new for-sale + rental construction is in the pipeline within 1–3 miles? Heavy new supply typically softens prices + rents 12–24 months out; constrained supply supports both.
Investment metrics
- 1% rule
- 1.57% ✓
- Cap rate
- 13.16%
- Cash-on-cash
- 24.51%
- DSCR
- 2.09
- GRM
- 5.3
CMA / ARV
No comps found within radius.
Projected returns pro-forma
-3.0% appreciation · 3.0% rent growth · sell at horizon
- IRR
- 14.9%
- Equity multiple
- 1.60×
- Total profit
- $16,710
- Equity at exit
- $14,895
- IRR
- 23.6%
- Equity multiple
- 3.04×
- Total profit
- $57,029
- Equity at exit
- $8,638
Cash invested: $27,972 (down + closing). Projections, not guarantees.
Landlord ↔ Tenant lean methodology
- Overall (STATE)
- 73 Landlord-Friendly
- State Ohio
- 73 Landlord-Friendly · R+6
- County
- — inherits STATE
- City
- — inherits STATE
ZIP-level market 45662
- Active inventory
- 17
- Price-to-rent
- 5.3×
Monthly cashflow live
- Estimated rent
- $1,565 medium interval (Pro) →
- Mortgage (P&I)
- −$524
- Tax from tax record
- −$100 /mo · $1,197/yr
- Insurance
- −$42
- Flood insurance flood zone
- −$56 /mo · $666/yr
- HOA
- −$0
- Vacancy / Maint / Mgmt
- −$329
- Net cashflow
- $516
Break-even live
Sensitivity live
| Price | -10% $572 | -5% $544 | +0% $516 | +5% $488 | +10% $459 |
|---|---|---|---|---|---|
| Rent | -10% $392 | -5% $454 | +0% $516 | +5% $578 | +10% $640 |
| Rate | -1.0pp $566 | -0.5pp $541 | base $516 | +0.5pp $490 | +1.0pp $464 |
UW: 25.0% down · 7.5% · 30yr · 1.5% tax · 5.0% vac · 8.0% maint · 8.0% mgmt
Financing live
Cash to close
- Down payment
- $24,975
- Closing costs
- $2,997
- Reserves months
- —
- Total cash needed
- —
Loan-product check · same deal, 3 products live
Conventional
25% down · 7.5% · 30yr
- Down + closing
- —
- Monthly P&I
- —
- Monthly cashflow
- —
- DSCR
- —
- Eligible?
- —
Personal DTI + credit; lowest rate.
DSCR
20% down · 8.5% · 30yr
- Down + closing
- —
- Monthly P&I
- —
- Monthly cashflow
- —
- DSCR
- —
- Eligible?
- —
No personal income docs; deal must DSCR.
Hard money
10% down · 12.0% · 12mo
- Down + closing
- —
- Monthly P&I
- —
- Monthly cashflow
- —
- DSCR
- —
- Eligible?
- —
Short-term bridge; refi at stabilization.
Listing history 12 events
-
2026-06-21days on market $99,900 Active 14 DOM
-
2026-06-18days on market $99,900 Active 12 DOM
-
2026-06-17days on market $99,900 Active 11 DOM
-
2026-06-16days on market $99,900 Active 10 DOM
-
2026-06-16price $99,900 Active 9 DOM
-
2026-06-15days on market $109,900 Active 9 DOM
-
2026-06-13days on market $109,900 Active 7 DOM
-
2026-06-12days on market $109,900 Active 6 DOM
-
2026-06-09days on market $109,900 Active 3 DOM
-
2026-06-08days on market $109,900 Active 2 DOM
-
2026-06-07remarks 541-char remark
-
2026-06-07$109,900 Active 1 DOM
ⓘ Source: listings_history table (triggers on properties + properties_extension) + one-shot
backfill from property_details.listing_events for pre-trigger history.
Tax reassessment forecast OH · Partial reset (capped growth)
- Current annual tax
- $1,197 · $100/mo
- Projected year-2 tax
- $1,378 · $115/mo
- Expected delta
- +$181/yr (+$15/mo · 15.1%)
ⓘ Screening estimate from a state-policy table — verify with the county assessor before closing.
Climate risk First Street
- Flood 10/10 Extreme FEMA zone X (unshaded) · 99% chance over 30 yrs
- Wildfire 6/10 Major
- Heat 4/10 Moderate 7 d/yr ≥101°F today · 18 d/yr by 30 yrs out
- Wind 2/10 Low 100% chance of damaging wind over 30 yrs
- Air quality 2/10 Low 0 unhealthy d/yr today · 2 by 30 yrs out
Nearby sold comps map
Loading sold comps map…
Walkable amenities ~0.75 mi
Loading nearby amenities…
Taxation est. · year 1
- Rental income
- $18,785
- − Mortgage interest
- −$5,596
- − Property taxes
- −$1,197
- − Insurance
- −$1,166
- − Repairs & maintenance
- −$1,503
- − Management
- −$1,503
- − Depreciation
- −$2,906
- Taxable income
- $4,914
- Est. tax owed @ 24.0%
- −$1,179
- After-tax cash flow
- $5,011/yr
For passive investors: Depreciation is non-cash, so a rental often shows a tax loss while cash-flowing — sheltering income. Rental losses are passive: they offset passive income freely, and up to $25,000/yr can offset ordinary (W-2) income if you actively participate and your MAGI is under $100k (phasing out to $0 by $150k); unused losses carry forward. On sale, claimed depreciation is recaptured at up to 25%, and gains may owe capital-gains tax (a 1031 exchange can defer both). Figures are a year-1 estimate at your 24.0% rate — not tax advice; consult a CPA.
Schools (NCES district)
- District
- Clay Local
- NCES district ID
- 3910026
- Math proficiency
- 47% ▼ -6.00%
- Reading proficiency
- 49% ▼ -7.00%
- Median HH income
- $46,134
- Composite
- 40.76/100
- National rank
- #3651
- State rank
- #467 of 656 in OH
Livability — Rosemount
- Score
- 69/100
- State rank
- #509
- US rank
- #8692
Category grades
Schools grade is shown separately in the Schools card above.
Census & demographics
- Census place
- Rosemount, OH
- County
- Scioto · 71,806 people
- Population (ZIP)
- 26,972
- Household income
- $37,345
- Rent vs Own
- Severe rent burden
- 11.3
Population outlook (Scioto County) Hauer SSP2
- Today (2025)
- 71,121 people
- By 2030
- 67,817 · -4.6%
- By 2040
- 61,021 · -14.2%
- By 2050
- 54,016 · -24.1%
- By 2075
- 38,532 · -45.8%
- By 2100
- 25,734 · -63.8%
Race, ethnicity, and origin ACS 2023
- Neighborhood character
- Predominantly White (88%)
- Race & ethnicity
- White 88% Two or more races 6% Black 3% Hispanic / Latino 2%
- Common ancestry
- Lithuanian 2% Slovak 1% Iranian 1%
- Foreign-born
- 1% · Canada, China
- Languages at home
- 98% English-only · Spanish 1%
Political lean MEDSL · Scioto
- 2024 margin
- Solid R (+48.0) · D 25.7% · R 73.7%
- 2008→2024 swing
- -41.6pp toward R · 2008: -6.3pp · 2024: -48.0pp
- All cycles
- 2024: R+48.0 2020: R+42.2 2016: R+36.8 2012: R+2.0 2008: R+6.3
Not yet ingested
- Civics
- —
Market trends
- HPI YoY
- ▼ -101.06%
- Current HPI
- 141.5176
- Rent YoY
- —
- Metro
- —
- State GDP YoY
- ▲ 1.98%
- F500 in state
- 48
Industry mix (Fortune 500 HQ in OH)
| Industry | F500 HQs | Revenue |
|---|---|---|
| Insurance | 3 | $145B |
|
||
| Industrial Machinery | 3 | $49B |
|
||
| Financial Services | 3 | $24B |
|
||
| Consumer Goods | 2 | $93B |
|
||
| Aerospace / Defense | 2 | $47B |
|
||
| Utilities | 2 | $33B |
|
||
Price history
1 event — show timeline
- 2026-06-06 Listed $109,900 SVAR
Property tax history
+4.8%/yrLatest (2025): $1,197 · -22.1% YoY. Source: county tax records.
Cash-flow waterfall
monthlySold comps — $/sqft
last 12 mo · ≤1 miLoading sold comps…