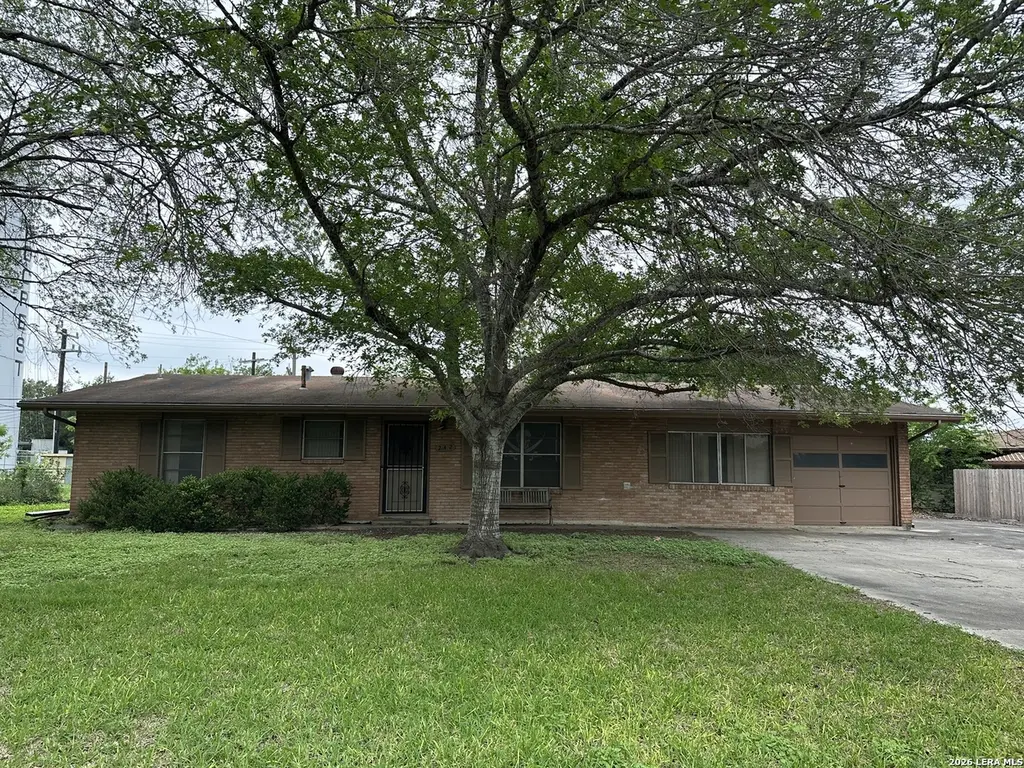
242 Zephyr Dr · Windcrest, TX
Flood risk 1/10 · Minimal
- FEMA flood zone
- X (unshaded)
- Chance of flooding over 30 yrs
- 0.0%
- Est. flood insurance / yr
- $507 – $1,088
Fire risk 1/10 · Minimal
- Est. fire insurance / yr
- $1,222 – $2,270
Heat risk 8/10 · Major
- Hot days now (above 108°F)
- 7 days/yr
- Hot days in 30 yrs
- 21 days/yr
Wind risk 8/10 · Major
- Chance of severe wind over 30 yrs
- 80.0%
Air-quality risk 2/10 · Minimal
- Unhealthy air days now
- 0 days/yr
- Unhealthy air days in 30 yrs
- 1 days/yr
Risk factors via First Street. Map © Google.
Why this score? — see what drove the B+ grade
The composite is a weighted blend of 9 inputs, each scored 0–100. Each bar is that input's sub-score; the figure is the points it added to the 100-point composite (weight × sub-score).
- Cash flow +30.0/30.0
- ARV discount +15.0/15.0
- DSCR +10.0/10.0
- 1% rule +8.6/10.0
- Schools +3.8/10.0
- Livability +3.5/5.0
- Condition / age +2.5/5.0
- Rent growth +2.2/5.0
- Appreciation +0.0/10.0
$110,000
🖨 Deal sheet 📄 Offer letter ✓ Due diligence
Listing remarks
This is a value-add opportunity on a 3-bedroom, 2-bath, single-story, all-level, no-steps home. This is definitely a fixer-upper and in need of a full rehab. SOLD AS-IS. NO REPAIRS. Cash only. No seller financing, no creative terms, no novations, and no equitable interest assignments. Seller will only consider offers submitted on TREC/TAR promulgated forms. No 'blind' offers; property must be toured prior to offer submission.
Key facts
- 0.31 acre lot
- Garage
- Community pool
Property features AI
Finance
- HOA & community: Located in the Windcrest subdivision (Windcrest SEG1/2)
Exterior
- Parking: Converted 1-car garage
- Utilities: Water system; Sewer system
- Home design: Pre-owned single-family home; Approximately 64 years old
- Construction: Composition roof; Slab foundation
- Exterior features: Brick and siding exterior; Community amenities include pool, tennis courts, golf course, clubhouse, park/playground, jogging trails and sports court
Interior
- Kitchen: Cooktop; Gas cooking; Dishwasher; Kitchen approximately 13 x 12
- Bedrooms: Master bedroom with ceiling fan and full bath (12 x 11); Bedroom 2 (12 x 11); Bedroom 3 (13 x 10)
- Flooring: Wood floors; Linoleum floors
- Bathrooms: Two full bathrooms; Master bath with shower only and single vanity (6 x 8)
- Heating & cooling: Central heating with natural gas; Central air conditioning
- Interior features: Ceiling fans throughout; Cable TV available; High-speed internet available; Telephone service; 1 living area; Separate dining room
- Laundry & utility: Washer connection; Dryer connection; Gas water heater
Neighborhood map
What this means for you Summary
Snapshot
- This is a 3-bed/2.0-bath single-family listed at $110k.
Deal economics
- At list price, monthly cash flow is $418 ($5k/yr) — positive.
- The deal already cash-flows at list — no discount required.
- Meets the 1% rule at list price ($1k rent vs $110k).
- Cap rate 10.8% vs local median 2.9% in Windcrest — top-decile yield for the area; either an underpriced asset or a hidden risk that comps aren't pricing in. Stress-test before assuming the spread holds.
Location & tenants
- Location reads 69/100 on livability (#439 in TX) — a middle-class / working-renter tenant base. Strengths: cost of living A+, housing A+, employment A; Watch: health & safety D+, crime F, amenities F.
- North East ISD (urban): math 38% / reading 49% proficiency, ranked #276 of 826 in TX (top 33%) — families likely to look elsewhere, expect single-tenant / working-renter base with shorter leases.
- Zoned schools: Windcrest El (math 22% / reading 33%, grade F, #2,768 of 4,322 statewide, top 65%, 491 students, 78% FRL); Roosevelt H S (math 20% / reading 40%, grade F, #1,096 of 1,632 statewide, top 68%, 2,599 students, 72% FRL) — zoned schools average 75% FRL vs 41% district-wide (34 pts higher); higher-poverty schools than district average — tighter screening recommended.
- Zoned-school proficiency averages 29% at this address vs 44% district-wide (-15 pts) — the specific schools serving this property underperform the North East ISD average; the district grade overstates school quality for this exact location.
- Market conditions: Rents soft (-1.1%/yr); 202 active listings in the ZIP; 40 comparable units currently listed for rent nearby; rentals at typical pace (median 24d on market — plan ~3-4 weeks tenant-placement turnaround); 8,308 units permitted in Bexar County in 2024 (2,506 in 5+ unit buildings).
Forward outlook
- Local home prices are declining (-3.0%/yr); year-one equity from $761 of loan paydown is wiped out by about $3k of value loss. Plan a longer hold.
- Bexar County population projected at +50% by 2050 — long-run rental-demand tailwind backs the buy-and-hold thesis.
Negotiation context
- Only 12 days on market — expect competitive offers; lowballing is unlikely to land.
Risks & watch-outs
- Climate carrying-cost: severe wind risk, 80% chance of damaging wind over 30y; extreme-heat days projected 7→21/yr by 2055 (HVAC capex compounding) — expect insurance premiums to compound above CPI over the hold.
Questions for the listing agent
- Built in 1962 — when were the roof, HVAC, electrical panel, plumbing, and water heater last replaced?
- Is there a deadline driving the sale (1031 exchange, divorce, estate, relocation)? That informs how much negotiation room exists.
- Schools are B-rated — typically a magnet for longer-tenancy family renters. What's the average tenant stay here, and is there a school-zone premium baked into asking?
- Crime grade is F in this area — have there been break-ins, vandalism, or insurance claims at this property in the last 3 years? What carrier currently insures it and at what premium?
- What's the average days-on-market for RENTAL listings here right now (not sales)? A rising rental-DOM trend means longer vacancies and softer asking-rent achievability than the comps imply.
- What's the recent tenant-quality profile in this submarket — average credit score on applications, eviction rate, late-payment / NSF rate, and stable-employment percentage? A property-management company in the area should have these aggregated.
- How much new for-sale + rental construction is in the pipeline within 1–3 miles? Heavy new supply typically softens prices + rents 12–24 months out; constrained supply supports both.
Investment metrics
- 1% rule
- 1.36% ✓
- Cap rate
- 10.85%
- Cash-on-cash
- 16.27%
- DSCR
- 1.72
- GRM
- 6.1
CMA / ARV
- ARV (on-the-fly)
- $212,544
- Comps found
- 4
Show comp detail 4 sales within ~0.75 mi
| Address | Dist | Beds/Ba | Sqft | Sold | Price | $/sf | Match |
|---|---|---|---|---|---|---|---|
| 201 Zephyr | 0.18mi | 3/2.0 | 1,368 (+6%) | 1mo | $225,000 | $164 | 82 |
| 5509 Crosswind | 0.32mi | 3/2.0 | 1,344 (+4%) | 10mo | $230,000 | $171 | 70 |
| 241 Weathercock Ln | 0.11mi | 4/2.0 (+1) | 1,478 (+14%) | 8mo | $220,000 | $149 | 60 |
| 26 Beacon Bay | 0.67mi | 3/2.5 | 1,453 (+12%) | 1mo | $195,000 | $134 | 46 |
Match score weights: distance 35% · size 25% · config 20% · recency 20%. Top-matched comps best support the ARV.
Projected returns pro-forma
-3.0% appreciation · 0.0% rent growth · sell at horizon
- IRR
- 3.9%
- Equity multiple
- 1.14×
- Total profit
- $4,431
- Equity at exit
- $16,401
- IRR
- 10.3%
- Equity multiple
- 1.69×
- Total profit
- $21,319
- Equity at exit
- $9,511
Cash invested: $30,800 (down + closing). Projections, not guarantees.
Landlord ↔ Tenant lean methodology
- Overall (STATE)
- 87 Strongly Landlord-Friendly
- State Texas
- 87 Strongly Landlord-Friendly · R+5
- County
- — inherits STATE
- City
- — inherits STATE
ZIP-level market 78239
- Home prices YoY
- -5.9%
- Rents YoY
- -1.1%
- Active inventory
- 202
- Price-to-rent
- 6.1×
Monthly cashflow live
- Estimated rent
- $1,491 high interval (Pro) →
- Mortgage (P&I)
- −$577
- Tax est. 1.5%
- −$138 /mo · $1,650/yr
- Insurance
- −$46
- HOA
- −$0
- Vacancy / Maint / Mgmt
- −$313
- Net cashflow
- $418
Break-even live
UW: 25.0% down · 7.5% · 30yr · 1.5% tax · 5.0% vac · 8.0% maint · 8.0% mgmt
Financing live
Cash to close
- Down payment
- $27,500
- Closing costs
- $3,300
- Reserves months
- —
- Total cash needed
- —
Loan-product check · same deal, 3 products live
Conventional
25% down · 7.5% · 30yr
- Down + closing
- —
- Monthly P&I
- —
- Monthly cashflow
- —
- DSCR
- —
- Eligible?
- —
Personal DTI + credit; lowest rate.
DSCR
20% down · 8.5% · 30yr
- Down + closing
- —
- Monthly P&I
- —
- Monthly cashflow
- —
- DSCR
- —
- Eligible?
- —
No personal income docs; deal must DSCR.
Hard money
10% down · 12.0% · 12mo
- Down + closing
- —
- Monthly P&I
- —
- Monthly cashflow
- —
- DSCR
- —
- Eligible?
- —
Short-term bridge; refi at stabilization.
Rent comps 40 comps
| Address | Beds | Baths | Sqft | Rent | $/sqft | DOM | Units | Dist |
|---|---|---|---|---|---|---|---|---|
| 8731 Tradewind Dr Windcrest, TX | 3.0 | 2.5 | 1750 | $1,350 | $0.77 | 14d | 1 | 0.19mi |
| 8835 Willmon Way Windcrest, TX | 1.0–3.0 | 1.0–2.0 | 979 | $1,145 | $1.17 | 1d | 12 | 0.24mi |
| 18 Beacon Bay San Antonio, TX | 3.0 | 2.5 | 1441 | $1,695 | $1.18 | 43d | 1 | 0.71mi |
| 5314 Randolph Blvd Apt 903 San Antonio, TX | 2.0 | 2.0 | 924 | $1,110 | $1.20 | 23d | 1 | 0.72mi |
| 5314 Randolph Blvd Apt 714 San Antonio, TX | 2.0 | 2.0 | 924 | $1,110 | $1.20 | 43d | 1 | 0.72mi |
| 9906 Hazy Bnd Unit 103 San Antonio, TX | 3.0 | 2.5 | 1225 | $1,375 | $1.12 | 23d | 1 | 0.74mi |
| 9906 Hazy Bnd San Antonio, TX | 3.0 | 2.5 | 1225 | $1,375 | $1.12 | 2d | 1 | 0.74mi |
| 9906 Hazy Bnd Unit 104 San Antonio, TX | 3.0 | 2.5 | 1225 | $1,350 | $1.10 | 14d | 1 | 0.74mi |
| 9906 Hazy Bnd Unit 104 San Antonio, TX | 3.0 | 2.5 | 1225 | $1,395 | $1.14 | 43d | 1 | 0.74mi |
| 14 Adkins Rdg San Antonio, TX | 3.0 | 2.5 | 1680 | $1,625 | $0.97 | 21d | 1 | 0.75mi |
| 9910 Hazy Bnd San Antonio, TX | 3.0 | 2.5 | 1225 | $1,400 | $1.14 | 20d | 1 | 0.76mi |
| 9910 Hazy Bnd Unit 1 San Antonio, TX | 3.0 | 2.5 | 1225 | $1,400 | $1.14 | 23d | 1 | 0.76mi |
| 5315 Gawain Dr Unit 710 San Antonio, TX | 2.0 | 2.0 | 944 | $1,081 | $1.15 | 2d | 1 | 0.76mi |
| 9903 Grove Mist San Antonio, TX | 3.0 | 2.5 | 1225 | $1,345 | $1.10 | 2d | 2 | 0.77mi |
| 9903 Grove Mist Unit 102 San Antonio, TX | 3.0 | 2.5 | 1225 | $1,345 | $1.10 | 23d | 1 | 0.77mi |
| 9903 Grove Mist Unit 101 San Antonio, TX | 3.0 | 2.5 | 1225 | $1,345 | $1.10 | 43d | 1 | 0.77mi |
| 9918 Hazy Bnd Unit 104 San Antonio, TX | 3.0 | 2.5 | 1246 | $1,350 | $1.08 | 14d | 1 | 0.79mi |
| 127 Booker Palm San Antonio, TX | 3.0 | 2.5 | 1680 | $1,600 | $0.95 | 23d | 1 | 0.80mi |
| 9911 Grove Mist Unit 101 San Antonio, TX | 3.0 | 2.5 | 1225 | $1,345 | $1.10 | 43d | 1 | 0.80mi |
| 9911 Grove Mist San Antonio, TX | 3.0 | 2.5 | 1225 | $1,345 | $1.10 | 10d | 2 | 0.80mi |
| 9911 Grove Mist Unit 102 San Antonio, TX | 3.0 | 2.5 | 1225 | $1,550 | $1.27 | 23d | 1 | 0.80mi |
| 5306 Gawain Dr Unit 5308 San Antonio, TX | 2.0 | 2.0 | 912 | $1,195 | $1.31 | 43d | 1 | 0.82mi |
| 7 Beacon Oak San Antonio, TX | 3.0 | 2.5 | 1446 | $1,699 | $1.17 | 2d | 1 | 0.82mi |
| 5308 Gawain Dr San Antonio, TX | 2.0 | 2.0 | 912 | $1,195 | $1.31 | 43d | 1 | 0.82mi |
| 5310 Gawain Dr San Antonio, TX | 2.0 | 2.0 | 912 | $1,099 | $1.21 | 23d | 1 | 0.82mi |
| 9926 Hazy Bnd Unit 104 San Antonio, TX | 3.0 | 2.5 | 1298 | $1,395 | $1.07 | 43d | 1 | 0.83mi |
| 9926 Hazy Bnd Unit 104 San Antonio, TX | 3.0 | 2.5 | 1298 | $1,395 | $1.07 | 16d | 1 | 0.83mi |
| 9919 Grove Mist Unit 4 San Antonio, TX | 3.0 | 2.5 | 1360 | $1,495 | $1.10 | 23d | 1 | 0.83mi |
| 9919 Grove Mist Unit 104 San Antonio, TX | 3.0 | 2.5 | 1300 | $1,425 | $1.10 | 7d | 1 | 0.83mi |
| 9930 Hazy Bnd Unit 3 San Antonio, TX | 3.0 | 2.5 | 1225 | $1,375 | $1.12 | 43d | 1 | 0.84mi |
| 18 Anchorage Bay San Antonio, TX | 3.0 | 2.5 | 1585 | $1,750 | $1.10 | 21d | 1 | 0.84mi |
| 5134 Gawain Dr San Antonio, TX | 3.0 | 2.0 | 1488 | $1,750 | $1.18 | 17d | 1 | 0.84mi |
| 5202 Gawain Dr San Antonio, TX | 2.0 | 1.0 | 1100 | $1,075 | $0.98 | 10d | 1 | 0.85mi |
| 160 Booker Palm San Antonio, TX | 3.0 | 2.5 | 1721 | $1,610 | $0.94 | 4d | 1 | 0.86mi |
| 9934 Hazy Bnd San Antonio, TX | 3.0 | 2.5 | 1225 | $1,538 | $1.26 | 2d | 2 | 0.86mi |
| 9934 Hazy Bnd Unit 104 San Antonio, TX | 3.0 | 2.5 | 1225 | $1,675 | $1.37 | 43d | 1 | 0.86mi |
| 9934 Hazy Bnd Unit 101 San Antonio, TX | 3.0 | 2.5 | 1225 | $1,400 | $1.14 | 43d | 1 | 0.86mi |
| 3 Basin Elm San Antonio, TX | 3.0 | 2.0 | 1437 | $1,715 | $1.19 | 20d | 1 | 0.89mi |
| 11 Basin Elm San Antonio, TX | 3.0 | 2.5 | 1437 | $1,550 | $1.08 | 4d | 1 | 0.89mi |
| 5295 Round Table Dr San Antonio, TX | 3.0 | 2.0 | 1874 | $1,550 | $0.83 | 43d | 1 | 0.90mi |
Listing history 5 events
-
2026-06-03status $110,000 Pending 12 DOM
-
2026-06-02days on market $110,000 Active Option 12 DOM
-
2026-06-01days on market $110,000 Active Option 11 DOM
-
2026-05-31days on market $110,000 Active Option 10 DOM
-
2026-05-21$110,000 New
ⓘ Source: listings_history table (triggers on properties + properties_extension) + one-shot
backfill from property_details.listing_events for pre-trigger history.
Climate risk First Street
- Flood 1/10 Low FEMA zone X (unshaded) · 0% chance over 30 yrs
- Wildfire 1/10 Low
- Heat 8/10 Severe 7 d/yr ≥108°F today · 21 d/yr by 30 yrs out
- Wind 8/10 Severe 80% chance of damaging wind over 30 yrs
- Air quality 2/10 Low 0 unhealthy d/yr today · 1 by 30 yrs out
Nearby sold comps map
Loading sold comps map…
Walkable amenities ~0.75 mi
Loading nearby amenities…
Taxation est. · year 1
- Rental income
- $17,892
- − Mortgage interest
- −$6,162
- − Property taxes
- −$1,650
- − Insurance
- −$550
- − Repairs & maintenance
- −$1,431
- − Management
- −$1,431
- − Depreciation
- −$3,200
- Taxable income
- $3,467
- Est. tax owed @ 24.0%
- −$832
- After-tax cash flow
- $4,180/yr
For passive investors: Depreciation is non-cash, so a rental often shows a tax loss while cash-flowing — sheltering income. Rental losses are passive: they offset passive income freely, and up to $25,000/yr can offset ordinary (W-2) income if you actively participate and your MAGI is under $100k (phasing out to $0 by $150k); unused losses carry forward. On sale, claimed depreciation is recaptured at up to 25%, and gains may owe capital-gains tax (a 1031 exchange can defer both). Figures are a year-1 estimate at your 24.0% rate — not tax advice; consult a CPA.
Schools (NCES district)
- District
- North East ISD
- NCES district ID
- 4832940
- Math proficiency
- 38% ▼ -14.00%
- Reading proficiency
- 49% ▼ -4.00%
- Median HH income
- $57,715
- Composite
- 38.1/100
- National rank
- #4276
- State rank
- #276 of 826 in TX
Livability — Windcrest
- Score
- 69/100
- State rank
- #439
- US rank
- #8964
Category grades
Schools grade is shown separately in the Schools card above.
Census & demographics
- Census place
- Windcrest, TX
- County
- Bexar County · 1,990,555 people
- Metro
- San Antonio-New Braunfels, TX
- Population (ZIP)
- 28,609
- Household income
- $70,098
- Rent vs Own
- Severe rent burden
- 488.0
Population outlook (Bexar County) Hauer SSP2
- Today (2025)
- 2,336,851 people
- By 2030
- 2,560,728 · +9.6%
- By 2040
- 3,020,569 · +29.3%
- By 2050
- 3,493,522 · +49.5%
- By 2075
- 4,668,459 · +99.8%
- By 2100
- 5,533,242 · +136.8%
Race, ethnicity, and origin ACS 2023
- Neighborhood character
- Diverse neighborhood (Simpson 0.66)
- Race & ethnicity
- Hispanic / Latino 47% White 30% Two or more races 20% Black 16% Asian 4% Pacific Islander 2%
- Hispanic origin (detail)
- Mexican 38% Puerto Rican 4%
- Common ancestry
- Lithuanian 2% Romanian 1% Slovak 1%
- Foreign-born
- 13% · Canada, Vietnam, Jamaica
- Languages at home
- 72% English-only · Spanish 24% Vietnamese 1% Chinese 1%
Political lean MEDSL · Bexar
- 2024 margin
- Lean D (+9.8) · D 54.3% · R 44.6% · Other 1.1%
- 2008→2024 swing
- +4.2pp toward D · 2008: 5.6pp · 2024: 9.8pp
- All cycles
- 2024: D+9.8 2020: D+18.2 2016: D+13.5 2012: D+4.6 2008: D+5.6
Not yet ingested
- Civics
- —
Market trends
- HPI YoY
- ▼ -15.13%
- Current HPI
- 242.1272
- Rent YoY
- ▼ -1.05%
- Metro
- San Antonio-New Braunfels, TX
- State GDP YoY
- ▲ 3.95%
- F500 in state
- 110
Industry mix (Fortune 500 HQ in TX)
| Industry | F500 HQs | Revenue |
|---|---|---|
| Energy | 16 | $1,198B |
|
||
| Technology | 5 | $198B |
|
||
| Engineering / Construction | 4 | $72B |
|
||
| Energy Services | 3 | $60B |
|
||
| Utilities | 3 | $41B |
|
||
| Healthcare | 2 | $330B |
|
||
Price history
1 event — show timeline
- 2026-05-21 Listed $110,000 LERA
Property tax history
+6.1%/yrLatest (2025): $5,515 · +2.3% YoY. Source: county tax records.
Cash-flow waterfall
monthlySold comps — $/sqft
last 12 mo · ≤1 miLoading sold comps…