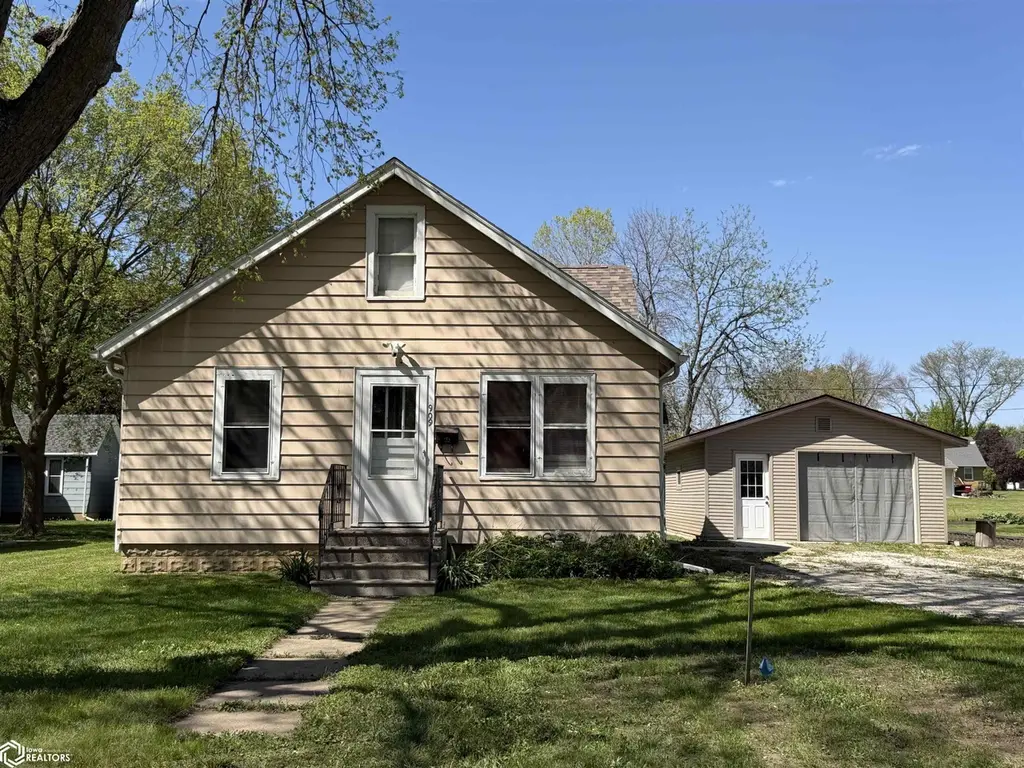
909 4th Avenue North Ave · Humboldt, IA
Flood risk 1/10 · Minimal
- FEMA flood zone
- X (unshaded)
- Chance of flooding over 30 yrs
- 0.0%
- Est. flood insurance / yr
- $473 – $860
Fire risk 1/10 · Minimal
- Est. fire insurance / yr
- $902 – $1,676
Heat risk 2/10 · Minimal
- Hot days now (above 100°F)
- 7 days/yr
- Hot days in 30 yrs
- 16 days/yr
Wind risk 2/10 · Minimal
- Chance of severe wind over 30 yrs
- —
Air-quality risk 1/10 · Minimal
- Unhealthy air days now
- 0 days/yr
- Unhealthy air days in 30 yrs
- 0 days/yr
Risk factors via First Street. Map © Google.
Why this score? — see what drove the A- grade
The composite is a weighted blend of 9 inputs, each scored 0–100. Each bar is that input's sub-score; the figure is the points it added to the 100-point composite (weight × sub-score).
- Cash flow +30.0/30.0
- ARV discount +15.0/15.0
- DSCR +10.0/10.0
- 1% rule +9.9/10.0
- Schools +6.2/10.0
- Livability +4.2/5.0
- Rent growth +2.5/5.0
- Condition / age +2.5/5.0
- Appreciation +0.0/10.0
$79,900
🖨 Deal sheet 📄 Offer letter ✓ Due diligence
Listing remarks
CHARMING 1 1/2 STORY 3 BEDROOM HOME OFFERS 1,253 S/F OF COMFORTABLE LIVING SPACE. THIS HOME INCLUDES A DETACHED 1/CAR HEATED GARAGE-PERFECT FOR WINTER PROJECTS OR EXTRA WORKSPACE. HARDWOOD FLOORS IN LIVING ROOM. WINDOW UNIT (2 YEARS OLD), DEHUMIDIFIER, REFRIGERATOR IN BASEMENT, WASHER AND DRYER - STAY. HOOKUPS FOR MAIN FLOOR LAUNDRY. A 200 AMP CIRCUIT BREAKER BOX (2009) AND NEWER FURNCACE INSTALLED IN 2016, SHINGLES - NEW 2018. GARAGE WAS MOVED ONTO THE PROPERTY IN 2024-HAS VINYL SIDING. WHETHER YOU'RE LOOKING FOR A STARTER HOME, INVESTMENT PROPERTY, OR A COZY PLACE TO SETTLE IN, THIS PROPERTY HAS GREAT POTENTIAL! PROPERTY IS BEING - SOLD "AS IS".
Key facts
- Newer furnace
- Vinyl siding
- Hardwood floors
Tags
Property features AI
Exterior
- Parking: Detached 1-car garage
- Utilities: Public water; Public sewer
- Home design: One and a half stories; Single-family residence
- Construction: Metal siding
- Exterior features: Lot roughly 82.5 x 165
Interior
- Bathrooms: One full bathroom
- Heating & cooling: Forced air heating; Window AC unit(s)
- Interior features: Finished basement
Neighborhood map
What this means for you Summary
Snapshot
- This is a 3-bed/1.0-bath single-family listed at $80k.
Deal economics
- At list price, monthly cash flow is $388 ($5k/yr) — positive.
- The deal already cash-flows at list — no discount required.
- Meets the 1% rule at list price ($1k rent vs $80k).
- Recommended offer: $79k (1.5% below list) — sets the bar for market timing.
- Cap rate 12.1% vs local median 3.8% in Humboldt — top-decile yield for the area; either an underpriced asset or a hidden risk that comps aren't pricing in. Stress-test before assuming the spread holds.
Location & tenants
- Location reads 83/100 on livability (#34 in IA, #1,000 nationally) — a professional / high-income tenant draw. Strengths: schools A+, cost of living A+, housing A+; Watch: amenities F, commute F.
- Humboldt Community School District (town): math 75% / reading 72% proficiency, ranked #92 of 289 in IA (top 32%) — strong family-tenant draw, lease renewals of 3-5y typical.
- Market conditions: 62 active listings in the ZIP; 13 units permitted in Humboldt County in 2024 (0 in 5+ unit buildings).
Forward outlook
- Local home prices are declining (-3.0%/yr); year-one equity from $552 of loan paydown is wiped out by about $2k of value loss. Plan a longer hold.
- Humboldt County population projected to shrink 9% by 2050 — rents likely to lag national; underwrite the cash flow, not the appreciation.
- At projected returns (-3.0% appreciation + 3.0% rent growth), your $22k cash investment doubles in ~6 years — after that, you're playing with house money.
Negotiation context
- It's been on market 22 days — a 2% lower offer ($79k) is reasonable based on typical stale-listing flexibility.
- Current owner paid $45k; list at $80k implies a 78% gain — meaningful room to come down on a strong offer.
Risks & watch-outs
- Watch-outs: built in 1940 — expect roof / HVAC / electrical / plumbing capex.
Questions for the listing agent
- Built in 1940 — when were the roof, HVAC, electrical panel, plumbing, and water heater last replaced?
- Is there a deadline driving the sale (1031 exchange, divorce, estate, relocation)? That informs how much negotiation room exists.
- Schools are A-rated — typically a magnet for longer-tenancy family renters. What's the average tenant stay here, and is there a school-zone premium baked into asking?
- What's the average days-on-market for RENTAL listings here right now (not sales)? A rising rental-DOM trend means longer vacancies and softer asking-rent achievability than the comps imply.
- What's the recent tenant-quality profile in this submarket — average credit score on applications, eviction rate, late-payment / NSF rate, and stable-employment percentage? A property-management company in the area should have these aggregated.
- How much new for-sale + rental construction is in the pipeline within 1–3 miles? Heavy new supply typically softens prices + rents 12–24 months out; constrained supply supports both.
Investment metrics
- 1% rule
- 1.49% ✓
- Cap rate
- 12.12%
- Cash-on-cash
- 20.81%
- DSCR
- 1.93
- GRM
- 5.6
CMA / ARV
- ARV (median comp)
- $140,879
- List price
- $79,900
- Delta
- -43.28%
- Verdict
- UNDERPRICED
- Comps
- 20 within 1.0 mi
Show comp detail 12 sales within ~0.75 mi
| Address | Dist | Beds/Ba | Sqft | Sold | Price | $/sf | Match |
|---|---|---|---|---|---|---|---|
| 1006 5th Ave N | 0.08mi | 3/2.0 | 1,290 (+3%) | 1mo | $145,155 | $113 | 87 |
| 911 6th Ave Ave N | 0.16mi | 3/1.0 | 1,168 (-7%) | 2mo | $115,000 | $98 | 80 |
| 308 2nd St N | 0.58mi | 3/2.0 | 1,252 (-0%) | 0mo | $195,000 | $156 | 68 |
| 815 10th St N | 0.38mi | 3/1.0 | 1,329 (+6%) | 5mo | $218,000 | $164 | 68 |
| 812 9th St N | 0.36mi | 3/3.0 | 1,260 (+1%) | 10mo | $140,000 | $111 | 65 |
| 908 8th Avenue North Ave | 0.28mi | 2/2.0 (-1) | 1,128 (-10%) | 2mo | $182,500 | $162 | 60 |
| 808 9th St N | 0.35mi | 3/2.5 | 1,189 (-5%) | 11mo | $239,000 | $201 | 60 |
| 1 Rainbow Dr. Dr | 0.66mi | 3/1.0 | 1,209 (-4%) | 7mo | $117,000 | $97 | 58 |
| 808 8th St. St N | 0.38mi | 2/1.0 (-1) | 1,094 (-13%) | 2mo | $70,000 | $64 | 55 |
| 102 5th St N | 0.42mi | 2/2.0 (-1) | 1,334 (+6%) | 9mo | $115,000 | $86 | 53 |
| 25 Rainbow Dr | 0.63mi | 3/1.5 | 1,395 (+11%) | 0mo | $119,000 | $85 | 49 |
| 15 2nd St. St N | 0.69mi | 2/2.0 (-1) | 1,080 (-14%) | 5mo | $120,000 | $111 | 32 |
Match score weights: distance 35% · size 25% · config 20% · recency 20%. Top-matched comps best support the ARV.
Projected returns pro-forma
-3.0% appreciation · 3.0% rent growth · sell at horizon
- IRR
- 13.2%
- Equity multiple
- 1.53×
- Total profit
- $11,775
- Equity at exit
- $11,913
- IRR
- 22.1%
- Equity multiple
- 2.88×
- Total profit
- $42,132
- Equity at exit
- $6,908
Cash invested: $22,372 (down + closing). Projections, not guarantees.
Landlord ↔ Tenant lean methodology
- Overall (STATE)
- 83 Strongly Landlord-Friendly
- State Iowa
- 83 Strongly Landlord-Friendly · R+6
- County
- — inherits STATE
- City
- — inherits STATE
ZIP-level market 50548
- Home prices YoY
- -20.0%
- Active inventory
- 62
- Price-to-rent
- 5.6×
Monthly cashflow live
- Estimated rent
- $1,187 medium interval (Pro) →
- Mortgage (P&I)
- −$419
- Tax from tax record
- −$97 /mo · $1,168/yr
- Insurance
- −$33
- HOA
- −$0
- Vacancy / Maint / Mgmt
- −$249
- Net cashflow
- $388
Break-even live
UW: 25.0% down · 7.5% · 30yr · 1.5% tax · 5.0% vac · 8.0% maint · 8.0% mgmt
Financing live
Cash to close
- Down payment
- $19,975
- Closing costs
- $2,397
- Reserves months
- —
- Total cash needed
- —
Loan-product check · same deal, 3 products live
Conventional
25% down · 7.5% · 30yr
- Down + closing
- —
- Monthly P&I
- —
- Monthly cashflow
- —
- DSCR
- —
- Eligible?
- —
Personal DTI + credit; lowest rate.
DSCR
20% down · 8.5% · 30yr
- Down + closing
- —
- Monthly P&I
- —
- Monthly cashflow
- —
- DSCR
- —
- Eligible?
- —
No personal income docs; deal must DSCR.
Hard money
10% down · 12.0% · 12mo
- Down + closing
- —
- Monthly P&I
- —
- Monthly cashflow
- —
- DSCR
- —
- Eligible?
- —
Short-term bridge; refi at stabilization.
Listing history 8 events
-
2026-06-05status $79,900 Pending 22 DOM
-
2026-06-03days on market $79,900 Active 22 DOM
-
2026-06-02days on market $79,900 Active 21 DOM
-
2026-06-01days on market $79,900 Active 20 DOM
-
2026-05-31days on market $79,900 Active 19 DOM
-
2026-05-30days on market $79,900 Active 18 DOM
-
2026-05-12$79,900 Active 666-char remark
-
2022-05-19soldstatus $45,000
ⓘ Source: listings_history table (triggers on properties + properties_extension) + one-shot
backfill from property_details.listing_events for pre-trigger history.
Tax reassessment forecast IA · Partial reset (capped growth)
- Current annual tax
- $1,168 · $97/mo
- Projected year-2 tax
- $1,211 · $101/mo
- Expected delta
- +$43/yr (+$4/mo · 3.7%)
ⓘ Screening estimate from a state-policy table — verify with the county assessor before closing.
Climate risk First Street
- Flood 1/10 Low FEMA zone X (unshaded) · 0% chance over 30 yrs
- Wildfire 1/10 Low
- Heat 2/10 Low 7 d/yr ≥100°F today · 16 d/yr by 30 yrs out
- Wind 2/10 Low
- Air quality 1/10 Low 0 unhealthy d/yr today · 0 by 30 yrs out
Nearby sold comps map
Loading sold comps map…
Walkable amenities ~0.75 mi
Loading nearby amenities…
Taxation est. · year 1
- Rental income
- $14,241
- − Mortgage interest
- −$4,476
- − Property taxes
- −$1,168
- − Insurance
- −$400
- − Repairs & maintenance
- −$1,139
- − Management
- −$1,139
- − Depreciation
- −$2,324
- Taxable income
- $3,595
- Est. tax owed @ 24.0%
- −$863
- After-tax cash flow
- $3,792/yr
For passive investors: Depreciation is non-cash, so a rental often shows a tax loss while cash-flowing — sheltering income. Rental losses are passive: they offset passive income freely, and up to $25,000/yr can offset ordinary (W-2) income if you actively participate and your MAGI is under $100k (phasing out to $0 by $150k); unused losses carry forward. On sale, claimed depreciation is recaptured at up to 25%, and gains may owe capital-gains tax (a 1031 exchange can defer both). Figures are a year-1 estimate at your 24.0% rate — not tax advice; consult a CPA.
Schools (NCES district)
- District
- Humboldt Community School District
- NCES district ID
- 1914370
- Math proficiency
- 75% ▼ -5.00%
- Reading proficiency
- 72% ▼ -7.00%
- Median HH income
- $48,318
- Composite
- 62.13/100
- National rank
- #707
- State rank
- #92 of 289 in IA
Livability — Humboldt
- Score
- 83/100
- State rank
- #34
- US rank
- #1000
Category grades
Schools grade is shown separately in the Schools card above.
Census & demographics
- Census place
- Humboldt, IA
- City population
- 5,482
- Population (ZIP)
- 5,482
Population outlook (Humboldt County) Hauer SSP2
- Today (2025)
- 9,265 people
- By 2030
- 9,141 · -1.3%
- By 2040
- 8,904 · -3.9%
- By 2050
- 8,448 · -8.8%
- By 2075
- 7,742 · -16.4%
- By 2100
- 6,414 · -30.8%
Race, ethnicity, and origin ACS 2023
- Neighborhood character
- Predominantly White (94%)
- Race & ethnicity
- White 94% Two or more races 5% Hispanic / Latino 4% Asian 1%
- Common ancestry
- Portuguese 14% Iranian 2% Italian 1%
- Foreign-born
- 3% · Canada
- Languages at home
- 97% English-only · Spanish 3%
Political lean MEDSL · Humboldt
- 2024 margin
- Solid R (+50.0) · D 24.4% · R 74.4% · Other 1.2%
- 2008→2024 swing
- -35.7pp toward R · 2008: -14.3pp · 2024: -50.0pp
- All cycles
- 2024: R+50.0 2020: R+44.6 2016: R+46.0 2012: R+22.1 2008: R+14.3
Not yet ingested
- Civics
- —
Market trends
- HPI YoY
- ▼ -51.69%
- Current HPI
- 206.5373
- Rent YoY
- —
- Metro
- —
- State GDP YoY
- ▲ 2.48%
- F500 in state
- 4
Industry mix (Fortune 500 HQ in IA)
| Industry | F500 HQs | Revenue |
|---|---|---|
| Financial Services | 1 | $16B |
|
||
| Retail / Convenience | 1 | $15B |
|
||
Price history
+77.6% since first listed3 events — show timeline
- 2026-06-03 Pending — IAR
- 2026-05-12 Listed $79,900 IAR
- 2022-05-19 Sold (Public Records) $45,000 Public Records
Property tax history
+6.3%/yrLatest (2025): $1,168 · +26.4% YoY. Source: county tax records.
Cash-flow waterfall
monthlySold comps — $/sqft
last 12 mo · ≤1 miLoading sold comps…