 Duplex
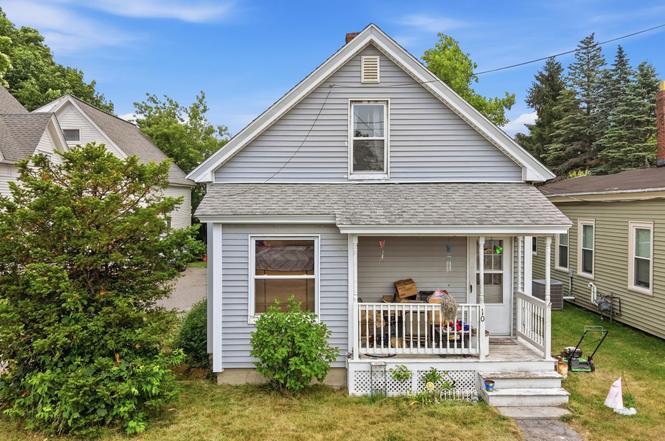
10 Birch St · Derry, NH
Flood risk 1/10 · Minimal
- FEMA flood zone
- X (unshaded)
- Chance of flooding over 30 yrs
- 0.0%
- Est. flood insurance / yr
- $473 – $860
Fire risk 1/10 · Minimal
- Est. fire insurance / yr
- $507 – $941
Heat risk 4/10 · Minor
- Hot days now (above 95°F)
- 8 days/yr
- Hot days in 30 yrs
- 17 days/yr
Wind risk 6/10 · Moderate
- Chance of severe wind over 30 yrs
- 27.0%
Air-quality risk 2/10 · Minimal
- Unhealthy air days now
- 2 days/yr
- Unhealthy air days in 30 yrs
- 2 days/yr
Risk factors via First Street. Map © Google.
Why this score? — see what drove the D- grade
The composite is a weighted blend of 9 inputs, each scored 0–100. Each bar is that input's sub-score; the figure is the points it added to the 100-point composite (weight × sub-score).
- Cash flow +14.0/30.0
- DSCR +4.3/10.0
- 1% rule +4.0/10.0
- Livability +4.0/5.0
- Schools +3.6/10.0
- Rent growth +2.7/5.0
- Condition / age +2.5/5.0
- ARV discount +1.1/15.0
- Appreciation +0.0/10.0
$460,000
🖨 Deal sheet (PDF) 📄 Offer letter ✓ Due diligence
Multi-family units
County records classify this as Multi-Family (2-4 Unit). Listing-text estimate: 2 units. confirmed
Listing remarks MLS
GREAT INVESTMENT opportunity in Derry's Central Business District, close to downtown and Parkland Hospital. Updates include roof in 2009, Unit 2 kitchen in 2008, new front porch 2012, both bathrooms updaated in 2013, hot water tank in 2012. Unit 1 has 3 bedrooms and Unit 2 has 2 levels with loft bedroom. Long time renters looking to stay. Walk to restaurants, library, shopping, library. Close to highways. Don't miss this great investment!
Key facts
- 0.10 acre lot
- Large open layout
- Loft-style bedroom
Tags
Property features AI
Finance
- Financial info: Total of 2 rental units with month-to-month leases; Unit mix: one 3-bedroom unit and one 1-bedroom unit
Exterior
- Parking: Paved driveway
- Utilities: Public water; Public sewer; Circuit breaker electrical service; High-speed internet available; Other utilities available
- Home design: Duplex / multi-family building; Existing structure; White exterior
- Construction: Built in 1915; Wood frame construction; Asphalt shingle roof; Concrete foundation
- Exterior features: Landscaped lot; In-town location near shopping; Paved driveway; Public road frontage
Interior
- Bedrooms: One unit with 3 bedrooms (Unit 1); One unit with 1 bedroom (Unit 2)
- Bathrooms: Each unit has 1 bathroom
- Heating & cooling: Heating by propane and oil with forced air; No central cooling
- Interior features: Basement with interior access; Basement is unfinished with concrete, crawl space, and storage areas
Neighborhood map
What this means for you Summary
Snapshot
- This is a 2 × 2-bed/1.0-bath units multifamily listed at $460k.
Deal economics
- At list price, monthly cash flow is $62 ($742/yr) — positive. Per door: $31/mo.
- The deal already cash-flows at list — no discount required.
- To meet the 1% rule (rent ≥ 1% of price), the offer needs to be $412k (10.5% below list).
- Recommended offer: $412k (10.5% below list) — sets the bar for 1% rule.
- Cap rate 6.5% vs local median 2.2% in Derry — top-decile yield for the area; either an underpriced asset or a hidden risk that comps aren't pricing in. Stress-test before assuming the spread holds.
Location & tenants
- Location reads 81/100 on livability (#13 in NH, #1,420 nationally) — a professional / high-income tenant draw. Strengths: crime A+, amenities A+, housing A+; Watch: commute F.
- Derry School District (suburban): math 33% / reading 46% proficiency, ranked #62 of 98 in NH (top 63%) — families likely to look elsewhere, expect single-tenant / working-renter base with shorter leases; only 18% free/reduced lunch — higher-income household profile.
- Market conditions: Rents flat; 120 active listings in the ZIP; 4 comparable units currently listed for rent nearby; rentals leasing fast (median 0d on market — plan ~1-2 weeks tenant-placement turnaround); solid renter incomes; 1,276 units permitted in Rockingham County in 2024 (593 in 5+ unit buildings).
- At $4,119/mo this rent would consume 46% of the median local household income ($108k/yr) (locally 761% of renters already pay >50% of income on rent) — very limited rent-growth headroom before tenants either downsize or default.
Forward outlook
- Local home prices are declining (-3.0%/yr); year-one equity from $3k of loan paydown is wiped out by about $14k of value loss. Plan a longer hold.
Negotiation context
- Only 1 days on market — expect competitive offers; lowballing is unlikely to land.
- 8 sale attempts since 28y ago with the ask held roughly flat each time — persistent listings suggest the price (not the market) is what's stuck; bring a comps-based counter.
- Current owner paid $171k; list at $460k implies a 169% gain — meaningful room to come down on a strong offer.
Risks & watch-outs
- Watch-outs: built in 1915 — expect roof / HVAC / electrical / plumbing capex.
- Climate carrying-cost: major wind risk, 27% chance of damaging wind over 30y — expect insurance premiums to compound above CPI over the hold.
Questions for the listing agent
- Can we see the unit-by-unit rent roll, current vacancy, and any below-market leases? What's the average tenancy length?
- What capital expenditures (roof, boiler, parking lot, exteriors) have been made in the last 5 years, and what's planned in the next 2?
- Built in 1915 — when were the roof, HVAC, electrical panel, plumbing, and water heater last replaced?
- Is there a deadline driving the sale (1031 exchange, divorce, estate, relocation)? That informs how much negotiation room exists.
- Schools are B-rated — typically a magnet for longer-tenancy family renters. What's the average tenant stay here, and is there a school-zone premium baked into asking?
- The area grade is low — what's the realistic commute time and amenity access for the typical tenant pool here? Any planned neighborhood developments (good or bad) we should know about?
- What's the average days-on-market for RENTAL listings here right now (not sales)? A rising rental-DOM trend means longer vacancies and softer asking-rent achievability than the comps imply.
- What's the recent tenant-quality profile in this submarket — average credit score on applications, eviction rate, late-payment / NSF rate, and stable-employment percentage? A property-management company in the area should have these aggregated.
- How much new apartment / multifamily construction is in the pipeline within 1–3 miles? Heavy new supply (>2% of stock underway) typically softens rents 12–24 months out; light construction supports rent growth.
Investment metrics
- 1% rule
- 0.90% ✗
- Cap rate
- 6.45%
- Cash-on-cash
- 0.58%
- DSCR
- 1.03
- GRM
- 9.3
CMA / ARV
- ARV (on-the-fly)
- $402,711
- Comps found
- 1
Show comp detail 1 sale within ~0.75 mi
| Address | Dist | Beds/Ba | Sqft | Sold | Price | $/sf | Match |
|---|---|---|---|---|---|---|---|
| 4 Clark | 0.67mi | 3/3.0 (-1) | 1,660 (-1%) | 17mo | $400,000 | $241 | 49 |
Match score weights: distance 35% · size 25% · config 20% · recency 20%. Top-matched comps best support the ARV.
Projected returns pro-forma
-3.0% appreciation · 0.89% rent growth · sell at horizon
- IRR
- -17.8%
- Equity multiple
- 0.39×
- Total profit
- $-79,098
- Equity at exit
- $68,587
- IRR
- -14.6%
- Equity multiple
- 0.25×
- Total profit
- $-97,211
- Equity at exit
- $39,772
Cash invested: $128,800 (down + closing). Projections, not guarantees.
Landlord ↔ Tenant lean methodology
- Overall (STATE)
- 56 Moderately Landlord-Leaning
- State New Hampshire
- 56 Moderately Landlord-Leaning · D+1
- County
- — inherits STATE
- City
- — inherits STATE
ZIP-level market 03038
- Rents YoY
- 0.9%
- Active inventory
- 120
- Price-to-rent
- 18.6×
Monthly cashflow live
- Estimated rent
- $4,119 high interval (Pro) →
- Mortgage (P&I)
- −$2,412
- Tax from tax record
- −$588 /mo · $7,059/yr
- Insurance
- −$192
- HOA
- −$0
- Vacancy / Maint / Mgmt
- −$865
- Net cashflow
- $62
Break-even live
Sensitivity live
| Price | -10% $322 | -5% $192 | +0% $62 | +5% $-68 | +10% $-199 |
|---|---|---|---|---|---|
| Rent | -10% $-264 | -5% $-101 | +0% $62 | +5% $225 | +10% $387 |
| Rate | -1.0pp $293 | -0.5pp $179 | base $62 | +0.5pp $-57 | +1.0pp $-179 |
2-unit breakdown (identical units grouped — click to expand)
| Units | Beds | Baths | Est. rent |
|---|---|---|---|
| 2× units | 2 | 1 | $4,118 |
| #1 | 2 | 1 | $2,059 |
| #2 | 2 | 1 | $2,059 |
| Total (2 units) | $4,119 | ||
UW: 25.0% down · 7.5% · 30yr · 1.5% tax · 5.0% vac · 8.0% maint · 8.0% mgmt
Financing live
Cash to close
- Down payment
- $115,000
- Closing costs
- $13,800
- Reserves months
- —
- Total cash needed
- —
Loan-product check · same deal, 3 products live
Conventional
25% down · 7.5% · 30yr
- Down + closing
- —
- Monthly P&I
- —
- Monthly cashflow
- —
- DSCR
- —
- Eligible?
- —
Personal DTI + credit; lowest rate.
DSCR
20% down · 8.5% · 30yr
- Down + closing
- —
- Monthly P&I
- —
- Monthly cashflow
- —
- DSCR
- —
- Eligible?
- —
No personal income docs; deal must DSCR.
Hard money
10% down · 12.0% · 12mo
- Down + closing
- —
- Monthly P&I
- —
- Monthly cashflow
- —
- DSCR
- —
- Eligible?
- —
Short-term bridge; refi at stabilization.
Rent comps 4 comps
| Address | Beds | Baths | Sqft | Rent | $/sqft | DOM | Units | Dist |
|---|---|---|---|---|---|---|---|---|
| 7 Howard St Derry, NH | 3.0 | 2.0 | 1889 | $3,500 | $1.85 | 26d | 1 | 0.41mi |
| 39 S Main St Derry, NH | 3.0 | 1.0 | 2000 | $2,695 | $1.35 | 0d | 1 | 0.86mi |
| 41 Governor Bell Dr Londonderry, NH | 1.0–3.0 | 1.0–2.0 | 1144 | $4,482 | $3.92 | 0d | 12 | 1.40mi |
| 30 Main St Londonderry, NH | 1.0–3.0 | 1.0–2.0 | 1175 | $3,700 | $3.15 | 0d | 10 | 1.41mi |
Listing history 2 events
-
2026-06-21remarks 693-char remark
-
2026-06-21$460,000 Active 1 DOM
ⓘ Source: listings_history table (triggers on properties + properties_extension) + one-shot
backfill from property_details.listing_events for pre-trigger history.
Tax reassessment forecast NH · Partial reset (capped growth)
- Current annual tax
- $7,059 · $588/mo
- Projected year-2 tax
- $8,544 · $712/mo
- Expected delta
- +$1,484/yr (+$124/mo · 21.0%)
ⓘ Screening estimate from a state-policy table — verify with the county assessor before closing.
Climate risk First Street
- Flood 1/10 Low FEMA zone X (unshaded) · 0% chance over 30 yrs
- Wildfire 1/10 Low
- Heat 4/10 Moderate 8 d/yr ≥95°F today · 17 d/yr by 30 yrs out
- Wind 6/10 Major 27% chance of damaging wind over 30 yrs
- Air quality 2/10 Low 2 unhealthy d/yr today · 2 by 30 yrs out
Nearby sold comps map
Loading sold comps map…
Walkable amenities ~0.75 mi
Loading nearby amenities…
Taxation est. · year 1
- Rental income
- $49,428
- − Mortgage interest
- −$25,767
- − Property taxes
- −$7,059
- − Insurance
- −$2,300
- − Repairs & maintenance
- −$3,954
- − Management
- −$3,954
- − Depreciation
- −$13,382
- Taxable loss
- −$6,988
- Est. tax savings @ 24.0%
- +$1,677
- After-tax cash flow
- $2,419/yr
For passive investors: Depreciation is non-cash, so a rental often shows a tax loss while cash-flowing — sheltering income. Rental losses are passive: they offset passive income freely, and up to $25,000/yr can offset ordinary (W-2) income if you actively participate and your MAGI is under $100k (phasing out to $0 by $150k); unused losses carry forward. On sale, claimed depreciation is recaptured at up to 25%, and gains may owe capital-gains tax (a 1031 exchange can defer both). Figures are a year-1 estimate at your 24.0% rate — not tax advice; consult a CPA.
Schools (NCES district)
- District
- Derry School District
- NCES district ID
- 3302610
- Math proficiency
- 33% ▼ -15.00%
- Reading proficiency
- 46% ▼ -5.00%
- Median HH income
- $67,579
- Composite
- 35.71/100
- National rank
- #4863
- State rank
- #62 of 98 in NH
Livability — Derry
- Score
- 81/100
- State rank
- #13
- US rank
- #1420
Category grades
Schools grade is shown separately in the Schools card above.
Census & demographics
- Census place
- Derry, NH
- County
- Rockingham County · 137,526 people
- City population
- 34,474
- Metro
- Boston-Cambridge-Newton, MA-NH
- Population (ZIP)
- 34,474
- Household income
- $108,322
- Rent vs Own
- Severe rent burden
- 761.0
Population outlook (Rockingham County) Hauer SSP2
- Today (2025)
- 316,118 people
- By 2030
- 320,929 · +1.5%
- By 2040
- 323,358 · +2.3%
- By 2050
- 314,977 · -0.4%
- By 2075
- 297,686 · -5.8%
- By 2100
- 256,363 · -18.9%
Race, ethnicity, and origin ACS 2023
- Neighborhood character
- Predominantly White (91%)
- Race & ethnicity
- White 91% Hispanic / Latino 4% Two or more races 4% Asian 1%
- Common ancestry
- Lithuanian 12% Romanian 5% Slovak 3%
- Foreign-born
- 4% · Canada, China
- Languages at home
- 94% English-only · Spanish 2% Other Indo-European 1% French/Haitian/Cajun 1%
Political lean MEDSL · Rockingham
- 2024 margin
- Toss-up / Even · D 48.3% · R 50.8%
- 2008→2024 swing
- -3.5pp toward R · 2008: 1.1pp · 2024: -2.4pp
- All cycles
- 2024: R+2.4 2020: D+2.1 2016: R+5.8 2012: R+4.5 2008: D+1.1
Not yet ingested
- Civics
- —
Market trends
- HPI YoY
- ▼ -239.00%
- Current HPI
- 332.8122
- Rent YoY
- ▲ 0.89%
- Metro
- Boston-Cambridge-Newton, MA-NH
- State GDP YoY
- —
- F500 in state
- 0
Price history
+411.7% since first listed26 events — show timeline
- 2026-06-20 Listed $460,000 PrimeMLS
- 2016-03-30 Sold (MLS) $170,900 MLS PIN
- 2016-03-29 Sold (Public Records) $170,933 Public Records
- 2016-03-28 Sold (MLS) $170,900 PrimeMLS
- 2016-02-10 Pending — MLS PIN
- 2016-02-05 Contingent — PrimeMLS
- 2016-01-26 Price Changed $175,900 PrimeMLS
- 2015-11-17 Price Changed $189,900 PrimeMLS
- 2015-11-17 Price Changed $189,900 MLS PIN
- 2015-10-26 Listed $199,900 MLS PIN
- 2015-10-25 Listed $199,900 PrimeMLS
- 2004-06-04 Sold (MLS) $198,000 MLS PIN
- 2004-04-09 Listing Removed — MLS PIN
- 2004-03-25 Listed $209,900 MLS PIN
- 2001-10-25 Sold (MLS) $130,000 PrimeMLS
- 2001-09-07 Delisted — PrimeMLS
- 2001-02-14 Listed $134,900 PrimeMLS
- 1999-12-30 Sold (MLS) $114,500 PrimeMLS
- 1999-12-30 Sold (MLS) $114,500 PrimeMLS
- 1999-12-22 Delisted — PrimeMLS
- 1999-12-22 Delisted — PrimeMLS
- 1999-06-25 Listed $119,500 PrimeMLS
- 1998-09-24 Listed $119,500 PrimeMLS
- 1998-08-11 Sold (MLS) $81,000 PrimeMLS
- 1998-06-18 Delisted — PrimeMLS
- 1998-05-01 Listed $89,900 PrimeMLS
Property tax history
+6.7%/yrLatest (2025): $7,059 · +1.6% YoY. Source: county tax records.
Cash-flow waterfall
monthlySold comps — $/sqft
last 12 mo · ≤1 miLoading sold comps…