5033 County Road 335 #96 · New Castle, CO
Flood risk 1/10 · Minimal
- FEMA flood zone
- X
- Chance of flooding over 30 yrs
- 0.0%
- Est. flood insurance / yr
- $507 – $1,088
Fire risk 6/10 · Moderate
- Est. fire insurance / yr
- $939 – $1,743
Heat risk 3/10 · Minor
- Hot days now (above 89°F)
- 7 days/yr
- Hot days in 30 yrs
- 19 days/yr
Wind risk 1/10 · Minimal
- Chance of severe wind over 30 yrs
- —
Air-quality risk 1/10 · Minimal
- Unhealthy air days now
- 0 days/yr
- Unhealthy air days in 30 yrs
- 0 days/yr
Risk factors via First Street. Map © Google.
Why this score? — see what drove the B- grade
The composite is a weighted blend of 9 inputs, each scored 0–100. Each bar is that input's sub-score; the figure is the points it added to the 100-point composite (weight × sub-score).
- Cash flow +30.0/30.0
- DSCR +10.0/10.0
- 1% rule +9.9/10.0
- ARV discount +7.5/15.0
- Livability +3.5/5.0
- Rent growth +2.5/5.0
- Schools +2.4/10.0
- Condition / age +2.2/5.0
- Appreciation +0.0/10.0
$75,000
🖨 Deal sheet 📄 Offer letter ✓ Due diligence
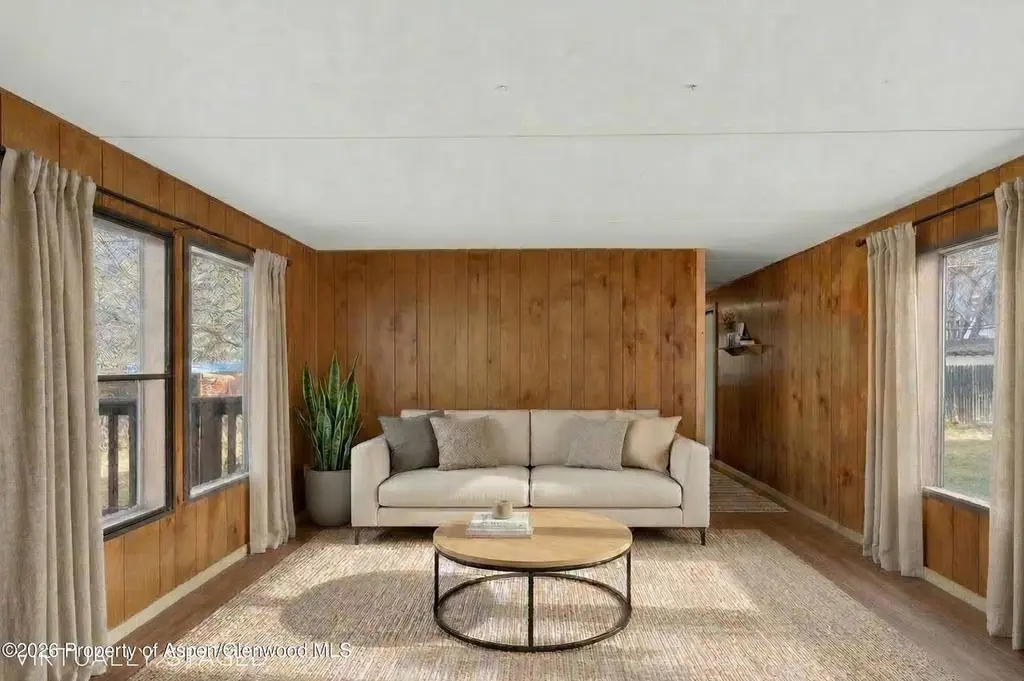
Listing remarks
Seller agrees to provide Buyer with a $1,000 credit at closing as a buyer incentive. This credit shall be applied toward Buyer's closing costs, provided that the transaction closes on or before July 1, 2026. This two bed, one bath mobile home is nestled in an established community that offers nearby parks, open grass areas, and plenty of opportunity to experience outdoor recreation. Soak in warm days in the yard under mature trees & savor summer evening BBQ's on the deck while a game of horseshoes gets started. Both affordable and full of potential- this home offers a wonderful opportunity to experience Colorado living! * Please contact the Listing Agent for available Lender Finan
Key facts
- Open grassy areas
- Outdoor recreation
- Nearby parks
Tags
Property features AI
Exterior
- Home design: HUD model mobile home
- Construction: Metal roof; New construction: No
- Exterior features: Located in the Apple Tree subdivision; Directions: Exit 105, right on County Road 335; at Apple Tree turn right on Third Street; mobile home will be on the right — #96
Interior
- Kitchen: Range; Refrigerator
- Bedrooms: Bedroom 1; Bedroom 2
- Bathrooms: 1 full bathroom
- Heating & cooling: Forced air heating
- Interior features: Four total rooms; Good overall condition
- Laundry & utility: Washer; Dryer
Neighborhood map
What this means for you Summary
Snapshot
- This is a 2-bed/1.0-bath manufactured listed at $75k. Condition is rated fair.
Deal economics
- At list price, monthly cash flow is $365 ($4k/yr) — positive.
- The deal already cash-flows at list — no discount required.
- Meets the 1% rule at list price ($1k rent vs $75k).
- Recommended offer: $70k (6.0% below list) — sets the bar for market timing.
- Cap rate 12.1% vs local median 0.9% in New Castle — top-decile yield for the area; either an underpriced asset or a hidden risk that comps aren't pricing in. Stress-test before assuming the spread holds.
Location & tenants
- Location reads 70/100 on livability (#87 in CO) — a middle-class / working-renter tenant base. Strengths: crime A+, employment A+, housing A+; Watch: schools D, amenities F, cost of living F.
- Garfield School District No. Re-2 (town): math 16% / reading 36% proficiency, ranked #61 of 86 in CO (top 71%) — low school quality limits family demand, transient renter base, plan for 1-2y turnover.
- Market conditions: 106 active listings in the ZIP; 171 units permitted in Garfield County in 2024 (64 in 5+ unit buildings).
Forward outlook
- Local home prices are declining (-3.0%/yr); year-one equity from $519 of loan paydown is wiped out by about $2k of value loss. Plan a longer hold.
- Garfield County population projected at +5% by 2050 — modest demand growth; plan on rents tracking national, not racing it.
- At projected returns (-3.0% appreciation + 3.0% rent growth), your $21k cash investment doubles in ~6 years — after that, you're playing with house money.
Negotiation context
- It's been on market 72 days — a 6% lower offer ($70k) is reasonable based on typical stale-listing flexibility.
Risks & watch-outs
- Climate carrying-cost: major wildfire risk — expect insurance premiums to compound above CPI over the hold.
Questions for the listing agent
- It's been on market 72 days. Have you received any prior offers? Is the seller open to a 6% concession, seller financing, or rate buy-down credit?
- Have any recent inspections been done? Can we get a copy of the seller's disclosures and any deferred-maintenance estimates?
- Why hasn't it sold? Are there any deal-killer items the seller is aware of (foundation, flood, title, zoning, code violations)?
- Is there a deadline driving the sale (1031 exchange, divorce, estate, relocation)? That informs how much negotiation room exists.
- Schools are D-rated, which usually means shorter tenancies and higher turnover. Who's the typical renter profile here, and what's been the actual vacancy rate?
- What's the average days-on-market for RENTAL listings here right now (not sales)? A rising rental-DOM trend means longer vacancies and softer asking-rent achievability than the comps imply.
- What's the recent tenant-quality profile in this submarket — average credit score on applications, eviction rate, late-payment / NSF rate, and stable-employment percentage? A property-management company in the area should have these aggregated.
- How much new for-sale + rental construction is in the pipeline within 1–3 miles? Heavy new supply typically softens prices + rents 12–24 months out; constrained supply supports both.
Investment metrics
- 1% rule
- 1.49% ✓
- Cap rate
- 12.14%
- Cash-on-cash
- 20.87%
- DSCR
- 1.93
- GRM
- 5.6
CMA / ARV
No comps found within radius.
Projected returns pro-forma
-3.0% appreciation · 3.0% rent growth · sell at horizon
- IRR
- 13.3%
- Equity multiple
- 1.53×
- Total profit
- $11,127
- Equity at exit
- $11,183
- IRR
- 22.1%
- Equity multiple
- 2.89×
- Total profit
- $39,712
- Equity at exit
- $6,485
Cash invested: $21,000 (down + closing). Projections, not guarantees.
Landlord ↔ Tenant lean methodology
- Overall (STATE)
- 38 Tenant-Leaning
- State Colorado
- 38 Tenant-Leaning · D+4
- County
- — inherits STATE
- City
- — inherits STATE
ZIP-level market 81647
- Home prices YoY
- -5.8%
- Active inventory
- 106
- Price-to-rent
- 5.6×
Monthly cashflow live
- Estimated rent
- $1,118 medium interval (Pro) →
- Mortgage (P&I)
- −$393
- Tax est. 1.5%
- −$94 /mo · $1,125/yr
- Insurance
- −$31
- HOA
- −$0
- Vacancy / Maint / Mgmt
- −$235
- Net cashflow
- $365
Break-even live
UW: 25.0% down · 7.5% · 30yr · 1.5% tax · 5.0% vac · 8.0% maint · 8.0% mgmt
Financing live
Cash to close
- Down payment
- $18,750
- Closing costs
- $2,250
- Reserves months
- —
- Total cash needed
- —
Loan-product check · same deal, 3 products live
Conventional
25% down · 7.5% · 30yr
- Down + closing
- —
- Monthly P&I
- —
- Monthly cashflow
- —
- DSCR
- —
- Eligible?
- —
Personal DTI + credit; lowest rate.
DSCR
20% down · 8.5% · 30yr
- Down + closing
- —
- Monthly P&I
- —
- Monthly cashflow
- —
- DSCR
- —
- Eligible?
- —
No personal income docs; deal must DSCR.
Hard money
10% down · 12.0% · 12mo
- Down + closing
- —
- Monthly P&I
- —
- Monthly cashflow
- —
- DSCR
- —
- Eligible?
- —
Short-term bridge; refi at stabilization.
Listing history 11 events
-
2026-06-19days on market $75,000 Active 72 DOM
-
2026-06-18days on market $75,000 Active 71 DOM
-
2026-06-17days on market $75,000 Active 70 DOM
-
2026-06-16days on market $75,000 Active 69 DOM
-
2026-06-15days on market $75,000 Active 68 DOM
-
2026-06-14days on market $75,000 Active 66 DOM
-
2026-06-12remarks 695-char remark
-
2026-06-12pricestatusdays on market $75,000 Active 65 DOM
-
2026-05-21status Pending
-
2026-04-23price $78,000
-
2026-03-20$99,000 Active
ⓘ Source: listings_history table (triggers on properties + properties_extension) + one-shot
backfill from property_details.listing_events for pre-trigger history.
Climate risk First Street
- Flood 1/10 Low FEMA zone X · 0% chance over 30 yrs
- Wildfire 6/10 Major
- Heat 3/10 Moderate 7 d/yr ≥89°F today · 19 d/yr by 30 yrs out
- Wind 1/10 Low
- Air quality 1/10 Low 0 unhealthy d/yr today · 0 by 30 yrs out
Nearby sold comps map
Loading sold comps map…
Walkable amenities ~0.75 mi
Loading nearby amenities…
Taxation est. · year 1
- Rental income
- $13,421
- − Mortgage interest
- −$4,201
- − Property taxes
- −$1,125
- − Insurance
- −$375
- − Repairs & maintenance
- −$1,074
- − Management
- −$1,074
- − Depreciation
- −$2,182
- Taxable income
- $3,391
- Est. tax owed @ 24.0%
- −$814
- After-tax cash flow
- $3,569/yr
For passive investors: Depreciation is non-cash, so a rental often shows a tax loss while cash-flowing — sheltering income. Rental losses are passive: they offset passive income freely, and up to $25,000/yr can offset ordinary (W-2) income if you actively participate and your MAGI is under $100k (phasing out to $0 by $150k); unused losses carry forward. On sale, claimed depreciation is recaptured at up to 25%, and gains may owe capital-gains tax (a 1031 exchange can defer both). Figures are a year-1 estimate at your 24.0% rate — not tax advice; consult a CPA.
Condition & rehab AI · 13 photos
This mobile home has average interior and exterior conditions, with minor repairs needed in the kitchen and bathroom. Painting and updating countertops would significantly enhance its value.
Repairs flagged
- Minor kitchen cabinets — slight wear
- Minor bathroom window — small and possibly drafty
Value-add opportunities
- Both paint interior walls — enhances curb appeal and interior aesthetics
- Both replace kitchen countertops — improves functionality and appearance
Renovation cost estimate screening
| Repair item | Severity | Est. cost |
|---|---|---|
| kitchen cabinets · slight wear | Minor | $500–3,000 |
| bathroom window · small and possibly drafty | Minor | $500–3,000 |
| Total estimated repair cost · 2 items | $1,000–6,000 |
Value-add ROI direction
- Both paint interior walls — enhances curb appeal and interior aesthetics ↑
- Both replace kitchen countertops — improves functionality and appearance ↑
ⓘ Cost ranges are severity-bucket heuristics (US national rule-of-thumb). Get contractor quotes + a written scope before underwriting a rehab budget.
Schools (NCES district)
- District
- Garfield School District No. Re-2
- NCES district ID
- 0806240
- Math proficiency
- 16% ▼ -7.00%
- Reading proficiency
- 36% ▼ -1.00%
- Median HH income
- $60,207
- Composite
- 23.78/100
- National rank
- #7811
- State rank
- #61 of 86 in CO
Livability — New Castle
- Score
- 70/100
- State rank
- #87
- US rank
- #7758
Category grades
Schools grade is shown separately in the Schools card above.
Census & demographics
- City population
- 7,037
- Population (ZIP)
- 7,037
Population outlook (Garfield County) Hauer SSP2
- Today (2025)
- 61,756 people
- By 2030
- 63,255 · +2.4%
- By 2040
- 64,952 · +5.2%
- By 2050
- 64,937 · +5.2%
- By 2075
- 62,413 · +1.1%
- By 2100
- 55,730 · -9.8%
Race, ethnicity, and origin ACS 2023
- Neighborhood character
- Majority White (62%)
- Race & ethnicity
- White 62% Hispanic / Latino 33% Two or more races 21%
- Hispanic origin (detail)
- Mexican 25%
- Common ancestry
- Slovak 3% Serbian 3% Lithuanian 2%
- Foreign-born
- 12% · Canada
- Languages at home
- 75% English-only · Spanish 23% Other Indo-European 1% German/W. Germanic 1%
Political lean MEDSL · Garfield
- 2024 margin
- Toss-up / Even · D 49.8% · R 47.7% · Other 2.5%
- 2008→2024 swing
- +2.1pp toward D · 2008: -0.0pp · 2024: 2.1pp
- All cycles
- 2024: D+2.1 2020: D+2.3 2016: R+7.1 2012: R+4.9 2008: R+0.0
Not yet ingested
- Civics
- —
Market trends
- HPI YoY
- ▼ -34.66%
- Current HPI
- 565.0918
- Rent YoY
- —
- Metro
- —
- State GDP YoY
- ▲ 1.95%
- F500 in state
- 14
Industry mix (Fortune 500 HQ in CO)
| Industry | F500 HQs | Revenue |
|---|---|---|
| Technology Distribution | 1 | $31B |
|
||
| Food / Agriculture | 1 | $18B |
|
||
| Packaging | 1 | $14B |
|
||
| Healthcare | 1 | $13B |
|
||
| Energy | 1 | $10B |
|
||
| Technology | 1 | $4B |
|
||
Price history
-21.2% since first listed3 events — show timeline
- 2026-05-21 Pending — AGMLS
- 2026-04-23 Price Changed $78,000 AGMLS
- 2026-03-20 Listed $99,000 AGMLS
Cash-flow waterfall
monthlySold comps — $/sqft
last 12 mo · ≤1 miLoading sold comps…