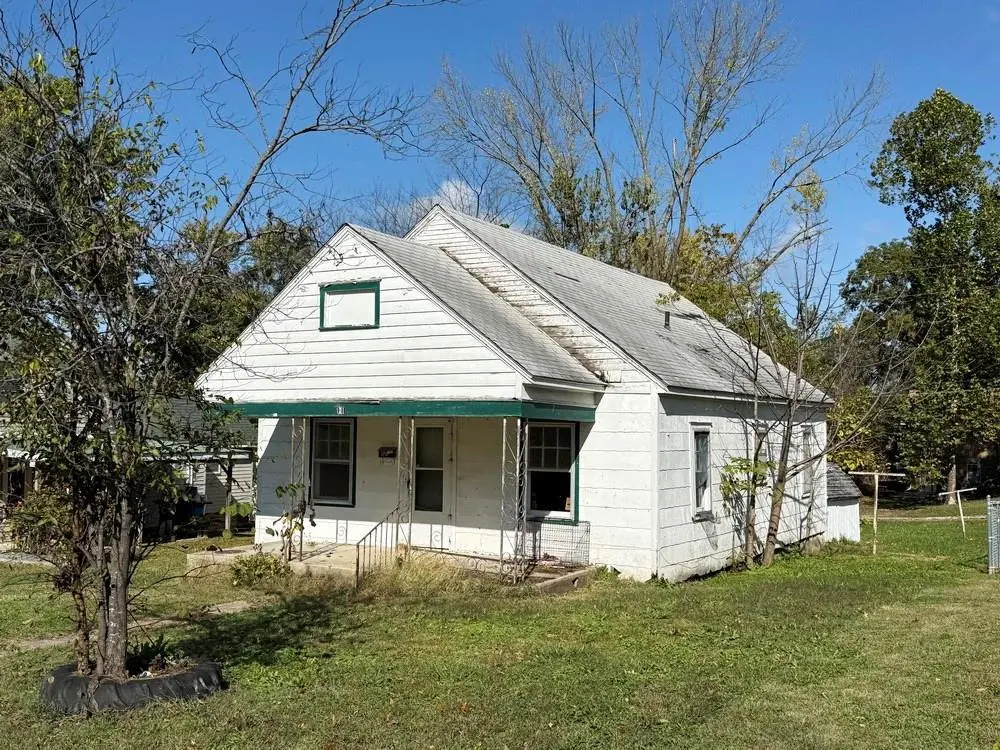
121 W Lafayette St · El Dorado Springs, MO
Flood risk 1/10 · Minimal
- FEMA flood zone
- X (unshaded)
- Chance of flooding over 30 yrs
- 0.0%
- Est. flood insurance / yr
- $507 – $1,088
Fire risk 4/10 · Minor
- Est. fire insurance / yr
- $1,054 – $1,958
Heat risk 5/10 · Moderate
- Hot days now (above 108°F)
- 7 days/yr
- Hot days in 30 yrs
- 18 days/yr
Wind risk 2/10 · Minimal
- Chance of severe wind over 30 yrs
- 2.0%
Air-quality risk 2/10 · Minimal
- Unhealthy air days now
- 0 days/yr
- Unhealthy air days in 30 yrs
- 1 days/yr
Risk factors via First Street. Map © Google.
Why this score? — see what drove the C- grade
The composite is a weighted blend of 9 inputs, each scored 0–100. Each bar is that input's sub-score; the figure is the points it added to the 100-point composite (weight × sub-score).
- Cash flow +15.0/30.0
- Appreciation +10.0/10.0
- ARV discount +7.5/15.0
- 1% rule +5.0/10.0
- DSCR +5.0/10.0
- Livability +3.1/5.0
- Rent growth +2.5/5.0
- Condition / age +2.5/5.0
- Schools +2.4/10.0
$12,500
🖨 Deal sheet (PDF) 📄 Offer letter ✓ Due diligence
Listing remarks MLS
Fixer Upper Bungalow for Sale in El Dorado Springs, MO. If you're looking an investment property check out this property. Just listed in El Dorado Springs is a fixer-upper property ready for the savvy investor who isn't afraid of doing some work. This modest home conveniently located in the center of town creating an appealing location to potential renters. Home is 768 sq ft featuring 2 bedrooms and one bathroom. Call today to inquire about this affordable investment.
Key facts
- Investment property
- Appealing location
- 6,534 sq ft lot
Tags
Neighborhood map
What this means for you Summary
Snapshot
- This is a 2-bed/1.0-bath single-family listed at $12k.
Deal economics
- At list price, monthly cash flow is $1k ($13k/yr) — positive.
- The deal already cash-flows at list — no discount required.
- Meets the 1% rule at list price ($1k rent vs $12k).
- Recommended offer: $11k (12.0% below list) — sets the bar for market timing.
- Cap rate 108.0% vs local median 4.9% in El Dorado Springs — top-decile yield for the area; either an underpriced asset or a hidden risk that comps aren't pricing in. Stress-test before assuming the spread holds.
Location & tenants
- Location reads 62/100 on livability (#370 in MO) — a middle-class / working-renter tenant base. Strengths: cost of living A+, housing A+, health & safety A+; Watch: amenities F, commute F, employment F.
- El Dorado Springs R-II (town): math 25% / reading 34% proficiency, ranked #279 of 324 in MO (top 86%) — low school quality limits family demand, transient renter base, plan for 1-2y turnover.
- Zoned schools: El Dorado Springs Elem. (math 26% / reading 34%, grade F, #808 of 1,115 statewide, top 73%, 580 students, 100% FRL); El Dorado Springs Middle (math 28% / reading 31%, grade F, #291 of 391 statewide, top 76%, 244 students, 51% FRL); El Dorado Springs High (math 12% / reading 47%, grade F, #382 of 521 statewide, top 78%, 348 students, 40% FRL).
- Market conditions: 84 active listings in the ZIP; 1 comparable units currently listed for rent nearby; 4 units permitted in Cedar County in 2024 (0 in 5+ unit buildings).
Forward outlook
- In year one you build about $1k of equity ($86 loan paydown + $1k appreciation (10.0% local appreciation)).
- Cedar County population projected at -12% by 2050 — secular population decline; favor cash flow + early exit over multi-decade hold.
- At projected returns (10.0% appreciation + 3.0% rent growth), your $4k cash investment doubles in ~1 year — after that, you're playing with house money.
Negotiation context
- It's been on market 224 days — a 12% lower offer ($11k) is reasonable based on typical stale-listing flexibility.
- 2 sale attempts; this cycle's ask has dropped $12k (49%) from the opening price — seller is motivated, your offer sets the floor, not the list.
Risks & watch-outs
- Watch-outs: built in 1945 — expect roof / HVAC / electrical / plumbing capex.
- Climate carrying-cost: extreme-heat days projected 7→18/yr by 2055 (HVAC capex compounding) — expect insurance premiums to compound above CPI over the hold.
Questions for the listing agent
- It's been on market 224 days. Have you received any prior offers? Is the seller open to a 12% concession, seller financing, or rate buy-down credit?
- Built in 1945 — when were the roof, HVAC, electrical panel, plumbing, and water heater last replaced?
- Why hasn't it sold? Are there any deal-killer items the seller is aware of (foundation, flood, title, zoning, code violations)?
- Is there a deadline driving the sale (1031 exchange, divorce, estate, relocation)? That informs how much negotiation room exists.
- Schools are D-rated, which usually means shorter tenancies and higher turnover. Who's the typical renter profile here, and what's been the actual vacancy rate?
- What's the average days-on-market for RENTAL listings here right now (not sales)? A rising rental-DOM trend means longer vacancies and softer asking-rent achievability than the comps imply.
- What's the recent tenant-quality profile in this submarket — average credit score on applications, eviction rate, late-payment / NSF rate, and stable-employment percentage? A property-management company in the area should have these aggregated.
- How much new for-sale + rental construction is in the pipeline within 1–3 miles? Heavy new supply typically softens prices + rents 12–24 months out; constrained supply supports both.
Investment metrics
- 1% rule
- 11.60% ✓
- Cap rate
- 107.98%
- Cash-on-cash
- 363.15%
- DSCR
- 17.16
- GRM
- 0.7
CMA / ARV
- ARV (median comp)
- $79,083
- List price
- $12,500
- Delta
- -84.19%
- Verdict
- UNDERPRICED
- Comps
- 20 within 1.0 mi
Show comp detail 12 sales within ~0.75 mi
| Address | Dist | Beds/Ba | Sqft | Sold | Price | $/sf | Match |
|---|---|---|---|---|---|---|---|
| 901 S Jackson St | 0.18mi | 2/1.0 | 728 (-5%) | 7mo | $109,500 | $150 | 77 |
| 311 W Pine St | 0.34mi | 2/2.0 | 800 (+4%) | 6mo | $89,900 | $112 | 69 |
| 104 N Park St | 0.48mi | 1/1.0 (-1) | 748 (-3%) | 2mo | $29,500 | $39 | 66 |
| 802 S Jackson St | 0.13mi | 2/1.0 | 875 (+14%) | 8mo | $119,000 | $136 | 64 |
| 206 W Fields Blvd | 0.13mi | 2/1.0 | 875 (+14%) | 8mo | $124,900 | $143 | 64 |
| 120 W Pine St | 0.25mi | 2/1.0 | 840 (+9%) | 11mo | $119,000 | $142 | 63 |
| 109 W Pine St | 0.23mi | 2/1.0 | 850 (+11%) | 13mo | $39,900 | $47 | 61 |
| 408 N St James St | 0.62mi | 2/1.0 | 824 (+7%) | 1mo | $79,500 | $96 | 58 |
| 2450 SW 453 Private Rd | 0.44mi | 2/1.0 | 728 (-5%) | 18mo | $129,000 | $177 | 55 |
| 102 N Summer St | 0.62mi | 2/1.0 | 700 (-9%) | 14mo | $12,500 | $18 | 45 |
| 115 Winner Rd | 0.66mi | 2/1.0 | 817 (+6%) | 18mo | $76,000 | $93 | 44 |
| 1103 South Forest St | 0.62mi | 2/1.0 | 864 (+12%) | 17mo | $99,900 | $116 | 36 |
Match score weights: distance 35% · size 25% · config 20% · recency 20%. Top-matched comps best support the ARV.
Projected returns pro-forma
10.0% appreciation · 3.0% rent growth · sell at horizon
- IRR
- —
- Equity multiple
- 22.23×
- Total profit
- $74,290
- Equity at exit
- $11,261
- IRR
- —
- Equity multiple
- 48.36×
- Total profit
- $165,766
- Equity at exit
- $24,285
Cash invested: $3,500 (down + closing). Projections, not guarantees.
Landlord ↔ Tenant lean methodology
- Overall (STATE)
- 81 Strongly Landlord-Friendly
- State Missouri
- 81 Strongly Landlord-Friendly · R+10
- County
- — inherits STATE
- City
- — inherits STATE
ZIP-level market 64744
- Home prices YoY
- 5.2%
- Active inventory
- 84
- Price-to-rent
- 0.7×
Monthly cashflow live
- Estimated rent
- $1,450 medium interval (Pro) →
- Mortgage (P&I)
- −$66
- Tax from tax record
- −$16 /mo · $187/yr
- Insurance
- −$5
- HOA
- −$0
- Vacancy / Maint / Mgmt
- −$304
- Net cashflow
- $1,059
Break-even live
Sensitivity live
| Price | -10% $1,066 | -5% $1,063 | +0% $1,059 | +5% $1,056 | +10% $1,052 |
|---|---|---|---|---|---|
| Rent | -10% $945 | -5% $1,002 | +0% $1,059 | +5% $1,116 | +10% $1,174 |
| Rate | -1.0pp $1,065 | -0.5pp $1,062 | base $1,059 | +0.5pp $1,056 | +1.0pp $1,053 |
UW: 25.0% down · 7.5% · 30yr · 1.5% tax · 5.0% vac · 8.0% maint · 8.0% mgmt
Financing live
Cash to close
- Down payment
- $3,125
- Closing costs
- $375
- Reserves months
- —
- Total cash needed
- —
Loan-product check · same deal, 3 products live
Conventional
25% down · 7.5% · 30yr
- Down + closing
- —
- Monthly P&I
- —
- Monthly cashflow
- —
- DSCR
- —
- Eligible?
- —
Personal DTI + credit; lowest rate.
DSCR
20% down · 8.5% · 30yr
- Down + closing
- —
- Monthly P&I
- —
- Monthly cashflow
- —
- DSCR
- —
- Eligible?
- —
No personal income docs; deal must DSCR.
Hard money
10% down · 12.0% · 12mo
- Down + closing
- —
- Monthly P&I
- —
- Monthly cashflow
- —
- DSCR
- —
- Eligible?
- —
Short-term bridge; refi at stabilization.
Rent comps 1 comps
| Address | Beds | Baths | Sqft | Rent | $/sqft | DOM | Units | Dist |
|---|---|---|---|---|---|---|---|---|
| 410 S Ohio St El Dorado Springs, MO | 3.0 | 2.0 | 1020 | $1,450 | $1.42 | 45d | 1 | 0.46mi |
Listing history 20 events
-
2026-06-21statusdays on market $12,500 Pending 224 DOM
-
2026-06-18days on market $12,500 Active 222 DOM
-
2026-06-17days on market $12,500 Active 221 DOM
-
2026-06-16days on market $12,500 Active 220 DOM
-
2026-06-16price $12,500 Active 219 DOM
-
2026-06-15days on market $19,500 Active 219 DOM
-
2026-06-13days on market $19,500 Active 217 DOM
-
2026-06-12days on market $19,500 Active 216 DOM
-
2026-06-09days on market $19,500 Active 213 DOM
-
2026-06-08days on market $19,500 Active 212 DOM
-
2026-06-07days on market $19,500 Active 211 DOM
-
2026-06-07days on market $19,500 Active 210 DOM
-
2026-06-04days on market $19,500 Active 207 DOM
-
2026-06-02days on market $19,500 Active 206 DOM
-
2026-06-01days on market $19,500 Active 205 DOM
-
2026-05-31days on market $19,500 Active 204 DOM
-
2026-04-13price $19,500 472-char remark
Show marketing remark (484 chars)
Fixer Upper Bungalow for Sale in El Dorado Springs, MO. If you’re looking an investment property check out this property. Just listed in El Dorado Springs is a fixer-upper property ready for the savvy investor who isn’t afraid of doing some work. This modest home conveniently located in the center of town creating an appealing location to potential renters. Home is 768 sq ft featuring 2 bedrooms and one bathroom. Call today to inquire about this affordable investment.
-
2026-04-13price $19,500 484-char remark
Show marketing remark (484 chars)
Fixer Upper Bungalow for Sale in El Dorado Springs, MO. If you’re looking an investment property check out this property. Just listed in El Dorado Springs is a fixer-upper property ready for the savvy investor who isn’t afraid of doing some work. This modest home conveniently located in the center of town creating an appealing location to potential renters. Home is 768 sq ft featuring 2 bedrooms and one bathroom. Call today to inquire about this affordable investment.
-
2025-11-08$24,500 Active 472-char remark
Show marketing remark (484 chars)
Fixer Upper Bungalow for Sale in El Dorado Springs, MO. If you’re looking an investment property check out this property. Just listed in El Dorado Springs is a fixer-upper property ready for the savvy investor who isn’t afraid of doing some work. This modest home conveniently located in the center of town creating an appealing location to potential renters. Home is 768 sq ft featuring 2 bedrooms and one bathroom. Call today to inquire about this affordable investment.
-
2025-11-08$24,500 Active 484-char remark
Show marketing remark (484 chars)
Fixer Upper Bungalow for Sale in El Dorado Springs, MO. If you’re looking an investment property check out this property. Just listed in El Dorado Springs is a fixer-upper property ready for the savvy investor who isn’t afraid of doing some work. This modest home conveniently located in the center of town creating an appealing location to potential renters. Home is 768 sq ft featuring 2 bedrooms and one bathroom. Call today to inquire about this affordable investment.
ⓘ Source: listings_history table (triggers on properties + properties_extension) + one-shot
backfill from property_details.listing_events for pre-trigger history.
Tax reassessment forecast MO · Resets to sale price
- Current annual tax
- $187 · $16/mo
- Projected year-2 tax
- $187 · $16/mo
- Expected delta
- $0/yr ($0/mo · 0.0%)
ⓘ Screening estimate from a state-policy table — verify with the county assessor before closing.
Climate risk First Street
- Flood 1/10 Low FEMA zone X (unshaded) · 0% chance over 30 yrs
- Wildfire 4/10 Moderate
- Heat 5/10 Major 7 d/yr ≥108°F today · 18 d/yr by 30 yrs out
- Wind 2/10 Low 2% chance of damaging wind over 30 yrs
- Air quality 2/10 Low 0 unhealthy d/yr today · 1 by 30 yrs out
Nearby sold comps map
Loading sold comps map…
Walkable amenities ~0.75 mi
Loading nearby amenities…
Taxation est. · year 1
- Rental income
- $17,400
- − Mortgage interest
- −$700
- − Property taxes
- −$187
- − Insurance
- −$62
- − Repairs & maintenance
- −$1,392
- − Management
- −$1,392
- − Depreciation
- −$364
- Taxable income
- $13,303
- Est. tax owed @ 24.0%
- −$3,193
- After-tax cash flow
- $9,518/yr
For passive investors: Depreciation is non-cash, so a rental often shows a tax loss while cash-flowing — sheltering income. Rental losses are passive: they offset passive income freely, and up to $25,000/yr can offset ordinary (W-2) income if you actively participate and your MAGI is under $100k (phasing out to $0 by $150k); unused losses carry forward. On sale, claimed depreciation is recaptured at up to 25%, and gains may owe capital-gains tax (a 1031 exchange can defer both). Figures are a year-1 estimate at your 24.0% rate — not tax advice; consult a CPA.
Schools (NCES district)
- District
- El Dorado Springs R-II
- NCES district ID
- 2911310
- Math proficiency
- 25% ▼ -5.00%
- Reading proficiency
- 34% ▼ -5.00%
- Median HH income
- $31,880
- Composite
- 24.02/100
- National rank
- #7772
- State rank
- #279 of 324 in MO
Livability — El Dorado Springs
- Score
- 62/100
- State rank
- #370
- US rank
- #16324
Category grades
Schools grade is shown separately in the Schools card above.
Census & demographics
- Census place
- El Dorado Springs, MO
- Population (ZIP)
- 8,547
Population outlook (Cedar County) Hauer SSP2
- Today (2025)
- 13,424 people
- By 2030
- 13,080 · -2.6%
- By 2040
- 12,434 · -7.4%
- By 2050
- 11,841 · -11.8%
- By 2075
- 10,171 · -24.2%
- By 2100
- 7,744 · -42.3%
Race, ethnicity, and origin ACS 2023
- Neighborhood character
- Predominantly White (95%)
- Race & ethnicity
- White 95% Two or more races 4%
- Common ancestry
- Italian 6% Iranian 3% Romanian 3%
- Foreign-born
- 1% · Canada
- Languages at home
- 94% English-only · German/W. Germanic 5% Spanish 1%
Political lean MEDSL · Cedar
- 2024 margin
- Solid R (+69.6) · D 14.8% · R 84.4%
- 2008→2024 swing
- -36.0pp toward R · 2008: -33.6pp · 2024: -69.6pp
- All cycles
- 2024: R+69.6 2020: R+65.9 2016: R+63.9 2012: R+47.0 2008: R+33.6
Not yet ingested
- Civics
- —
Market trends
- HPI YoY
- ▲ 11.88%
- Current HPI
- 242.0421
- Rent YoY
- —
- Metro
- —
- State GDP YoY
- ▲ 1.84%
- F500 in state
- 20
Industry mix (Fortune 500 HQ in MO)
| Industry | F500 HQs | Revenue |
|---|---|---|
| Healthcare | 1 | $163B |
|
||
| Insurance | 1 | $21B |
|
||
| Industrial Technology | 1 | $17B |
|
||
| Retail | 1 | $16B |
|
||
| Industrial Distribution | 1 | $10B |
|
||
| Utilities | 1 | $9B |
|
||
Price history
-20.4% since first listed4 events — show timeline
- 2026-04-13 Price Changed $19,500 SOMO
- 2026-04-13 Price Changed $19,500 Heartland MLS as Distributed by MLS Grid
- 2025-11-08 Listed $24,500 Heartland MLS as Distributed by MLS Grid
- 2025-11-08 Listed $24,500 SOMO
Property tax history
+3.2%/yrLatest (2025): $187 · +8.3% YoY. Source: county tax records.
Cash-flow waterfall
monthlySold comps — $/sqft
last 12 mo · ≤1 miLoading sold comps…