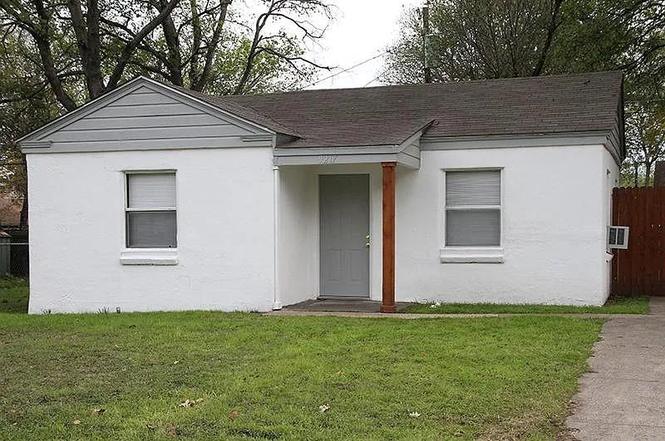
9217 N Dodson Dr · White Settlement, TX
Flood risk 1/10 · Minimal
- FEMA flood zone
- X (unshaded)
- Chance of flooding over 30 yrs
- 0.0%
- Est. flood insurance / yr
- $507 – $1,088
Fire risk 4/10 · Minor
- Est. fire insurance / yr
- $1,222 – $2,270
Heat risk 7/10 · Major
- Hot days now (above 108°F)
- 7 days/yr
- Hot days in 30 yrs
- 22 days/yr
Wind risk 4/10 · Minor
- Chance of severe wind over 30 yrs
- 24.0%
Air-quality risk 3/10 · Minor
- Unhealthy air days now
- 3 days/yr
- Unhealthy air days in 30 yrs
- 4 days/yr
Risk factors via First Street. Map © Google.
Why this score? — see what drove the D+ grade
The composite is a weighted blend of 9 inputs, each scored 0–100. Each bar is that input's sub-score; the figure is the points it added to the 100-point composite (weight × sub-score).
- ARV discount +15.0/15.0
- Cash flow +12.8/30.0
- 1% rule +3.9/10.0
- DSCR +3.8/10.0
- Livability +3.7/5.0
- Schools +3.5/10.0
- Rent growth +2.5/5.0
- Condition / age +2.5/5.0
- Appreciation +0.0/10.0
$130,000
🖨 Deal sheet (PDF) 📄 Offer letter ✓ Due diligence
Listing remarks
Investor Potential or DIY Starter Home! Incredible opportunity to own an affordable slice of White Settlement. Priced to reflect its need for cosmetic updates and repairs, this property is the perfect blank canvas. Whether you are an investor looking for your next rental or flip, or a buyer looking to build sweat equity and stop paying rent, the potential here is unmatched. Enjoy a great location with easy access to major highways and local employers. Property being sold AS-IS. Bring your vision and your offers!
Key facts
- 6,186 sq ft lot
- Built 1948
- Listed 3 days
Property features AI
Finance
- Other: Parcel/Tax ID information on file; Subdivision: Farmers Add
- Financial info: No second mortgage indicated; Listing listed as For Sale
- HOA & community: No homeowners association
Exterior
- Parking: Driveway with gravel surface; No covered or carport spaces
- Utilities: City water; City sewer; Not in a municipal utility district
- Home design: Single-family residence; One story; Residential property
- Construction: Built in 1948; Stucco construction; Shingle roof
- Exterior features: Chain link fencing; Lot dimensions approximately 72 x 94
Interior
- Kitchen: Kitchen on the main level; No appliances included
- Bedrooms: 2 bedrooms (both on the main level)
- Flooring: Carpet flooring
- Bathrooms: 1 full bathroom
- Interior features: One living area; Total of 4 rooms; Other interior features
- Laundry & utility: No laundry appliances listed
Neighborhood map
What this means for you Summary
Snapshot
- This is a 2-bed/1.0-bath single-family listed at $130k.
Deal economics
- At list price, monthly cash flow is $-11 ($-130/yr) — negative.
- To cash-flow at today's rent, offer at most $128k (1.5% below list).
- To meet the 1% rule (rent ≥ 1% of price), the offer needs to be $116k (10.6% below list).
- Recommended offer: $116k (10.6% below list) — sets the bar for 1% rule.
- Cap rate 6.2% vs local median 4.6% in White Settlement — top-decile yield for the area; either an underpriced asset or a hidden risk that comps aren't pricing in. Stress-test before assuming the spread holds.
Location & tenants
- Location reads 74/100 on livability (#188 in TX, #4,855 nationally) — a middle-class / working-renter tenant base. Strengths: cost of living A+, housing A+, health & safety A+; Watch: amenities D+, employment D+, commute F.
- White Settlement ISD (rural): math 35% / reading 44% proficiency, ranked #396 of 826 in TX (top 48%) — families likely to look elsewhere, expect single-tenant / working-renter base with shorter leases.
- Zoned schools: West El (math 37% / reading 32%, grade F, #1,995 of 4,322 statewide, top 50%, 552 students, 78% FRL); Brewer Middle (math 33% / reading 48%, grade F, #637 of 1,662 statewide, top 39%, 1,047 students, 63% FRL); Brewer H S (math 25% / reading 45%, grade F, #954 of 1,632 statewide, top 59%, 2,183 students, 56% FRL) — zoned schools average 66% FRL vs 49% district-wide (17 pts higher); higher-poverty schools than district average — tighter screening recommended.
- Market conditions: Rents soft (-0.2%/yr); 553 active listings in the ZIP; 16 comparable units currently listed for rent nearby; rentals at typical pace (median 24d on market — plan ~3-4 weeks tenant-placement turnaround); solid renter incomes; 18,938 units permitted in Tarrant County in 2024 (8,336 in 5+ unit buildings).
- This rent is only 17% of the median local income ($80k/yr) — well below the 30% rent-burden line; pricing power to push rent on renewal without tenant pushback.
Forward outlook
- Local home prices are declining (-3.0%/yr); year-one equity from $899 of loan paydown is wiped out by about $4k of value loss. Plan a longer hold.
- Tarrant County population projected at +41% by 2050 — long-run rental-demand tailwind backs the buy-and-hold thesis.
Negotiation context
- Only 3 days on market — expect competitive offers; lowballing is unlikely to land.
Risks & watch-outs
- Watch-outs: built in 1948 — expect roof / HVAC / electrical / plumbing capex.
- Climate carrying-cost: extreme-heat days projected 7→22/yr by 2055 (HVAC capex compounding) — expect insurance premiums to compound above CPI over the hold.
Questions for the listing agent
- What do current leases actually rent for vs. the listed asking? Can we see a recent rent roll and the last 12 months of T-12 income?
- Built in 1948 — when were the roof, HVAC, electrical panel, plumbing, and water heater last replaced?
- Is there a deadline driving the sale (1031 exchange, divorce, estate, relocation)? That informs how much negotiation room exists.
- Schools are D-rated, which usually means shorter tenancies and higher turnover. Who's the typical renter profile here, and what's been the actual vacancy rate?
- The area grade is low — what's the realistic commute time and amenity access for the typical tenant pool here? Any planned neighborhood developments (good or bad) we should know about?
- What's the average days-on-market for RENTAL listings here right now (not sales)? A rising rental-DOM trend means longer vacancies and softer asking-rent achievability than the comps imply.
- What's the recent tenant-quality profile in this submarket — average credit score on applications, eviction rate, late-payment / NSF rate, and stable-employment percentage? A property-management company in the area should have these aggregated.
- How much new for-sale + rental construction is in the pipeline within 1–3 miles? Heavy new supply typically softens prices + rents 12–24 months out; constrained supply supports both.
Investment metrics
- 1% rule
- 0.89% ✗
- Cap rate
- 6.19%
- Cash-on-cash
- -0.36%
- DSCR
- 0.98
- GRM
- 9.3
CMA / ARV
- ARV (on-the-fly)
- $159,900
- Comps found
- 9
Show comp detail 9 sales within ~0.75 mi
| Address | Dist | Beds/Ba | Sqft | Sold | Price | $/sf | Match |
|---|---|---|---|---|---|---|---|
| 641 S Redford Ln | 0.15mi | 2/1.0 | 650 (0%) | 5mo | $134,900 | $208 | 89 |
| 559 Joy Dr | 0.21mi | 2/1.0 | 650 (0%) | 12mo | $159,900 | $246 | 81 |
| 9213 S Dodson Dr | 0.05mi | 2/1.0 | 648 (-0%) | 20mo | $169,900 | $262 | 81 |
| 538 S Redford Ln | 0.11mi | 2/1.0 | 675 (+4%) | 12mo | $159,900 | $237 | 78 |
| 412 Sands Ct | 0.09mi | 2/1.0 | 695 (+7%) | 8mo | $173,500 | $250 | 77 |
| 9112 Rowland Dr | 0.18mi | 2/1.0 | 664 (+2%) | 14mo | $179,900 | $271 | 77 |
| 9132 N Dodson Dr | 0.07mi | 2/1.0 | 624 (-4%) | 17mo | $139,800 | $224 | 76 |
| 555 Joy Dr | 0.22mi | 2/1.0 | 624 (-4%) | 13mo | $169,900 | $272 | 72 |
| 8500 Wyatt | 0.68mi | 2/1.0 | 736 (+13%) | 3mo | $174,900 | $238 | 44 |
Match score weights: distance 35% · size 25% · config 20% · recency 20%. Top-matched comps best support the ARV.
Projected returns pro-forma
-3.0% appreciation · 0.0% rent growth · sell at horizon
- IRR
- -20.4%
- Equity multiple
- 0.31×
- Total profit
- $-25,123
- Equity at exit
- $19,383
- IRR
- -22.5%
- Equity multiple
- 0.02×
- Total profit
- $-35,779
- Equity at exit
- $11,240
Cash invested: $36,400 (down + closing). Projections, not guarantees.
Landlord ↔ Tenant lean methodology
- Overall (STATE)
- 87 Strongly Landlord-Friendly
- State Texas
- 87 Strongly Landlord-Friendly · R+5
- County
- — inherits STATE
- City
- — inherits STATE
ZIP-level market 76108
- Home prices YoY
- -32.5%
- Rents YoY
- -0.2%
- Active inventory
- 553
- Price-to-rent
- 9.3×
Monthly cashflow live
- Estimated rent
- $1,162 high interval (Pro) →
- Mortgage (P&I)
- −$682
- Tax from tax record
- −$193 /mo · $2,318/yr
- Insurance
- −$54
- HOA
- −$0
- Vacancy / Maint / Mgmt
- −$244
- Net cashflow
- $-11
Break-even live
Sensitivity live
| Price | -10% $63 | -5% $26 | +0% $-11 | +5% $-48 | +10% $-84 |
|---|---|---|---|---|---|
| Rent | -10% $-103 | -5% $-57 | +0% $-11 | +5% $35 | +10% $81 |
| Rate | -1.0pp $55 | -0.5pp $22 | base $-11 | +0.5pp $-44 | +1.0pp $-79 |
UW: 25.0% down · 7.5% · 30yr · 1.5% tax · 5.0% vac · 8.0% maint · 8.0% mgmt
Financing live
Cash to close
- Down payment
- $32,500
- Closing costs
- $3,900
- Reserves months
- —
- Total cash needed
- —
Loan-product check · same deal, 3 products live
Conventional
25% down · 7.5% · 30yr
- Down + closing
- —
- Monthly P&I
- —
- Monthly cashflow
- —
- DSCR
- —
- Eligible?
- —
Personal DTI + credit; lowest rate.
DSCR
20% down · 8.5% · 30yr
- Down + closing
- —
- Monthly P&I
- —
- Monthly cashflow
- —
- DSCR
- —
- Eligible?
- —
No personal income docs; deal must DSCR.
Hard money
10% down · 12.0% · 12mo
- Down + closing
- —
- Monthly P&I
- —
- Monthly cashflow
- —
- DSCR
- —
- Eligible?
- —
Short-term bridge; refi at stabilization.
Rent comps 16 comps
| Address | Beds | Baths | Sqft | Rent | $/sqft | DOM | Units | Dist |
|---|---|---|---|---|---|---|---|---|
| 9020 Moran St Fort Worth, TX | 2.0 | 1.0 | 650 | $1,225 | $1.88 | 45d | 1 | 0.15mi |
| 9211 Dale Lane Ct Fort Worth, TX | 1.0–2.0 | 1.0–2.0 | 719 | $975 | $1.36 | 45d | 1 | 0.25mi |
| 704 Dale Ln Unit 1121 White Settlement, TX | 1.0 | 1.0 | 650 | $900 | $1.38 | 1d | 1 | 0.32mi |
| 704 Dale Ln Unit 725 White Settlement, TX | 1.0 | 1.0 | 650 | $859 | $1.32 | 1d | 1 | 0.32mi |
| 704 Dale Ln Unit 778 White Settlement, TX | 1.0 | 1.0 | 650 | $900 | $1.38 | 45d | 1 | 0.32mi |
| 704 Dale Ln Unit 725 White Settlement, TX | 1.0 | 1.0 | 650 | $905 | $1.39 | 14d | 1 | 0.32mi |
| 704 Dale Ln Fort Worth, TX | 1.0 | 1.0 | 650 | $859 | $1.32 | 14d | 1 | 0.34mi |
| 9021 White Settlement Rd Unit D White Settlement, TX | 1.0 | 1.0 | 440 | $950 | $2.16 | 24d | 1 | 0.36mi |
| 9021 White Settlement Rd Unit C White Settlement, TX | 1.0 | 1.0 | 462 | $995 | $2.15 | 24d | 1 | 0.36mi |
| 300 Meadow Park Dr White Settlement, TX | 2.0 | 1.0 | 616 | $1,100 | $1.79 | 20d | 1 | 0.93mi |
| 1808 S Las Vegas Trl Fort Worth, TX | 1.0 | 1.0 | 731 | $965 | $1.32 | 45d | 1 | 0.98mi |
| 1823 S Las Vegas Trl Unit 1 White Settlement, TX | 1.0 | 1.0 | 731 | $965 | $1.32 | 45d | 1 | 0.99mi |
| 753 Academy Blvd Fort Worth, TX | 1.0–3.0 | 1.0–2.0 | 978 | $1,654 | $1.69 | 1d | 35 | 1.06mi |
| 400 Ralph St Fort Worth, TX | 1.0 | 1.0 | 625 | $1,225 | $1.96 | 45d | 1 | 1.37mi |
| 9200 N Normandale St Fort Worth, TX | 1.0–2.0 | 1.0–2.0 | 667 | $1,174 | $1.76 | 7d | 21 | 1.39mi |
| 9001 N Normandale St Fort Worth, TX | 1.0–2.0 | 1.0–2.0 | 811 | $1,169 | $1.44 | 0d | 22 | 1.47mi |
Listing history 4 events
-
2026-06-21statusdays on market $130,000 Pending 3 DOM
-
2026-06-18days on market $130,000 Active 2 DOM
-
2026-06-17remarks 517-char remark
-
2026-06-17$130,000 Active 1 DOM
ⓘ Source: listings_history table (triggers on properties + properties_extension) + one-shot
backfill from property_details.listing_events for pre-trigger history.
Tax reassessment forecast TX · Resets to sale price
- Current annual tax
- $2,318 · $193/mo
- Projected year-2 tax
- $2,379 · $198/mo
- Expected delta
- +$61/yr (+$5/mo · 2.6%)
ⓘ Screening estimate from a state-policy table — verify with the county assessor before closing.
Climate risk First Street
- Flood 1/10 Low FEMA zone X (unshaded) · 0% chance over 30 yrs
- Wildfire 4/10 Moderate
- Heat 7/10 Severe 7 d/yr ≥108°F today · 22 d/yr by 30 yrs out
- Wind 4/10 Moderate 24% chance of damaging wind over 30 yrs
- Air quality 3/10 Moderate 3 unhealthy d/yr today · 4 by 30 yrs out
Nearby sold comps map
Loading sold comps map…
Walkable amenities ~0.75 mi
Loading nearby amenities…
Taxation est. · year 1
- Rental income
- $13,949
- − Mortgage interest
- −$7,282
- − Property taxes
- −$2,318
- − Insurance
- −$650
- − Repairs & maintenance
- −$1,116
- − Management
- −$1,116
- − Depreciation
- −$3,782
- Taxable loss
- −$2,315
- Est. tax savings @ 24.0%
- +$556
- After-tax cash flow
- $426/yr
For passive investors: Depreciation is non-cash, so a rental often shows a tax loss while cash-flowing — sheltering income. Rental losses are passive: they offset passive income freely, and up to $25,000/yr can offset ordinary (W-2) income if you actively participate and your MAGI is under $100k (phasing out to $0 by $150k); unused losses carry forward. On sale, claimed depreciation is recaptured at up to 25%, and gains may owe capital-gains tax (a 1031 exchange can defer both). Figures are a year-1 estimate at your 24.0% rate — not tax advice; consult a CPA.
Schools (NCES district)
- District
- White Settlement ISD
- NCES district ID
- 4845540
- Math proficiency
- 35% ▼ -10.00%
- Reading proficiency
- 44% ▼ -4.00%
- Median HH income
- $56,055
- Composite
- 34.63/100
- National rank
- #5151
- State rank
- #396 of 826 in TX
Livability — White Settlement
- Score
- 74/100
- State rank
- #188
- US rank
- #4855
Category grades
Schools grade is shown separately in the Schools card above.
Census & demographics
- Census place
- White Settlement, TX
- County
- Tarrant County · 2,033,669 people
- Metro
- Dallas-Fort Worth-Arlington, TX
- Population (ZIP)
- 45,537
- Household income
- $80,412
- Rent vs Own
- Severe rent burden
- 774.0
Population outlook (Tarrant County) Hauer SSP2
- Today (2025)
- 2,380,417 people
- By 2030
- 2,578,900 · +8.3%
- By 2040
- 2,974,995 · +25.0%
- By 2050
- 3,350,489 · +40.8%
- By 2075
- 4,216,909 · +77.2%
- By 2100
- 4,741,527 · +99.2%
Race, ethnicity, and origin ACS 2023
- Neighborhood character
- Diverse neighborhood (Simpson 0.62)
- Race & ethnicity
- White 52% Hispanic / Latino 32% Two or more races 17% Black 8% Asian 3% Native American 1%
- Hispanic origin (detail)
- Mexican 26% Puerto Rican 1%
- Common ancestry
- Slovak 2% Lithuanian 1% Romanian 1%
- Foreign-born
- 11% · Canada, Vietnam
- Languages at home
- 76% English-only · Spanish 21% Vietnamese 1% Tagalog/Filipino 1%
Political lean MEDSL · Tarrant
- 2024 margin
- Lean R (+5.1) · D 46.7% · R 51.9% · Other 1.4%
- 2008→2024 swing
- +6.6pp toward D · 2008: -11.7pp · 2024: -5.1pp
- All cycles
- 2024: R+5.1 2020: D+0.2 2016: R+8.7 2012: R+15.7 2008: R+11.7
Not yet ingested
- Civics
- —
Market trends
- HPI YoY
- ▼ -141.39%
- Current HPI
- 294.2459
- Rent YoY
- ▼ -0.18%
- Metro
- Dallas-Fort Worth-Arlington, TX
- State GDP YoY
- ▲ 3.95%
- F500 in state
- 110
Industry mix (Fortune 500 HQ in TX)
| Industry | F500 HQs | Revenue |
|---|---|---|
| Energy | 16 | $1,198B |
|
||
| Technology | 5 | $198B |
|
||
| Engineering / Construction | 4 | $72B |
|
||
| Energy Services | 3 | $60B |
|
||
| Utilities | 3 | $41B |
|
||
| Healthcare | 2 | $330B |
|
||
Price history
1 event — show timeline
- 2026-06-16 Listed $130,000 NTREIS
Property tax history
+7.1%/yrLatest (2025): $2,318 · -13.8% YoY. Source: county tax records.
Cash-flow waterfall
monthlySold comps — $/sqft
last 12 mo · ≤1 miLoading sold comps…