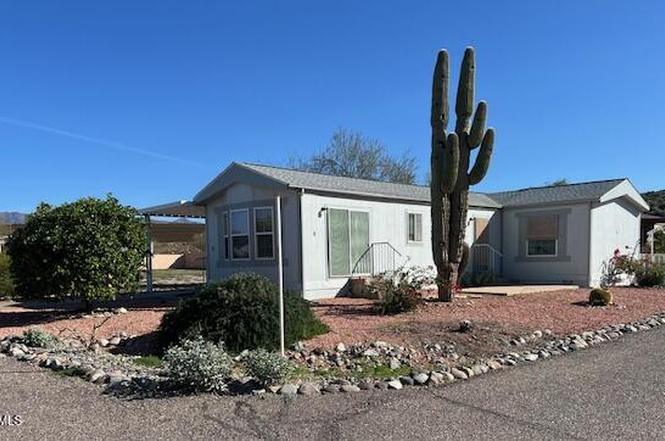
19500 E Gregory St #8 · Black Canyon City, AZ
Flood risk 4/10 · Minor
- FEMA flood zone
- AE
- Chance of flooding over 30 yrs
- 0.23%
- Est. flood insurance / yr
- $1,737 – $8,500
Fire risk 7/10 · Major
- Est. fire insurance / yr
- $610 – $1,132
Heat risk 8/10 · Major
- Hot days now (above 109°F)
- 7 days/yr
- Hot days in 30 yrs
- 19 days/yr
Wind risk 1/10 · Minimal
- Chance of severe wind over 30 yrs
- —
Air-quality risk 2/10 · Minimal
- Unhealthy air days now
- 1 days/yr
- Unhealthy air days in 30 yrs
- 1 days/yr
Risk factors via First Street. Map © Google.
Why this score? — see what drove the D+ grade
The composite is a weighted blend of 9 inputs, each scored 0–100. Each bar is that input's sub-score; the figure is the points it added to the 100-point composite (weight × sub-score).
- Cash flow +18.3/30.0
- Appreciation +10.0/10.0
- DSCR +5.8/10.0
- 1% rule +4.9/10.0
- Livability +2.9/5.0
- Schools +2.8/10.0
- Rent growth +2.5/5.0
- Condition / age +2.5/5.0
- ARV discount +0.0/15.0
$135,000
🖨 Deal sheet (PDF) 📄 Offer letter ✓ Due diligence
Listing remarks
Beautiful home located in a desirable 55+ resort style gated community in Black Canyon City . This home sits on a nice size corner lot with Mountain View's from all sides. This home features two bedrooms/2 bathrooms plus a den area off kitchen. Vaulted ceilings makes this home very spacious. Covered carport and shed for storage. Two mature grapefruit trees, and one lemon tree produce plenty of fruit. Beautifully maintained park with clubhouse and pool/spa which is included in monthly park lease fee which also includes water, sewer, and trash.
Key facts
- Shed for storage
- Covered carport
- Den area
Tags
Property features AI
Finance
- Other: Lot size reported by owner
- HOA & community: Land lease (monthly); Land lease: $525 monthly; Association covers sewer, water, trash, and grounds maintenance; Gated community with pool and community spa
Exterior
- Parking: 2 covered parking spaces; 2 carport spaces
- Security: Gated community
- Utilities: Private water company; Septic (in & connected)
- Home design: Manufactured / mobile home; Leasehold ownership
- Construction: Wood frame construction; Painted exterior; Composition roof; Building area per owner
- Exterior features: Corner lot; Natural desert landscaping front and back; Gravel/stone front; Automatic timer irrigation in back; Storage shed(s); Private maintained road; Mountain views; Community pool and spa (gated community)
Interior
- Kitchen: Refrigerator; Dishwasher; Laminate countertops
- Bedrooms: 3 possible bedrooms
- Flooring: Carpet; Laminate
- Bathrooms: 2 full bathrooms
- Heating & cooling: Heat pump heating; Central air; Ceiling fans
- Interior features: High-speed internet available; Breakfast bar; Furnished (see remarks); Full bath in master bedroom; Laminate counters; Solar screens; Storage
- Laundry & utility: Laundry inside
Neighborhood map
What this means for you Summary
Snapshot
- This is a 2-bed/2.0-bath manufactured listed at $135k.
Deal economics
- At list price, monthly cash flow is $-303 ($-4k/yr) — negative.
- To cash-flow at today's rent, offer at most $91k (32.4% below list).
- To meet the 1% rule (rent ≥ 1% of price), the offer needs to be $134k (0.9% below list).
- Recommended offer: $91k (32.4% below list) — sets the bar for cash-flow.
- Cap rate 7.4% vs local median 5.0% in Black Canyon City — top-decile yield for the area; either an underpriced asset or a hidden risk that comps aren't pricing in. Stress-test before assuming the spread holds.
Location & tenants
- Location reads 58/100 on livability (#213 in AZ) — a working-class tenant base; expect higher turnover. Strengths: cost of living A+, housing A+, crime A; Watch: amenities F, commute F, employment F.
- Canon Elementary District (4484) (rural): math 25% / reading 35% proficiency, ranked #294 of 501 in AZ (top 59%) — families likely to look elsewhere, expect single-tenant / working-renter base with shorter leases; 65% free/reduced lunch — lower-income household profile, screen leases tightly.
- Zoned schools: Canon School (math 17% / reading 17%, grade F, #814 of 1,109 statewide, top 76%, 131 students, 93% FRL) — zoned schools average 93% FRL vs 65% district-wide (28 pts higher); higher-poverty schools than district average — tighter screening recommended.
- Zoned-school proficiency averages 17% at this address vs 30% district-wide (-13 pts) — the specific schools serving this property underperform the Canon Elementary District (4484) average; the district grade overstates school quality for this exact location.
- Market conditions: 46 active listings in the ZIP; 2,062 units permitted in Yavapai County in 2024 (98 in 5+ unit buildings).
Forward outlook
- In year one you build about $14k of equity ($933 loan paydown + $14k appreciation (10.0% local appreciation)).
- Yavapai County population projected at +10% by 2050 — modest demand growth; plan on rents tracking national, not racing it.
- By year 3, paydown + projected appreciation supports a ~$37k cash-out refi (75% LTV) — recoverable capital for the next deal without selling this one.
Negotiation context
- Only 5 days on market — expect competitive offers; lowballing is unlikely to land.
- 2 sale attempts with the ask held roughly flat each time — persistent listings suggest the price (not the market) is what's stuck; bring a comps-based counter.
Risks & watch-outs
- Watch-outs: flood insurance adds $427/mo.
- Climate carrying-cost: in FEMA flood zone AE (mandatory federal flood insurance); major wildfire risk; extreme-heat days projected 7→19/yr by 2055 (HVAC capex compounding) — expect insurance premiums to compound above CPI over the hold.
Questions for the listing agent
- What do current leases actually rent for vs. the listed asking? Can we see a recent rent roll and the last 12 months of T-12 income?
- What's the actual annual flood-insurance premium (NFIP or private), and is the property in a SFHA with mandatory coverage?
- Is there a deadline driving the sale (1031 exchange, divorce, estate, relocation)? That informs how much negotiation room exists.
- Schools are F-rated, which usually means shorter tenancies and higher turnover. Who's the typical renter profile here, and what's been the actual vacancy rate?
- The area grade is low — what's the realistic commute time and amenity access for the typical tenant pool here? Any planned neighborhood developments (good or bad) we should know about?
- What's the average days-on-market for RENTAL listings here right now (not sales)? A rising rental-DOM trend means longer vacancies and softer asking-rent achievability than the comps imply.
- What's the recent tenant-quality profile in this submarket — average credit score on applications, eviction rate, late-payment / NSF rate, and stable-employment percentage? A property-management company in the area should have these aggregated.
- How much new for-sale + rental construction is in the pipeline within 1–3 miles? Heavy new supply typically softens prices + rents 12–24 months out; constrained supply supports both.
Investment metrics
- 1% rule
- 0.99% ✗
- Cap rate
- 7.39%
- Cash-on-cash
- 3.94%
- DSCR
- 1.18
- GRM
- 8.4
CMA / ARV
- ARV (on-the-fly)
- $108,160
- Comps found
- 3
Show comp detail 3 sales within ~0.75 mi
| Address | Dist | Beds/Ba | Sqft | Sold | Price | $/sf | Match |
|---|---|---|---|---|---|---|---|
| 19940 E Palo Verde Ln | 0.51mi | 2/1.0 | 840 (+1%) | 1mo | $158,000 | $188 | 70 |
| 19500 E Gregory St #34 | 0.00mi | 3/2.0 (+1) | 924 (+11%) | 14mo | $120,000 | $130 | 65 |
| 34483 S Bertha St | 0.67mi | 2/1.0 | 721 (-13%) | 13mo | $85,000 | $118 | 32 |
Match score weights: distance 35% · size 25% · config 20% · recency 20%. Top-matched comps best support the ARV.
Projected returns pro-forma
10.0% appreciation · 3.0% rent growth · sell at horizon
- IRR
- 17.6%
- Equity multiple
- 2.44×
- Total profit
- $54,536
- Equity at exit
- $121,619
- IRR
- 16.6%
- Equity multiple
- 5.66×
- Total profit
- $176,315
- Equity at exit
- $262,275
Cash invested: $37,800 (down + closing). Projections, not guarantees.
Landlord ↔ Tenant lean methodology
- Overall (STATE)
- 87 Strongly Landlord-Friendly
- State Arizona
- 87 Strongly Landlord-Friendly · R+3
- County
- — inherits STATE
- City
- — inherits STATE
ZIP-level market 85324
- Home prices YoY
- 7.5%
- Active inventory
- 46
- Price-to-rent
- 8.4×
Monthly cashflow live
- Estimated rent
- $1,338 medium interval (Pro) →
- Mortgage (P&I)
- −$708
- Tax est. 1.5%
- −$169 /mo · $2,025/yr
- Insurance
- −$56
- Flood insurance flood zone
- −$427 /mo · $5,118/yr
- HOA
- −$0
- Lot rent leased land?
- −$0
- Vacancy / Maint / Mgmt
- −$281
- Net cashflow
- $-303
Break-even live
Sensitivity live
| Price | -10% $-209 | -5% $-256 | +0% $-303 | +5% $-349 | +10% $-396 |
|---|---|---|---|---|---|
| Rent | -10% $-408 | -5% $-355 | +0% $-303 | +5% $-250 | +10% $-197 |
| Rate | -1.0pp $-235 | -0.5pp $-268 | base $-303 | +0.5pp $-338 | +1.0pp $-373 |
UW: 25.0% down · 7.5% · 30yr · 1.5% tax · 5.0% vac · 8.0% maint · 8.0% mgmt
Financing live
Cash to close
- Down payment
- $33,750
- Closing costs
- $4,050
- Reserves months
- —
- Total cash needed
- —
Loan-product check · same deal, 3 products live
Conventional
25% down · 7.5% · 30yr
- Down + closing
- —
- Monthly P&I
- —
- Monthly cashflow
- —
- DSCR
- —
- Eligible?
- —
Personal DTI + credit; lowest rate.
DSCR
20% down · 8.5% · 30yr
- Down + closing
- —
- Monthly P&I
- —
- Monthly cashflow
- —
- DSCR
- —
- Eligible?
- —
No personal income docs; deal must DSCR.
Hard money
10% down · 12.0% · 12mo
- Down + closing
- —
- Monthly P&I
- —
- Monthly cashflow
- —
- DSCR
- —
- Eligible?
- —
Short-term bridge; refi at stabilization.
Listing history 4 events
-
2026-06-22days on market $135,000 Active 5 DOM
-
2026-06-19days on market $135,000 Active 2 DOM
-
2026-06-17remarks 549-char remark
-
2026-06-17$135,000 Active 1 DOM
ⓘ Source: listings_history table (triggers on properties + properties_extension) + one-shot
backfill from property_details.listing_events for pre-trigger history.
Climate risk First Street
- Flood 4/10 Moderate FEMA zone AE · 23% chance over 30 yrs
- Wildfire 7/10 Severe
- Heat 8/10 Severe 7 d/yr ≥109°F today · 19 d/yr by 30 yrs out
- Wind 1/10 Low
- Air quality 2/10 Low 1 unhealthy d/yr today · 1 by 30 yrs out
Nearby sold comps map
Loading sold comps map…
Walkable amenities ~0.75 mi
Loading nearby amenities…
Taxation est. · year 1
- Rental income
- $16,055
- − Mortgage interest
- −$7,562
- − Property taxes
- −$2,025
- − Insurance
- −$5,794
- − Repairs & maintenance
- −$1,284
- − Management
- −$1,284
- − Depreciation
- −$3,927
- Taxable loss
- −$5,822
- Est. tax savings @ 24.0%
- +$1,397
- After-tax cash flow
- $-2,234/yr
For passive investors: Depreciation is non-cash, so a rental often shows a tax loss while cash-flowing — sheltering income. Rental losses are passive: they offset passive income freely, and up to $25,000/yr can offset ordinary (W-2) income if you actively participate and your MAGI is under $100k (phasing out to $0 by $150k); unused losses carry forward. On sale, claimed depreciation is recaptured at up to 25%, and gains may owe capital-gains tax (a 1031 exchange can defer both). Figures are a year-1 estimate at your 24.0% rate — not tax advice; consult a CPA.
Schools (NCES district)
- District
- Canon Elementary District (4484)
- NCES district ID
- 0401650
- Math proficiency
- 25% ▲ 5.00%
- Reading proficiency
- 35% ▬ 0.00%
- Median HH income
- $37,755
- Composite
- 27.85/100
- National rank
- #12286
- State rank
- #294 of 501 in AZ
Livability — Black Canyon City
- Score
- 58/100
- State rank
- #213
- US rank
- #21226
Category grades
Schools grade is shown separately in the Schools card above.
Census & demographics
- Census place
- Black Canyon City, AZ
- Population (ZIP)
- 2,297
Population outlook (Yavapai County) Hauer SSP2
- Today (2025)
- 241,389 people
- By 2030
- 249,523 · +3.4%
- By 2040
- 259,966 · +7.7%
- By 2050
- 264,736 · +9.7%
- By 2075
- 269,334 · +11.6%
- By 2100
- 256,505 · +6.3%
Race, ethnicity, and origin ACS 2023
- Neighborhood character
- Predominantly White (91%)
- Race & ethnicity
- White 91% Two or more races 7% Hispanic / Latino 3%
- Common ancestry
- Iranian 5% Serbian 3% Lithuanian 2%
- Foreign-born
- 1% · Canada
Political lean MEDSL · Yavapai
- 2024 margin
- Solid R (+33.9) · D 32.6% · R 66.5%
- 2008→2024 swing
- -9.5pp toward R · 2008: -24.4pp · 2024: -33.9pp
- All cycles
- 2024: R+33.9 2020: R+29.3 2016: R+31.4 2012: R+30.7 2008: R+24.4
Not yet ingested
- Civics
- —
Market trends
- HPI YoY
- ▲ 29.16%
- Current HPI
- 417.6032
- Rent YoY
- —
- Metro
- —
- State GDP YoY
- ▲ 4.54%
- F500 in state
- 20
Industry mix (Fortune 500 HQ in AZ)
| Industry | F500 HQs | Revenue |
|---|---|---|
| Technology | 2 | $13B |
|
||
| Mining / Metals | 1 | $23B |
|
||
| Environmental Services | 1 | $16B |
|
||
| Metals / Steel | 1 | $14B |
|
||
| Technology Distribution | 1 | $9B |
|
||
| Homebuilding | 1 | $8B |
|
||
Price history
+3.8% since first listed4 events — show timeline
- 2026-06-16 Listed $135,000 ARMLS
- 2026-05-02 Listing Removed — ARMLS
- 2026-02-01 Listed $130,000 ARMLS
- 2023-05-29 Rental Removed — ARMLS
Cash-flow waterfall
monthlySold comps — $/sqft
last 12 mo · ≤1 miLoading sold comps…