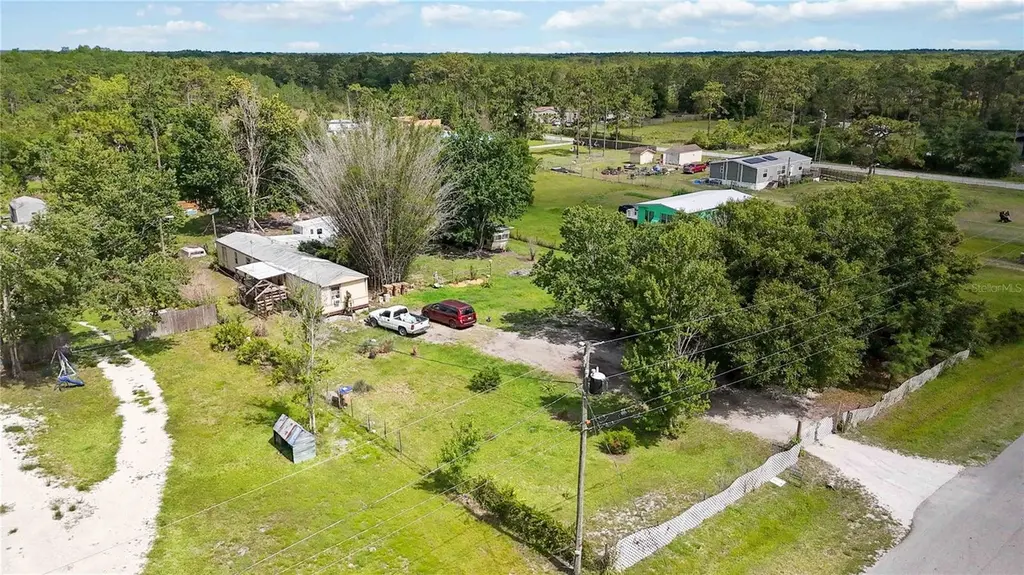
5345 Topeka Ave · Saint Cloud, FL
Flood risk 1/10 · Minimal
- FEMA flood zone
- X (unshaded)
- Chance of flooding over 30 yrs
- 0.0%
- Est. flood insurance / yr
- $507 – $1,088
Fire risk 8/10 · Major
- Est. fire insurance / yr
- $947 – $1,759
Heat risk 9/10 · Severe
- Hot days now (above 108°F)
- 7 days/yr
- Hot days in 30 yrs
- 22 days/yr
Wind risk 9/10 · Severe
- Chance of severe wind over 30 yrs
- 99.0%
Air-quality risk 1/10 · Minimal
- Unhealthy air days now
- 0 days/yr
- Unhealthy air days in 30 yrs
- 0 days/yr
Risk factors via First Street. Map © Google.
Why this score? — see what drove the A- grade
The composite is a weighted blend of 9 inputs, each scored 0–100. Each bar is that input's sub-score; the figure is the points it added to the 100-point composite (weight × sub-score).
- Cash flow +30.0/30.0
- ARV discount +15.0/15.0
- 1% rule +10.0/10.0
- DSCR +10.0/10.0
- Appreciation +4.8/10.0
- Schools +3.6/10.0
- Rent growth +2.9/5.0
- Livability +2.5/5.0
- Condition / age +2.5/5.0
$155,000
🖨 Deal sheet (PDF) 📄 Offer letter ✓ Due diligence
Listing remarks
Under contract-accepting backup offers. Investor special! Set on just short of an acre with no HOA, this fully fenced property features a single-wide manufactured home and two additional campers that will remain with the sale. Plenty of room for boats, trailers, RVs, work equipment, or outdoor living. The home is livable and offers great potential for someone looking for space and flexibility.
Key facts
- Room for trailers
- Room for boats
- Room for rvs
Tags
Property features AI
Finance
- Other: Lot approximately 0.86 acre (about 1/2 to less than 1 acre); Property subtype: Manufactured Home; Zoning: OAC; Unfurnished; Direction faces: West
- HOA & community: No HOA/association
Exterior
- Utilities: Well water; Septic tank; Cable available; Electricity available and connected; Public utilities available
- Home design: Manufactured single-wide home; One story; Faces west; Residential property
- Construction: Metal frame construction; Metal/other roof; Crawlspace foundation; Built area: 1,356 square feet
- Exterior features: Covered patio/porch; Deck; Side porch; Chain link and wood fencing; Asphalt road access
Interior
- Kitchen: Range; Refrigerator
- Bedrooms: 3 bedrooms
- Flooring: Laminate; Wood
- Bathrooms: 2 full bathrooms
- Heating & cooling: Ductless heating; Wall/Window air conditioning units
- Interior features: Ceiling fans; Thermostat
- Laundry & utility: Laundry: other (unspecified)
Neighborhood map
What this means for you Summary
Snapshot
- This is a 3-bed/2.0-bath manufactured listed at $155k.
Deal economics
- At list price, monthly cash flow is $943 ($11k/yr) — positive.
- The deal already cash-flows at list — no discount required.
- Meets the 1% rule at list price ($2k rent vs $155k).
- Recommended offer: $153k (1.5% below list) — sets the bar for market timing.
Location & tenants
- Location reads: area grade A — affects rentability + tenant quality, not the cash-flow math above.
- Osceola (suburban): math 39% / reading 45% proficiency, ranked #60 of 73 in FL (top 82%) — families likely to look elsewhere, expect single-tenant / working-renter base with shorter leases; 60% free/reduced lunch — lower-income household profile, screen leases tightly.
- Zoned schools: Harmony Community School (math 70% / reading 64%, grade B+, #450 of 2,144 statewide, top 22%, 1,012 students, 38% FRL); Harmony High School (math 40% / reading 46%, grade F, #255 of 667 statewide, top 39%, 2,822 students, 42% FRL) — zoned schools average 40% FRL vs 60% district-wide (20 pts lower); this property's tenant base skews higher-income than the district average.
- Zoned-school proficiency averages 55% at this address vs 42% district-wide (+13 pts) — the actual schools serving this property are materially stronger than the Osceola average implies; a family-tenant draw the district grade alone would hide.
- Market conditions: Rents rising (+1.8%/yr); 387 active listings in the ZIP; solid renter incomes; 8,813 units permitted in Osceola County in 2024 (3,072 in 5+ unit buildings).
- This rent runs 36% of the median local income ($81k/yr) — at the standard rent-burdened threshold; future hikes will face affordability resistance.
Forward outlook
- In year one you build about $349 of equity ($1k loan paydown + $-723 appreciation (-0.5% local appreciation)).
- Osceola County population projected at +73% by 2050 — long-run rental-demand tailwind backs the buy-and-hold thesis.
- At projected returns (-0.5% appreciation + 1.8% rent growth), your $43k cash investment doubles in ~4 years — after that, you're playing with house money.
Negotiation context
- It's been on market 26 days — a 2% lower offer ($153k) is reasonable based on typical stale-listing flexibility.
- 2 sale attempts; this cycle's ask has dropped $15k (9%) from the opening price — seller is motivated, your offer sets the floor, not the list.
- Current owner paid $32k; list at $155k implies a 384% gain — meaningful room to come down on a strong offer.
Risks & watch-outs
- Climate carrying-cost: severe wind risk, 99% chance of damaging wind over 30y; severe wildfire risk; extreme-heat days projected 7→22/yr by 2055 (HVAC capex compounding) — expect insurance premiums to compound above CPI over the hold.
Questions for the listing agent
- Is there a deadline driving the sale (1031 exchange, divorce, estate, relocation)? That informs how much negotiation room exists.
- What's the average days-on-market for RENTAL listings here right now (not sales)? A rising rental-DOM trend means longer vacancies and softer asking-rent achievability than the comps imply.
- What's the recent tenant-quality profile in this submarket — average credit score on applications, eviction rate, late-payment / NSF rate, and stable-employment percentage? A property-management company in the area should have these aggregated.
- How much new for-sale + rental construction is in the pipeline within 1–3 miles? Heavy new supply typically softens prices + rents 12–24 months out; constrained supply supports both.
Investment metrics
- 1% rule
- 1.54% ✓
- Cap rate
- 13.59%
- Cash-on-cash
- 26.07%
- DSCR
- 2.16
- GRM
- 5.4
CMA / ARV
- ARV (on-the-fly)
- $253,176
- Comps found
- 1
Show comp detail 1 sale within ~0.75 mi
| Address | Dist | Beds/Ba | Sqft | Sold | Price | $/sf | Match |
|---|---|---|---|---|---|---|---|
| 9075 Lincoln Rd | 0.58mi | 2/2.0 (-1) | 904 (-2%) | 10mo | $247,500 | $274 | 56 |
Match score weights: distance 35% · size 25% · config 20% · recency 20%. Top-matched comps best support the ARV.
Projected returns pro-forma
-0.47% appreciation · 1.79% rent growth · sell at horizon
- IRR
- 24.3%
- Equity multiple
- 2.13×
- Total profit
- $49,226
- Equity at exit
- $41,425
- IRR
- 28.1%
- Equity multiple
- 3.88×
- Total profit
- $125,113
- Equity at exit
- $47,019
Cash invested: $43,400 (down + closing). Projections, not guarantees.
Landlord ↔ Tenant lean methodology
- Overall (STATE)
- 87 Strongly Landlord-Friendly
- State Florida
- 87 Strongly Landlord-Friendly · R+3
- County
- — inherits STATE
- City
- — inherits STATE
ZIP-level market 34773
- Home prices YoY
- -0.2%
- Rents YoY
- 1.8%
- Active inventory
- 387
- Price-to-rent
- 5.4×
Monthly cashflow live
- Estimated rent
- $2,388 medium interval (Pro) →
- Mortgage (P&I)
- −$813
- Tax from tax record
- −$66 /mo · $798/yr
- Insurance
- −$65
- HOA
- −$0
- Vacancy / Maint / Mgmt
- −$502
- Net cashflow
- $943
Break-even live
Sensitivity live
| Price | -10% $1,030 | -5% $987 | +0% $943 | +5% $899 | +10% $855 |
|---|---|---|---|---|---|
| Rent | -10% $754 | -5% $848 | +0% $943 | +5% $1,037 | +10% $1,131 |
| Rate | -1.0pp $1,021 | -0.5pp $982 | base $943 | +0.5pp $903 | +1.0pp $862 |
UW: 25.0% down · 7.5% · 30yr · 1.5% tax · 5.0% vac · 8.0% maint · 8.0% mgmt
Financing live
Cash to close
- Down payment
- $38,750
- Closing costs
- $4,650
- Reserves months
- —
- Total cash needed
- —
Loan-product check · same deal, 3 products live
Conventional
25% down · 7.5% · 30yr
- Down + closing
- —
- Monthly P&I
- —
- Monthly cashflow
- —
- DSCR
- —
- Eligible?
- —
Personal DTI + credit; lowest rate.
DSCR
20% down · 8.5% · 30yr
- Down + closing
- —
- Monthly P&I
- —
- Monthly cashflow
- —
- DSCR
- —
- Eligible?
- —
No personal income docs; deal must DSCR.
Hard money
10% down · 12.0% · 12mo
- Down + closing
- —
- Monthly P&I
- —
- Monthly cashflow
- —
- DSCR
- —
- Eligible?
- —
Short-term bridge; refi at stabilization.
Listing history 22 events
-
2026-06-17remarks 396-char remark
-
2026-06-17status $155,000 Pending 26 DOM
-
2026-06-16days on market $155,000 Active 26 DOM
-
2026-06-15days on market $155,000 Active 25 DOM
-
2026-06-13days on market $155,000 Active 23 DOM
-
2026-06-13pricedays on market $155,000 Active 22 DOM
-
2026-06-09days on market $170,000 Active 19 DOM
-
2026-06-08days on market $170,000 Active 18 DOM
-
2026-06-07days on market $170,000 Active 17 DOM
-
2026-06-04days on market $170,000 Active 14 DOM
-
2026-06-03days on market $170,000 Active 13 DOM
-
2026-06-02days on market $170,000 Active 12 DOM
-
2026-06-01days on market $170,000 Active 11 DOM
-
2026-05-31days on market $170,000 Active 10 DOM
-
2026-05-21$170,000 Active
-
2026-05-15historical
-
2026-05-05price $165,000
-
2026-04-25price $175,000
-
2026-04-14price $180,000
-
2026-03-28$185,000 Active
-
1993-07-29soldstatus $32,000
-
1992-11-06soldstatus $14,000
ⓘ Source: listings_history table (triggers on properties + properties_extension) + one-shot
backfill from property_details.listing_events for pre-trigger history.
Tax reassessment forecast FL · Resets to sale price
- Current annual tax
- $798 · $66/mo
- Projected year-2 tax
- $1,286 · $107/mo
- Expected delta
- +$489/yr (+$41/mo · 61.3%)
ⓘ Screening estimate from a state-policy table — verify with the county assessor before closing.
Climate risk First Street
- Flood 1/10 Low FEMA zone X (unshaded) · 0% chance over 30 yrs
- Wildfire 8/10 Severe
- Heat 9/10 Extreme 7 d/yr ≥108°F today · 22 d/yr by 30 yrs out
- Wind 9/10 Extreme 99% chance of damaging wind over 30 yrs
- Air quality 1/10 Low 0 unhealthy d/yr today · 0 by 30 yrs out
Nearby sold comps map
Loading sold comps map…
Walkable amenities ~0.75 mi
Loading nearby amenities…
Taxation est. · year 1
- Rental income
- $28,658
- − Mortgage interest
- −$8,682
- − Property taxes
- −$798
- − Insurance
- −$775
- − Repairs & maintenance
- −$2,293
- − Management
- −$2,293
- − Depreciation
- −$4,509
- Taxable income
- $9,308
- Est. tax owed @ 24.0%
- −$2,234
- After-tax cash flow
- $9,079/yr
For passive investors: Depreciation is non-cash, so a rental often shows a tax loss while cash-flowing — sheltering income. Rental losses are passive: they offset passive income freely, and up to $25,000/yr can offset ordinary (W-2) income if you actively participate and your MAGI is under $100k (phasing out to $0 by $150k); unused losses carry forward. On sale, claimed depreciation is recaptured at up to 25%, and gains may owe capital-gains tax (a 1031 exchange can defer both). Figures are a year-1 estimate at your 24.0% rate — not tax advice; consult a CPA.
Schools (NCES district)
- District
- Osceola
- NCES district ID
- 1201470
- Math proficiency
- 39% ▼ -9.00%
- Reading proficiency
- 45% ▼ -4.00%
- Median HH income
- $45,528
- Composite
- 35.7/100
- National rank
- #4865
- State rank
- #60 of 73 in FL
Livability — Saint Cloud
No livability data for this city. (Only ~50 U.S. cities are tracked.)
Census & demographics
- County
- Osceola County · 410,217 people
- City population
- 106,667
- Metro
- Orlando-Kissimmee-Sanford, FL
- Population (ZIP)
- 5,816
- Household income
- $80,524
- Rent vs Own
- Severe rent burden
- 47.0
Population outlook (Osceola County) Hauer SSP2
- Today (2025)
- 447,624 people
- By 2030
- 511,823 · +14.3%
- By 2040
- 642,986 · +43.6%
- By 2050
- 774,552 · +73.0%
- By 2075
- 1,078,144 · +140.9%
- By 2100
- 1,269,660 · +183.6%
Race, ethnicity, and origin ACS 2023
- Neighborhood character
- Majority White (59%)
- Race & ethnicity
- White 59% Hispanic / Latino 33% Two or more races 11%
- Hispanic origin (detail)
- Puerto Rican 20%
- Common ancestry
- Portuguese 5% Slovak 3% Romanian 2%
- Foreign-born
- 12% · Canada, South Korea
- Languages at home
- 67% English-only · Spanish 27% Other Indo-European 4% German/W. Germanic 1%
Political lean MEDSL · Osceola
- 2024 margin
- Toss-up / Even · D 48.7% · R 50.2% · Other 1.1%
- 2008→2024 swing
- -21.2pp toward R · 2008: 19.7pp · 2024: -1.4pp
- All cycles
- 2024: R+1.4 2020: D+13.8 2016: D+25.0 2012: D+24.5 2008: D+19.7
Not yet ingested
- Civics
- —
Market trends
- HPI YoY
- ▼ -0.47%
- Current HPI
- 279.5662
- Rent YoY
- ▲ 1.79%
- Metro
- Orlando-Kissimmee-Sanford, FL
- State GDP YoY
- ▲ 3.28%
- F500 in state
- 36
Industry mix (Fortune 500 HQ in FL)
| Industry | F500 HQs | Revenue |
|---|---|---|
| Industrial Technology | 2 | $29B |
|
||
| Insurance | 2 | $17B |
|
||
| Retail | 1 | $60B |
|
||
| Technology Distribution | 1 | $58B |
|
||
| Homebuilding | 1 | $35B |
|
||
| Technology Manufacturing | 1 | $35B |
|
||
Price history
+1114.3% since first listed8 events — show timeline
- 2026-05-21 Listed $170,000 Stellar MLS as Distributed by MLS Grid
- 2026-05-15 Listing Removed — Stellar MLS as Distributed by MLS Grid
- 2026-05-05 Price Changed $165,000 Stellar MLS as Distributed by MLS Grid
- 2026-04-25 Price Changed $175,000 Stellar MLS as Distributed by MLS Grid
- 2026-04-14 Price Changed $180,000 Stellar MLS as Distributed by MLS Grid
- 2026-03-28 Listed $185,000 Stellar MLS as Distributed by MLS Grid
- 1993-07-29 Sold (Public Records) $32,000 Public Records
- 1992-11-06 Sold (Public Records) $14,000 Public Records
Property tax history
+6.3%/yrLatest (2025): $798 · +13.4% YoY. Source: county tax records.
Cash-flow waterfall
monthlySold comps — $/sqft
last 12 mo · ≤1 miLoading sold comps…