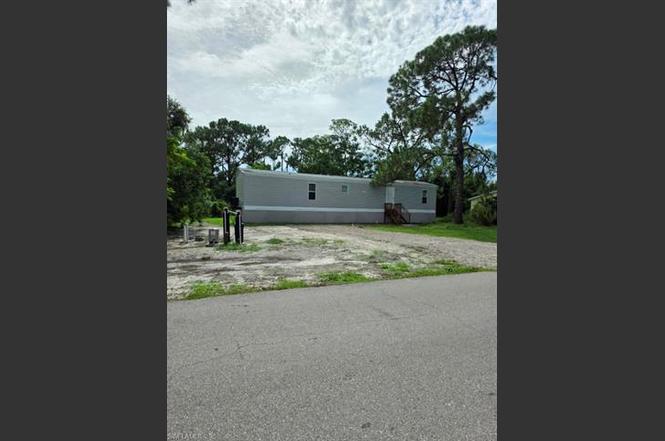
8385 Marx Dr · Suncoast Estates, FL
Flood risk 4/10 · Minor
- FEMA flood zone
- X (unshaded)
- Chance of flooding over 30 yrs
- 0.22%
- Est. flood insurance / yr
- $507 – $1,088
Fire risk 4/10 · Minor
- Est. fire insurance / yr
- $947 – $1,759
Heat risk 10/10 · Severe
- Hot days now (above 107°F)
- 7 days/yr
- Hot days in 30 yrs
- 28 days/yr
Wind risk 10/10 · Severe
- Chance of severe wind over 30 yrs
- 99.0%
Air-quality risk 2/10 · Minimal
- Unhealthy air days now
- 1 days/yr
- Unhealthy air days in 30 yrs
- 1 days/yr
Risk factors via First Street. Map © Google.
Why this score? — see what drove the D- grade
The composite is a weighted blend of 9 inputs, each scored 0–100. Each bar is that input's sub-score; the figure is the points it added to the 100-point composite (weight × sub-score).
- Cash flow +12.8/30.0
- ARV discount +7.5/15.0
- Schools +4.1/10.0
- DSCR +3.8/10.0
- Livability +3.4/5.0
- Rent growth +3.2/5.0
- 1% rule +2.5/10.0
- Condition / age +2.5/5.0
- Appreciation +0.0/10.0
$200,000
🖨 Deal sheet (PDF) 📄 Offer letter ✓ Due diligence
Listing remarks MLS
ready for a NEW manufactured home. .. .. NO FEES, NO RESTRICTIONS, -- NOT IN A FLOOD ZONE. .. . The surrounding community of North Fort Myers, FL 33917, North Fort Myers is the largest unincorporated area in Lee County. Expanding 70 square miles, from the northern shore of the Caloosahatchee to Charlotte County, Cape Coral west, and east to Alva. ---as the locals say 20 minutes to everywhere. .
Key facts
- Semi-furnished home
- No hoas
- Brand new well
Tags
Property features AI
Finance
- Other: Zoning: MH-1; Lot unit: 40; Regular lot; Lot dimensions reported by Property Appraiser Office; Approximately 0.2980 acres; Single unit on one floor (one-story)
- HOA & community: No HOA maintenance fees; Community offers internet access (see remarks); Non-gated community
Exterior
- Parking: No specific parking details provided
- Security: Smoke detectors
- Utilities: Water: softener; Sewer: septic; Cable available
- Home design: Manufactured residential property; Single-story; Located in SUNCOAST ESTATE
- Construction: Built in 2022; Manufactured construction
- Exterior features: Patio; Vinyl siding; Windows – see remarks; Shingle roof; Rear exposure facing east; Landscaped area and partial buildings view
Interior
- Kitchen: Range; Refrigerator
- Bedrooms: 3 bedrooms
- Flooring: Laminate flooring
- Bathrooms: 2 full bathrooms; Master bathroom with tub only
- Heating & cooling: Central electric heat; Central electric air conditioning
- Interior features: High-speed internet available; See remarks; Smoke detectors; Partially furnished; Split bedroom floor plan
- Laundry & utility: Washer/dryer hookup
Neighborhood map
What this means for you Summary
Snapshot
- This is a 3-bed/2.0-bath land listed at $200k.
Deal economics
- At list price, monthly cash flow is $-20 ($-241/yr) — negative.
- To cash-flow at today's rent, offer at most $196k (1.8% below list).
- To meet the 1% rule (rent ≥ 1% of price), the offer needs to be $150k (25.0% below list).
- Recommended offer: $150k (25.0% below list) — sets the bar for 1% rule.
Location & tenants
- Location reads 68/100 on livability (#507 in FL) — a middle-class / working-renter tenant base. Strengths: cost of living A+, housing A+, crime B; Watch: commute D, amenities F, employment D-.
- Lee (suburban): math 47% / reading 50% proficiency, ranked #42 of 73 in FL (top 58%) — families likely to look elsewhere, expect single-tenant / working-renter base with shorter leases.
- Zoned schools: Diplomat Elementary School (math 67% / reading 60%, grade B, #564 of 2,144 statewide, top 27%, 1,069 students, 56% FRL); Mariner Middle School (math 50% / reading 47%, grade C-, #274 of 571 statewide, top 50%, 1,001 students, 53% FRL); Ida S. Baker High School (math 44% / reading 47%, grade D-, #223 of 667 statewide, top 34%, 1,933 students, 39% FRL).
- Market conditions: Rents rising (+2.6%/yr); 849 active listings in the ZIP; 9 comparable units currently listed for rent nearby; rentals at typical pace (median 27d on market — plan ~3-4 weeks tenant-placement turnaround); 15,411 units permitted in Lee County in 2024 (4,686 in 5+ unit buildings).
- This rent runs 33% of the median local income ($55k/yr) — at the standard rent-burdened threshold; future hikes will face affordability resistance.
Forward outlook
- Local home prices are declining (-3.0%/yr); year-one equity from $1k of loan paydown is wiped out by about $6k of value loss. Plan a longer hold.
- Lee County population projected at +44% by 2050 — long-run rental-demand tailwind backs the buy-and-hold thesis.
Negotiation context
- It's been on market 117 days — a 9% lower offer ($182k) is reasonable based on typical stale-listing flexibility.
- 8 sale attempts since 7y ago; this cycle's ask is 11011% above the opening price — seller raised mid-cycle; expect resistance to lowballs.
- Current owner paid $40k; list at $200k implies a 400% gain — meaningful room to come down on a strong offer.
Risks & watch-outs
- Climate carrying-cost: severe wind risk, 99% chance of damaging wind over 30y; extreme-heat days projected 7→28/yr by 2055 (HVAC capex compounding) — expect insurance premiums to compound above CPI over the hold.
Questions for the listing agent
- What do current leases actually rent for vs. the listed asking? Can we see a recent rent roll and the last 12 months of T-12 income?
- It's been on market 117 days. Have you received any prior offers? Is the seller open to a 25% concession, seller financing, or rate buy-down credit?
- Why hasn't it sold? Are there any deal-killer items the seller is aware of (foundation, flood, title, zoning, code violations)?
- Is there a deadline driving the sale (1031 exchange, divorce, estate, relocation)? That informs how much negotiation room exists.
- Schools are F-rated, which usually means shorter tenancies and higher turnover. Who's the typical renter profile here, and what's been the actual vacancy rate?
- The area grade is low — what's the realistic commute time and amenity access for the typical tenant pool here? Any planned neighborhood developments (good or bad) we should know about?
- What's the average days-on-market for RENTAL listings here right now (not sales)? A rising rental-DOM trend means longer vacancies and softer asking-rent achievability than the comps imply.
- What's the recent tenant-quality profile in this submarket — average credit score on applications, eviction rate, late-payment / NSF rate, and stable-employment percentage? A property-management company in the area should have these aggregated.
- How much new for-sale + rental construction is in the pipeline within 1–3 miles? Heavy new supply typically softens prices + rents 12–24 months out; constrained supply supports both.
Investment metrics
- 1% rule
- 0.75% ✗
- Cap rate
- 6.17%
- Cash-on-cash
- -0.43%
- DSCR
- 0.98
- GRM
- 11.1
CMA / ARV
No comps found within radius.
Projected returns pro-forma
-3.0% appreciation · 2.63% rent growth · sell at horizon
- IRR
- -17.4%
- Equity multiple
- 0.39×
- Total profit
- $-34,329
- Equity at exit
- $29,821
- IRR
- -10.2%
- Equity multiple
- 0.39×
- Total profit
- $-34,155
- Equity at exit
- $17,292
Cash invested: $56,000 (down + closing). Projections, not guarantees.
Landlord ↔ Tenant lean methodology
- Overall (STATE)
- 87 Strongly Landlord-Friendly
- State Florida
- 87 Strongly Landlord-Friendly · R+3
- County
- — inherits STATE
- City
- — inherits STATE
ZIP-level market 33917
- Home prices YoY
- -30.2%
- Rents YoY
- 2.6%
- Active inventory
- 849
- Price-to-rent
- 11.1×
Monthly cashflow live
- Estimated rent
- $1,501 high interval (Pro) →
- Mortgage (P&I)
- −$1,049
- Tax from tax record
- −$73 /mo · $882/yr
- Insurance
- −$83
- HOA
- −$0
- Lot rent
- −$0
- Vacancy / Maint / Mgmt
- −$315
- Net cashflow
- $-20
Break-even live
Sensitivity live
| Price | -10% $93 | -5% $37 | +0% $-20 | +5% $-77 | +10% $-133 |
|---|---|---|---|---|---|
| Rent | -10% $-139 | -5% $-79 | +0% $-20 | +5% $39 | +10% $98 |
| Rate | -1.0pp $81 | -0.5pp $31 | base $-20 | +0.5pp $-72 | +1.0pp $-125 |
UW: 25.0% down · 7.5% · 30yr · 1.5% tax · 5.0% vac · 8.0% maint · 8.0% mgmt
Financing live
Cash to close
- Down payment
- $50,000
- Closing costs
- $6,000
- Reserves months
- —
- Total cash needed
- —
Loan-product check · same deal, 3 products live
Conventional
25% down · 7.5% · 30yr
- Down + closing
- —
- Monthly P&I
- —
- Monthly cashflow
- —
- DSCR
- —
- Eligible?
- —
Personal DTI + credit; lowest rate.
DSCR
20% down · 8.5% · 30yr
- Down + closing
- —
- Monthly P&I
- —
- Monthly cashflow
- —
- DSCR
- —
- Eligible?
- —
No personal income docs; deal must DSCR.
Hard money
10% down · 12.0% · 12mo
- Down + closing
- —
- Monthly P&I
- —
- Monthly cashflow
- —
- DSCR
- —
- Eligible?
- —
Short-term bridge; refi at stabilization.
Rent comps 9 comps
| Address | Beds | Baths | Sqft | Rent | $/sqft | DOM | Units | Dist |
|---|---|---|---|---|---|---|---|---|
| 8205 Suncoast Dr North Fort Myers, FL | 2.0 | 1.0 | 672 | $850 | $1.26 | 26d | 1 | 0.46mi |
| 8146 Tolles Dr North Fort Myers, FL | 2.0 | 1.0 | 784 | $850 | $1.08 | 26d | 1 | 0.53mi |
| 8086 Heck Dr Unit 6 North Fort Myers, FL | 2.0 | 1.0 | 600 | $800 | $1.33 | 26d | 1 | 0.69mi |
| 2388 Case Ln North Fort Myers, FL | 3.0 | 2.0 | 1064 | $1,825 | $1.72 | 5d | 1 | 0.74mi |
| 8028 Breeze Dr North Fort Myers, FL | 2.0 | 1.0 | 750 | $850 | $1.13 | 26d | 1 | 0.87mi |
| 2211 Cantor Ln North Fort Myers, FL | 2.0 | 2.0 | 672 | $850 | $1.26 | 4d | 1 | 0.98mi |
| 7869 Suncoast Dr North Fort Myers, FL | 2.0 | 1.0 | 564 | $850 | $1.51 | 4d | 1 | 1.09mi |
| 2095 Eloise Cir North Fort Myers, FL | 2.0 | 1.0 | 840 | $1,295 | $1.54 | 26d | 1 | 1.29mi |
| 2027 Eloise Cir North Fort Myers, FL | 2.0 | 1.0 | 822 | $1,300 | $1.58 | 6d | 1 | 1.29mi |
Listing history 38 events
-
2026-06-22days on market $200,000 Active 117 DOM
-
2026-06-22days on market $200,000 Active 116 DOM
-
2026-06-17days on market $200,000 Active 112 DOM
-
2026-06-16days on market $200,000 Active 111 DOM
-
2026-06-15days on market $200,000 Active 110 DOM
-
2026-06-13days on market $200,000 Active 108 DOM
-
2026-06-10days on market $200,000 Active 105 DOM
-
2026-06-09days on market $200,000 Active 104 DOM
-
2026-06-07days on market $200,000 Active 102 DOM
-
2026-06-02days on market $200,000 Active 97 DOM
-
2026-06-01days on market $200,000 Active 96 DOM
-
2026-06-01days on market $200,000 Active 95 DOM
-
2026-04-18price $1,500
-
2026-04-10price $1,600
-
2026-04-03$1,800
-
2026-04-03status Active
-
2025-10-01historical
-
2025-08-26$200,000 Active
-
2024-04-04soldstatus $40,000 Closed 399-char remark
Show marketing remark (399 chars)
ready for a NEW manufactured home. .. .. NO FEES, NO RESTRICTIONS, -- NOT IN A FLOOD ZONE. .. . The surrounding community of North Fort Myers, FL 33917, North Fort Myers is the largest unincorporated area in Lee County. Expanding 70 square miles, from the northern shore of the Caloosahatchee to Charlotte County, Cape Coral west, and east to Alva. ---as the locals say 20 minutes to everywhere. .
-
2024-03-28soldstatus $40,000
-
2024-03-11status Pending 399-char remark
Show marketing remark (399 chars)
ready for a NEW manufactured home. .. .. NO FEES, NO RESTRICTIONS, -- NOT IN A FLOOD ZONE. .. . The surrounding community of North Fort Myers, FL 33917, North Fort Myers is the largest unincorporated area in Lee County. Expanding 70 square miles, from the northern shore of the Caloosahatchee to Charlotte County, Cape Coral west, and east to Alva. ---as the locals say 20 minutes to everywhere. .
-
2024-01-24price $45,000 399-char remark
Show marketing remark (399 chars)
ready for a NEW manufactured home. .. .. NO FEES, NO RESTRICTIONS, -- NOT IN A FLOOD ZONE. .. . The surrounding community of North Fort Myers, FL 33917, North Fort Myers is the largest unincorporated area in Lee County. Expanding 70 square miles, from the northern shore of the Caloosahatchee to Charlotte County, Cape Coral west, and east to Alva. ---as the locals say 20 minutes to everywhere. .
-
2024-01-02status Active 399-char remark
Show marketing remark (399 chars)
ready for a NEW manufactured home. .. .. NO FEES, NO RESTRICTIONS, -- NOT IN A FLOOD ZONE. .. . The surrounding community of North Fort Myers, FL 33917, North Fort Myers is the largest unincorporated area in Lee County. Expanding 70 square miles, from the northern shore of the Caloosahatchee to Charlotte County, Cape Coral west, and east to Alva. ---as the locals say 20 minutes to everywhere. .
-
2023-12-14status Pending 399-char remark
Show marketing remark (399 chars)
ready for a NEW manufactured home. .. .. NO FEES, NO RESTRICTIONS, -- NOT IN A FLOOD ZONE. .. . The surrounding community of North Fort Myers, FL 33917, North Fort Myers is the largest unincorporated area in Lee County. Expanding 70 square miles, from the northern shore of the Caloosahatchee to Charlotte County, Cape Coral west, and east to Alva. ---as the locals say 20 minutes to everywhere. .
-
2023-10-30$48,000 Active 399-char remark
Show marketing remark (399 chars)
ready for a NEW manufactured home. .. .. NO FEES, NO RESTRICTIONS, -- NOT IN A FLOOD ZONE. .. . The surrounding community of North Fort Myers, FL 33917, North Fort Myers is the largest unincorporated area in Lee County. Expanding 70 square miles, from the northern shore of the Caloosahatchee to Charlotte County, Cape Coral west, and east to Alva. ---as the locals say 20 minutes to everywhere. .
-
2022-12-12historical
-
2022-11-22$45,000 Active
-
2021-10-06soldstatus $24,000
-
2021-10-01soldstatus $25,000 Sold
-
2021-09-21status Pending
-
2021-08-31$25,000 Active
-
2021-03-29soldstatus $8,000
-
2019-05-21soldstatus $9,000
-
2019-05-20soldstatus $9,000 Sold
-
2019-04-15status Pending
-
2019-04-01price $10,500
-
2019-02-06price $14,500
-
2019-02-06$12,500 Active
ⓘ Source: listings_history table (triggers on properties + properties_extension) + one-shot
backfill from property_details.listing_events for pre-trigger history.
Tax reassessment forecast FL · Resets to sale price
- Current annual tax
- $882 · $73/mo
- Projected year-2 tax
- $1,660 · $138/mo
- Expected delta
- +$778/yr (+$65/mo · 88.3%)
ⓘ Screening estimate from a state-policy table — verify with the county assessor before closing.
Climate risk First Street
- Flood 4/10 Moderate FEMA zone X (unshaded) · 22% chance over 30 yrs
- Wildfire 4/10 Moderate
- Heat 10/10 Extreme 7 d/yr ≥107°F today · 28 d/yr by 30 yrs out
- Wind 10/10 Extreme 99% chance of damaging wind over 30 yrs
- Air quality 2/10 Low 1 unhealthy d/yr today · 1 by 30 yrs out
Nearby sold comps map
Loading sold comps map…
Walkable amenities ~0.75 mi
Loading nearby amenities…
Taxation est. · year 1
- Rental income
- $18,008
- − Mortgage interest
- −$11,203
- − Property taxes
- −$882
- − Insurance
- −$1,000
- − Repairs & maintenance
- −$1,441
- − Management
- −$1,441
- − Depreciation
- −$5,818
- Taxable loss
- −$3,776
- Est. tax savings @ 24.0%
- +$906
- After-tax cash flow
- $665/yr
For passive investors: Depreciation is non-cash, so a rental often shows a tax loss while cash-flowing — sheltering income. Rental losses are passive: they offset passive income freely, and up to $25,000/yr can offset ordinary (W-2) income if you actively participate and your MAGI is under $100k (phasing out to $0 by $150k); unused losses carry forward. On sale, claimed depreciation is recaptured at up to 25%, and gains may owe capital-gains tax (a 1031 exchange can defer both). Figures are a year-1 estimate at your 24.0% rate — not tax advice; consult a CPA.
Schools (NCES district)
- District
- Lee
- NCES district ID
- 1201080
- Math proficiency
- 47% ▼ -11.00%
- Reading proficiency
- 50% ▼ -4.00%
- Median HH income
- $49,518
- Composite
- 41.49/100
- National rank
- #3458
- State rank
- #42 of 73 in FL
Livability — Suncoast Estates
- Score
- 68/100
- State rank
- #507
- US rank
- #9351
Category grades
Schools grade is shown separately in the Schools card above.
Census & demographics
- Census place
- Suncoast Estates, FL
- County
- Lee County · 788,662 people
- Metro
- Cape Coral-Fort Myers, FL
- Population (ZIP)
- 33,380
- Household income
- $55,000
- Rent vs Own
- Severe rent burden
- 775.0
Population outlook (Lee County) Hauer SSP2
- Today (2025)
- 871,946 people
- By 2030
- 955,468 · +9.6%
- By 2040
- 1,113,587 · +27.7%
- By 2050
- 1,256,891 · +44.1%
- By 2075
- 1,560,270 · +78.9%
- By 2100
- 1,726,848 · +98.0%
Race, ethnicity, and origin ACS 2023
- Neighborhood character
- Predominantly White (85%)
- Race & ethnicity
- White 85% Hispanic / Latino 10% Two or more races 7% Asian 1% Black 1%
- Hispanic origin (detail)
- Mexican 2% Puerto Rican 1% Cuban 3%
- Common ancestry
- Lithuanian 3% Romanian 3% Slovak 2%
- Foreign-born
- 10% · Canada
- Languages at home
- 88% English-only · Spanish 9% Other Indo-European 1% Russian/Polish/Slavic 1%
Political lean MEDSL · Lee
- 2024 margin
- Strong R (+28.4) · D 35.5% · R 63.9%
- 2008→2024 swing
- -18.0pp toward R · 2008: -10.4pp · 2024: -28.4pp
- All cycles
- 2024: R+28.4 2020: R+19.2 2016: R+20.4 2012: R+16.6 2008: R+10.4
Not yet ingested
- Civics
- —
Market trends
- HPI YoY
- ▼ -122.28%
- Current HPI
- 282.2895
- Rent YoY
- ▲ 2.63%
- Metro
- Cape Coral-Fort Myers, FL
- State GDP YoY
- ▲ 3.28%
- F500 in state
- 36
Industry mix (Fortune 500 HQ in FL)
| Industry | F500 HQs | Revenue |
|---|---|---|
| Industrial Technology | 2 | $29B |
|
||
| Insurance | 2 | $17B |
|
||
| Retail | 1 | $60B |
|
||
| Technology Distribution | 1 | $58B |
|
||
| Homebuilding | 1 | $35B |
|
||
| Technology Manufacturing | 1 | $35B |
|
||
Price history
-88.0% since first listed26 events — show timeline
- 2026-04-18 Price Changed $1,500 NAPLESMLS
- 2026-04-10 Price Changed $1,600 NAPLESMLS
- 2026-04-03 Listed for Rent $1,800 NAPLESMLS
- 2026-04-03 Relisted — NAPLESMLS
- 2025-10-01 Listing Removed — NAPLESMLS
- 2025-08-26 Listed $200,000 NAPLESMLS
- 2024-04-04 Sold (MLS) $40,000 FORTMLS
- 2024-03-28 Sold (Public Records) $40,000 Public Records
- 2024-03-11 Pending — FORTMLS
- 2024-01-24 Price Changed $45,000 FORTMLS
- 2024-01-02 Relisted — FORTMLS
- 2023-12-14 Pending — FORTMLS
- 2023-10-30 Listed $48,000 FORTMLS
- 2022-12-12 Listing Removed — FORTMLS
- 2022-11-22 Listed $45,000 FORTMLS
- 2021-10-06 Sold (Public Records) $24,000 Public Records
- 2021-10-01 Sold (MLS) $25,000 NAPLESMLS
- 2021-09-21 Pending — NAPLESMLS
- 2021-08-31 Listed $25,000 NAPLESMLS
- 2021-03-29 Sold (Public Records) $8,000 Public Records
- 2019-05-21 Sold (Public Records) $9,000 Public Records
- 2019-05-20 Sold (MLS) $9,000 FORTMLS
- 2019-04-15 Pending — FORTMLS
- 2019-04-01 Price Changed $10,500 FORTMLS
- 2019-02-06 Price Changed $14,500 FORTMLS
- 2019-02-06 Listed $12,500 FORTMLS
Property tax history
+27.3%/yrLatest (2025): $882 · +222.4% YoY. Source: county tax records.
Cash-flow waterfall
monthlySold comps — $/sqft
last 12 mo · ≤1 miLoading sold comps…