4004 County Road 436 · New Bloomfield, MO
Flood risk 1/10 · Minimal
- FEMA flood zone
- X (unshaded)
- Chance of flooding over 30 yrs
- 0.0%
- Est. flood insurance / yr
- $473 – $860
Fire risk 4/10 · Minor
- Est. fire insurance / yr
- $1,054 – $1,958
Heat risk 3/10 · Minor
- Hot days now (above 107°F)
- 7 days/yr
- Hot days in 30 yrs
- 19 days/yr
Wind risk 2/10 · Minimal
- Chance of severe wind over 30 yrs
- —
Air-quality risk 2/10 · Minimal
- Unhealthy air days now
- 1 days/yr
- Unhealthy air days in 30 yrs
- 1 days/yr
Risk factors via First Street. Map © Google.
Why this score? — see what drove the B- grade
The composite is a weighted blend of 9 inputs, each scored 0–100. Each bar is that input's sub-score; the figure is the points it added to the 100-point composite (weight × sub-score).
- Cash flow +30.0/30.0
- 1% rule +10.0/10.0
- DSCR +10.0/10.0
- ARV discount +7.5/15.0
- Schools +3.3/10.0
- Livability +3.2/5.0
- Rent growth +2.5/5.0
- Condition / age +2.5/5.0
- Appreciation +0.0/10.0
$120,000
🖨 Deal sheet (PDF) 📄 Offer letter ✓ Due diligence
Listing remarks
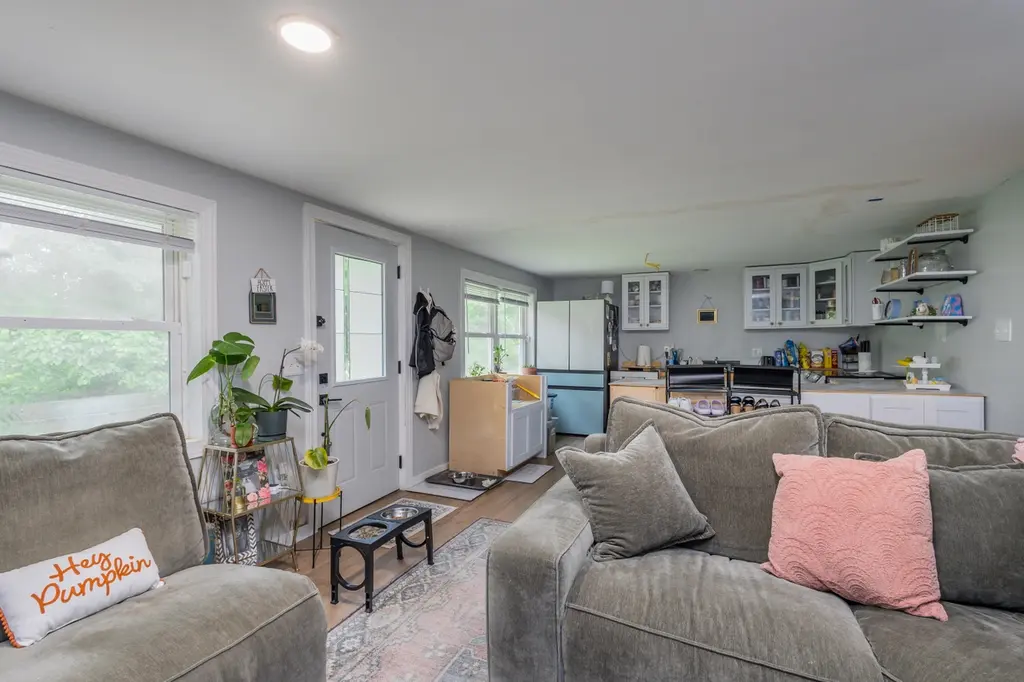
Tucked away on one acre, amongst mature trees on a partially wooded lot, this unique earth home offers the perfect blend of privacy, character, and natural beauty. Surrounded by the peaceful countryside, this property creates a serene retreat while still being conveniently located near town. The earth home design provides a cozy atmosphere and energy efficiency. Whether you're looking for a secluded homestead, weekend escape, or a property with distinctive character, this one-of-a-kind setting is full of potential and ready to make your own.
Key facts
- Partially wooded lot
- Energy efficiency
- Mature trees
Tags
Property features AI
Exterior
- Parking: Open parking; no garage
- Home design: Single Family Residence
- Exterior features: Approximately 1 acre lot; Zoned R-1 One-Family Dwelling
Interior
- Bathrooms: 1 full bathroom
- Interior features: Total of 5 rooms
Neighborhood map
What this means for you Summary
Snapshot
- This is a 2-bed/1.0-bath single-family listed at $120k.
Deal economics
- At list price, monthly cash flow is $702 ($8k/yr) — positive.
- The deal already cash-flows at list — no discount required.
- Meets the 1% rule at list price ($2k rent vs $120k).
- Recommended offer: $118k (1.5% below list) — sets the bar for market timing.
Location & tenants
- Location reads 63/100 on livability (#365 in MO) — a middle-class / working-renter tenant base. Strengths: cost of living A+, housing A+; Watch: crime F, amenities F, commute F.
- New Bloomfield R-III (rural): math 35% / reading 39% proficiency, ranked #165 of 324 in MO (top 51%) — families likely to look elsewhere, expect single-tenant / working-renter base with shorter leases.
- Zoned schools: New Bloomfield Elem. (math 27% / reading 32%, grade F, #813 of 1,115 statewide, top 75%, 358 students, 34% FRL); New Bloomfield High (math 42% / reading 47%, grade F, #179 of 521 statewide, top 39%, 307 students, 38% FRL) — zoned schools at 36% FRL track the district average.
- Market conditions: 35 active listings in the ZIP; 40 units permitted in Callaway County in 2024 (0 in 5+ unit buildings).
Forward outlook
- Local home prices are declining (-3.0%/yr); year-one equity from $830 of loan paydown is wiped out by about $4k of value loss. Plan a longer hold.
- At projected returns (-3.0% appreciation + 3.0% rent growth), your $34k cash investment doubles in ~5 years — after that, you're playing with house money.
Negotiation context
- It's been on market 29 days — a 2% lower offer ($118k) is reasonable based on typical stale-listing flexibility.
Questions for the listing agent
- Is there a deadline driving the sale (1031 exchange, divorce, estate, relocation)? That informs how much negotiation room exists.
- Schools are D-rated, which usually means shorter tenancies and higher turnover. Who's the typical renter profile here, and what's been the actual vacancy rate?
- Crime grade is F in this area — have there been break-ins, vandalism, or insurance claims at this property in the last 3 years? What carrier currently insures it and at what premium?
- What's the average days-on-market for RENTAL listings here right now (not sales)? A rising rental-DOM trend means longer vacancies and softer asking-rent achievability than the comps imply.
- What's the recent tenant-quality profile in this submarket — average credit score on applications, eviction rate, late-payment / NSF rate, and stable-employment percentage? A property-management company in the area should have these aggregated.
- How much new for-sale + rental construction is in the pipeline within 1–3 miles? Heavy new supply typically softens prices + rents 12–24 months out; constrained supply supports both.
Investment metrics
- 1% rule
- 1.50% ✓
- Cap rate
- 13.32%
- Cash-on-cash
- 25.09%
- DSCR
- 2.12
- GRM
- 5.5
CMA / ARV
No comps found within radius.
Projected returns pro-forma
-3.0% appreciation · 3.0% rent growth · sell at horizon
- IRR
- 18.5%
- Equity multiple
- 1.75×
- Total profit
- $25,256
- Equity at exit
- $17,892
- IRR
- 26.9%
- Equity multiple
- 3.36×
- Total profit
- $79,444
- Equity at exit
- $10,375
Cash invested: $33,600 (down + closing). Projections, not guarantees.
Landlord ↔ Tenant lean methodology
- Overall (STATE)
- 81 Strongly Landlord-Friendly
- State Missouri
- 81 Strongly Landlord-Friendly · R+10
- County
- — inherits STATE
- City
- — inherits STATE
ZIP-level market 65063
- Home prices YoY
- -26.8%
- Active inventory
- 35
- Price-to-rent
- 5.5×
Monthly cashflow live
- Estimated rent
- $1,803 medium interval (Pro) →
- Mortgage (P&I)
- −$629
- Tax from tax record
- −$42 /mo · $509/yr
- Insurance
- −$50
- HOA
- −$0
- Vacancy / Maint / Mgmt
- −$379
- Net cashflow
- $702
Break-even live
Sensitivity live
| Price | -10% $770 | -5% $736 | +0% $702 | +5% $668 | +10% $635 |
|---|---|---|---|---|---|
| Rent | -10% $560 | -5% $631 | +0% $702 | +5% $774 | +10% $845 |
| Rate | -1.0pp $763 | -0.5pp $733 | base $702 | +0.5pp $671 | +1.0pp $640 |
UW: 25.0% down · 7.5% · 30yr · 1.5% tax · 5.0% vac · 8.0% maint · 8.0% mgmt
Financing live
Cash to close
- Down payment
- $30,000
- Closing costs
- $3,600
- Reserves months
- —
- Total cash needed
- —
Loan-product check · same deal, 3 products live
Conventional
25% down · 7.5% · 30yr
- Down + closing
- —
- Monthly P&I
- —
- Monthly cashflow
- —
- DSCR
- —
- Eligible?
- —
Personal DTI + credit; lowest rate.
DSCR
20% down · 8.5% · 30yr
- Down + closing
- —
- Monthly P&I
- —
- Monthly cashflow
- —
- DSCR
- —
- Eligible?
- —
No personal income docs; deal must DSCR.
Hard money
10% down · 12.0% · 12mo
- Down + closing
- —
- Monthly P&I
- —
- Monthly cashflow
- —
- DSCR
- —
- Eligible?
- —
Short-term bridge; refi at stabilization.
Listing history 18 events
-
2026-06-19days on market $120,000 Active 29 DOM
-
2026-06-18days on market $120,000 Active 28 DOM
-
2026-06-17days on market $120,000 Active 27 DOM
-
2026-06-16days on market $120,000 Active 26 DOM
-
2026-06-15days on market $120,000 Active 25 DOM
-
2026-06-14days on market $120,000 Active 23 DOM
-
2026-06-13days on market $120,000 Active 22 DOM
-
2026-06-10days on market $120,000 Active 20 DOM
-
2026-06-09days on market $120,000 Active 19 DOM
-
2026-06-08days on market $120,000 Active 18 DOM
-
2026-06-07days on market $120,000 Active 17 DOM
-
2026-06-02days on market $120,000 Active 12 DOM
-
2026-06-01days on market $120,000 Active 11 DOM
-
2026-05-31days on market $120,000 Active 10 DOM
-
2026-05-30days on market $120,000 Active 9 DOM
-
2026-05-22$120,000 Active
-
2022-05-16soldstatus
-
1988-06-13soldstatus
ⓘ Source: listings_history table (triggers on properties + properties_extension) + one-shot
backfill from property_details.listing_events for pre-trigger history.
Tax reassessment forecast MO · Resets to sale price
- Current annual tax
- $509 · $42/mo
- Projected year-2 tax
- $1,164 · $97/mo
- Expected delta
- +$655/yr (+$55/mo · 128.8%)
ⓘ Screening estimate from a state-policy table — verify with the county assessor before closing.
Climate risk First Street
- Flood 1/10 Low FEMA zone X (unshaded) · 0% chance over 30 yrs
- Wildfire 4/10 Moderate
- Heat 3/10 Moderate 7 d/yr ≥107°F today · 19 d/yr by 30 yrs out
- Wind 2/10 Low
- Air quality 2/10 Low 1 unhealthy d/yr today · 1 by 30 yrs out
Nearby sold comps map
Loading sold comps map…
Walkable amenities ~0.75 mi
Loading nearby amenities…
Taxation est. · year 1
- Rental income
- $21,633
- − Mortgage interest
- −$6,722
- − Property taxes
- −$509
- − Insurance
- −$600
- − Repairs & maintenance
- −$1,731
- − Management
- −$1,731
- − Depreciation
- −$3,491
- Taxable income
- $6,850
- Est. tax owed @ 24.0%
- −$1,644
- After-tax cash flow
- $6,786/yr
For passive investors: Depreciation is non-cash, so a rental often shows a tax loss while cash-flowing — sheltering income. Rental losses are passive: they offset passive income freely, and up to $25,000/yr can offset ordinary (W-2) income if you actively participate and your MAGI is under $100k (phasing out to $0 by $150k); unused losses carry forward. On sale, claimed depreciation is recaptured at up to 25%, and gains may owe capital-gains tax (a 1031 exchange can defer both). Figures are a year-1 estimate at your 24.0% rate — not tax advice; consult a CPA.
Schools (NCES district)
- District
- New Bloomfield R-III
- NCES district ID
- 2921875
- Math proficiency
- 35% ▼ -5.00%
- Reading proficiency
- 39% ▼ -6.00%
- Median HH income
- $60,892
- Composite
- 33.04/100
- National rank
- #5574
- State rank
- #165 of 324 in MO
Livability — New Bloomfield
- Score
- 63/100
- State rank
- #365
- US rank
- #16061
Category grades
Schools grade is shown separately in the Schools card above.
Census & demographics
- City population
- 4,180
- Population (ZIP)
- 4,180
Population outlook (Callaway County) Hauer SSP2
- Today (2025)
- 45,390 people
- By 2030
- 45,493 · +0.2%
- By 2040
- 45,092 · -0.7%
- By 2050
- 44,069 · -2.9%
- By 2075
- 41,875 · -7.7%
- By 2100
- 38,094 · -16.1%
Race, ethnicity, and origin ACS 2023
- Neighborhood character
- Predominantly White (91%)
- Race & ethnicity
- White 91% Two or more races 7% Hispanic / Latino 2%
- Common ancestry
- Italian 2% Slovak 2% Lithuanian 2%
- Foreign-born
- 1%
- Languages at home
- 97% English-only · Spanish 1%
Political lean MEDSL · Callaway
- 2024 margin
- Solid R (+43.3) · D 27.6% · R 70.9% · Other 1.5%
- 2008→2024 swing
- -23.6pp toward R · 2008: -19.7pp · 2024: -43.3pp
- All cycles
- 2024: R+43.3 2020: R+42.3 2016: R+42.2 2012: R+31.1 2008: R+19.7
Not yet ingested
- Civics
- —
Market trends
- HPI YoY
- ▼ -75.75%
- Current HPI
- 206.671
- Rent YoY
- —
- Metro
- —
- State GDP YoY
- ▲ 1.84%
- F500 in state
- 20
Industry mix (Fortune 500 HQ in MO)
| Industry | F500 HQs | Revenue |
|---|---|---|
| Healthcare | 1 | $163B |
|
||
| Insurance | 1 | $21B |
|
||
| Industrial Technology | 1 | $17B |
|
||
| Retail | 1 | $16B |
|
||
| Industrial Distribution | 1 | $10B |
|
||
| Utilities | 1 | $9B |
|
||
Price history
3 events — show timeline
- 2026-05-22 Listed $120,000 CBORMLS
- 2022-05-16 Sold (Public Records) — Public Records
- 1988-06-13 Sold (Public Records) — Public Records
Property tax history
+3.4%/yrLatest (2025): $509 · +0.3% YoY. Source: county tax records.
Cash-flow waterfall
monthlySold comps — $/sqft
last 12 mo · ≤1 miLoading sold comps…