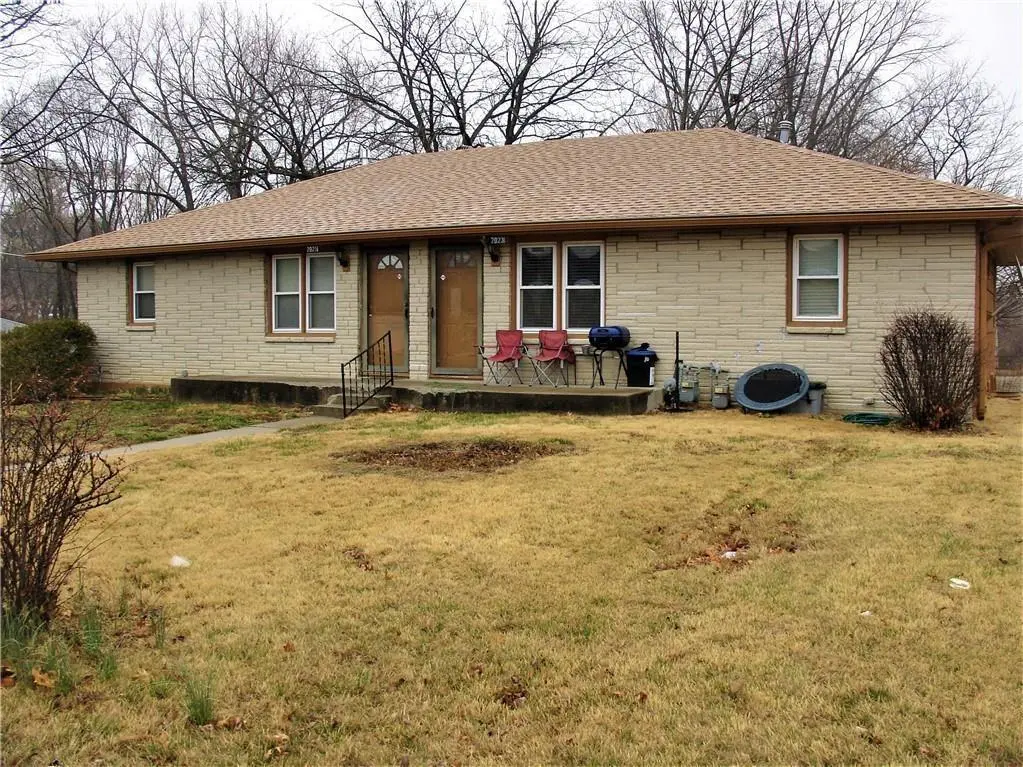
 Duplex
2023-2025 N 81 St · Kansas City, KS
Flood risk 1/10 · Minimal
- FEMA flood zone
- X (unshaded)
- Chance of flooding over 30 yrs
- 0.0%
- Est. flood insurance / yr
- $473 – $860
Fire risk 1/10 · Minimal
- Est. fire insurance / yr
- $1,154 – $2,142
Heat risk 4/10 · Minor
- Hot days now (above 108°F)
- 7 days/yr
- Hot days in 30 yrs
- 17 days/yr
Wind risk 2/10 · Minimal
- Chance of severe wind over 30 yrs
- —
Air-quality risk 2/10 · Minimal
- Unhealthy air days now
- 1 days/yr
- Unhealthy air days in 30 yrs
- 2 days/yr
Risk factors via First Street. Map © Google.
Why this score? — see what drove the C- grade
The composite is a weighted blend of 9 inputs, each scored 0–100. Each bar is that input's sub-score; the figure is the points it added to the 100-point composite (weight × sub-score).
- Cash flow +21.3/30.0
- ARV discount +7.5/15.0
- DSCR +6.8/10.0
- 1% rule +5.7/10.0
- Livability +3.6/5.0
- Condition / age +2.5/5.0
- Rent growth +2.1/5.0
- Schools +0.9/10.0
- Appreciation +0.0/10.0
$249,950
🖨 Deal sheet 📄 Offer letter ✓ Due diligence
Multi-family units
County records classify this as Multi-Family (2-4 Unit). Listing-text estimate: 2 units. confirmed
Listing remarks MLS
Opportunity knocks to purchase a full duplex in an ideal location. 2 beds, 1 bath in each side with dedicated 1 car garage for each unit~full basements.
Key facts
- Full basm't
- Upgraded electrical
- Full duplex
Tags
Property features AI
Finance
- Financial info: Annual tax amount reported
- HOA & community: No association fees; No maintenance provided
Exterior
- Parking: Off-street paved parking for 4 vehicles; Includes garage
- Utilities: Public water; Public sewer; Other utilities
- Home design: Residential income property (duplex); Single-story
- Construction: Brick veneer and frame construction; Composition roof
- Exterior features: Not located in a flood plain; Lot approximately 0.28 acres (public records)
Interior
- Bedrooms: Multiple units with 2-bedroom unit types
- Bathrooms: Units with 1 bathroom
- Heating & cooling: Forced air heating; Electric cooling
- Interior features: Basement present; Operating expenses include real estate tax
Neighborhood map
What this means for you Summary
Snapshot
- This is a 2 × 2-bed/1.0-bath units multifamily listed at $250k.
Deal economics
- At list price, monthly cash flow is $365 ($4k/yr) — positive. Per door: $182/mo.
- The deal already cash-flows at list — no discount required.
- Meets the 1% rule at list price ($3k rent vs $250k).
- Cap rate 8.0% vs local median 4.8% in Kansas City — top-decile yield for the area; either an underpriced asset or a hidden risk that comps aren't pricing in. Stress-test before assuming the spread holds.
Location & tenants
- Location reads 72/100 on livability (#103 in KS) — a middle-class / working-renter tenant base. Strengths: commute A+, cost of living A+, housing A+; Watch: schools F, crime F, employment D-.
- Kansas City (urban): math 8% / reading 15% proficiency, ranked #169 of 169 in KS (top 100%) — low school quality limits family demand, transient renter base, plan for 1-2y turnover; 81% free/reduced lunch — lower-income household profile, screen leases tightly.
- Market conditions: Rents soft (-1.8%/yr); 236 active listings in the ZIP; 2 comparable units currently listed for rent nearby; solid renter incomes; 369 units permitted in Wyandotte County in 2024 (236 in 5+ unit buildings).
- This rent runs 31% of the median local income ($103k/yr) — at the standard rent-burdened threshold; future hikes will face affordability resistance.
Forward outlook
- Local home prices are declining (-3.0%/yr); year-one equity from $2k of loan paydown is wiped out by about $7k of value loss. Plan a longer hold.
- Wyandotte County population projected at +17% by 2050 — long-run rental-demand tailwind backs the buy-and-hold thesis.
Negotiation context
- Only 3 days on market — expect competitive offers; lowballing is unlikely to land.
- 3 sale attempts since 27y ago with the ask held roughly flat each time — persistent listings suggest the price (not the market) is what's stuck; bring a comps-based counter.
- Current owner paid $70k; list at $250k implies a 255% gain — meaningful room to come down on a strong offer.
Questions for the listing agent
- Can we see the unit-by-unit rent roll, current vacancy, and any below-market leases? What's the average tenancy length?
- What capital expenditures (roof, boiler, parking lot, exteriors) have been made in the last 5 years, and what's planned in the next 2?
- Built in 1969 — when were the roof, HVAC, electrical panel, plumbing, and water heater last replaced?
- Is there a deadline driving the sale (1031 exchange, divorce, estate, relocation)? That informs how much negotiation room exists.
- Schools are F-rated, which usually means shorter tenancies and higher turnover. Who's the typical renter profile here, and what's been the actual vacancy rate?
- Crime grade is F in this area — have there been break-ins, vandalism, or insurance claims at this property in the last 3 years? What carrier currently insures it and at what premium?
- What's the average days-on-market for RENTAL listings here right now (not sales)? A rising rental-DOM trend means longer vacancies and softer asking-rent achievability than the comps imply.
- What's the recent tenant-quality profile in this submarket — average credit score on applications, eviction rate, late-payment / NSF rate, and stable-employment percentage? A property-management company in the area should have these aggregated.
- How much new apartment / multifamily construction is in the pipeline within 1–3 miles? Heavy new supply (>2% of stock underway) typically softens rents 12–24 months out; light construction supports rent growth.
Investment metrics
- 1% rule
- 1.07% ✓
- Cap rate
- 8.04%
- Cash-on-cash
- 6.25%
- DSCR
- 1.28
- GRM
- 7.8
CMA / ARV
No comps found within radius.
Projected returns pro-forma
-3.0% appreciation · 0.0% rent growth · sell at horizon
- IRR
- -10.1%
- Equity multiple
- 0.64×
- Total profit
- $-25,086
- Equity at exit
- $37,268
- IRR
- -5.6%
- Equity multiple
- 0.68×
- Total profit
- $-22,096
- Equity at exit
- $21,611
Cash invested: $69,986 (down + closing). Projections, not guarantees.
Landlord ↔ Tenant lean methodology
- Overall (STATE)
- 83 Strongly Landlord-Friendly
- State Kansas
- 83 Strongly Landlord-Friendly · R+10
- County
- — inherits STATE
- City
- — inherits STATE
ZIP-level market 66109
- Rents YoY
- -1.8%
- Active inventory
- 236
- Price-to-rent
- 15.5×
Monthly cashflow live
- Estimated rent
- $2,683 medium interval (Pro) →
- Mortgage (P&I)
- −$1,311
- Tax from tax record
- −$340 /mo · $4,081/yr
- Insurance
- −$104
- HOA
- −$0
- Vacancy / Maint / Mgmt
- −$563
- Net cashflow
- $365
Break-even live
2-unit breakdown (identical units grouped — click to expand)
| Units | Beds | Baths | Est. rent |
|---|---|---|---|
| 2× units | 2 | 1 | $2,684 |
| #1 | 2 | 1 | $1,342 |
| #2 | 2 | 1 | $1,342 |
| Total (2 units) | $2,683 | ||
UW: 25.0% down · 7.5% · 30yr · 1.5% tax · 5.0% vac · 8.0% maint · 8.0% mgmt
Financing live
Cash to close
- Down payment
- $62,488
- Closing costs
- $7,498
- Reserves months
- —
- Total cash needed
- —
Loan-product check · same deal, 3 products live
Conventional
25% down · 7.5% · 30yr
- Down + closing
- —
- Monthly P&I
- —
- Monthly cashflow
- —
- DSCR
- —
- Eligible?
- —
Personal DTI + credit; lowest rate.
DSCR
20% down · 8.5% · 30yr
- Down + closing
- —
- Monthly P&I
- —
- Monthly cashflow
- —
- DSCR
- —
- Eligible?
- —
No personal income docs; deal must DSCR.
Hard money
10% down · 12.0% · 12mo
- Down + closing
- —
- Monthly P&I
- —
- Monthly cashflow
- —
- DSCR
- —
- Eligible?
- —
Short-term bridge; refi at stabilization.
Rent comps 2 comps
| Address | Beds | Baths | Sqft | Rent | $/sqft | DOM | Units | Dist |
|---|---|---|---|---|---|---|---|---|
| 2209 N 82nd Ter Kansas City, KS | 3.0 | 3.0 | 1190 | $2,100 | $1.76 | 4d | 1 | 0.21mi |
| 1500 N 74th St Kansas City, KS | 3.0–4.0 | 2.0 | 1250 | $2,100 | $1.68 | 1d | 1 | 0.91mi |
Listing history 8 events
-
2026-04-30status Pending
-
2026-04-27$249,950 Active
-
2023-04-12soldstatus Closed 152-char remark
Show marketing remark (152 chars)
Opportunity knocks to purchase a full duplex in an ideal location. 2 beds, 1 bath in each side with dedicated 1 car garage for each unit~full basements.
-
2023-03-13status Pending 152-char remark
Show marketing remark (152 chars)
Opportunity knocks to purchase a full duplex in an ideal location. 2 beds, 1 bath in each side with dedicated 1 car garage for each unit~full basements.
-
2023-03-10$217,500 Active 152-char remark
Show marketing remark (152 chars)
Opportunity knocks to purchase a full duplex in an ideal location. 2 beds, 1 bath in each side with dedicated 1 car garage for each unit~full basements.
-
1999-09-27soldstatus 236-char remark
Show marketing remark (236 chars)
Property Offered "As Is" For Information On Bidding Procedures, Earnest Money And Other Policies, Contact Www. Firstprston. Com Universal Key Or Hud Lockbox * The Address Of This Property Is 2023 - 25 N 81st St Insured
-
1999-08-01soldstatus $70,500
-
1999-07-30$58,000 236-char remark
Show marketing remark (236 chars)
Property Offered "As Is" For Information On Bidding Procedures, Earnest Money And Other Policies, Contact Www. Firstprston. Com Universal Key Or Hud Lockbox * The Address Of This Property Is 2023 - 25 N 81st St Insured
ⓘ Source: listings_history table (triggers on properties + properties_extension) + one-shot
backfill from property_details.listing_events for pre-trigger history.
Tax reassessment forecast KS · Resets to sale price
- Current annual tax
- $4,081 · $340/mo
- Projected year-2 tax
- $4,081 · $340/mo
- Expected delta
- $0/yr ($0/mo · 0.0%)
ⓘ Screening estimate from a state-policy table — verify with the county assessor before closing.
Climate risk First Street
- Flood 1/10 Low FEMA zone X (unshaded) · 0% chance over 30 yrs
- Wildfire 1/10 Low
- Heat 4/10 Moderate 7 d/yr ≥108°F today · 17 d/yr by 30 yrs out
- Wind 2/10 Low
- Air quality 2/10 Low 1 unhealthy d/yr today · 2 by 30 yrs out
Nearby sold comps map
Loading sold comps map…
Walkable amenities ~0.75 mi
Loading nearby amenities…
Taxation est. · year 1
- Rental income
- $32,196
- − Mortgage interest
- −$14,001
- − Property taxes
- −$4,081
- − Insurance
- −$1,250
- − Repairs & maintenance
- −$2,576
- − Management
- −$2,576
- − Depreciation
- −$7,271
- Taxable income
- $442
- Est. tax owed @ 24.0%
- −$106
- After-tax cash flow
- $4,269/yr
For passive investors: Depreciation is non-cash, so a rental often shows a tax loss while cash-flowing — sheltering income. Rental losses are passive: they offset passive income freely, and up to $25,000/yr can offset ordinary (W-2) income if you actively participate and your MAGI is under $100k (phasing out to $0 by $150k); unused losses carry forward. On sale, claimed depreciation is recaptured at up to 25%, and gains may owe capital-gains tax (a 1031 exchange can defer both). Figures are a year-1 estimate at your 24.0% rate — not tax advice; consult a CPA.
Schools (NCES district)
- District
- Kansas City
- NCES district ID
- 2007950
- Math proficiency
- 8% ▼ -10.00%
- Reading proficiency
- 15% ▼ -4.00%
- Median HH income
- $34,774
- Composite
- 9.38/100
- National rank
- #9856
- State rank
- #169 of 169 in KS
Livability — Kansas City
- Score
- 72/100
- State rank
- #103
- US rank
- #6054
Category grades
Schools grade is shown separately in the Schools card above.
Census & demographics
- Census place
- Kansas City, KS
- County
- Wyandotte County · 130,206 people
- City population
- 130,206
- Metro
- Kansas City, MO-KS
- Population (ZIP)
- 28,355
- Household income
- $102,593
- Rent vs Own
- Severe rent burden
- 285.0
Population outlook (Wyandotte County) Hauer SSP2
- Today (2025)
- 177,063 people
- By 2030
- 183,212 · +3.5%
- By 2040
- 195,697 · +10.5%
- By 2050
- 207,897 · +17.4%
- By 2075
- 236,169 · +33.4%
- By 2100
- 255,790 · +44.5%
Race, ethnicity, and origin ACS 2023
- Neighborhood character
- Diverse neighborhood (Simpson 0.64)
- Race & ethnicity
- White 55% Black 18% Hispanic / Latino 13% Two or more races 13% Asian 7%
- Hispanic origin (detail)
- Mexican 11%
- Common ancestry
- Italian 2% Lithuanian 2% Romanian 2%
- Foreign-born
- 9% · Canada, Philippines, China
- Languages at home
- 88% English-only · Spanish 5% Other Asian/Pacific 5% Vietnamese 1%
Political lean MEDSL · Wyandotte
- 2024 margin
- Strong D (+23.9) · D 61.1% · R 37.3% · Other 1.6%
- 2008→2024 swing
- -17.0pp toward R · 2008: 40.9pp · 2024: 23.9pp
- All cycles
- 2024: D+23.9 2020: D+30.9 2016: D+29.1 2012: D+36.4 2008: D+40.9
Not yet ingested
- Civics
- —
Market trends
- HPI YoY
- ▼ -242.32%
- Current HPI
- 182.7335
- Rent YoY
- ▼ -1.79%
- Metro
- Kansas City, MO-KS
- State GDP YoY
- —
- F500 in state
- 0
Price history
+330.9% since first listed8 events — show timeline
- 2026-04-30 Pending — Heartland MLS as Distributed by MLS Grid
- 2026-04-27 Listed $249,950 Heartland MLS as Distributed by MLS Grid
- 2023-04-12 Sold (MLS) — Heartland MLS as Distributed by MLS Grid
- 2023-03-13 Pending — Heartland MLS as Distributed by MLS Grid
- 2023-03-10 Listed $217,500 Heartland MLS as Distributed by MLS Grid
- 1999-09-27 Sold (MLS) — Heartland MLS as Distributed by MLS Grid
- 1999-08-01 Sold (Public Records) $70,500 Public Records
- 1999-07-30 Listed $58,000 Heartland MLS as Distributed by MLS Grid
Property tax history
+8.8%/yrLatest (2025): $4,081 · +8.5% YoY. Source: county tax records.
Cash-flow waterfall
monthlySold comps — $/sqft
last 12 mo · ≤1 miLoading sold comps…