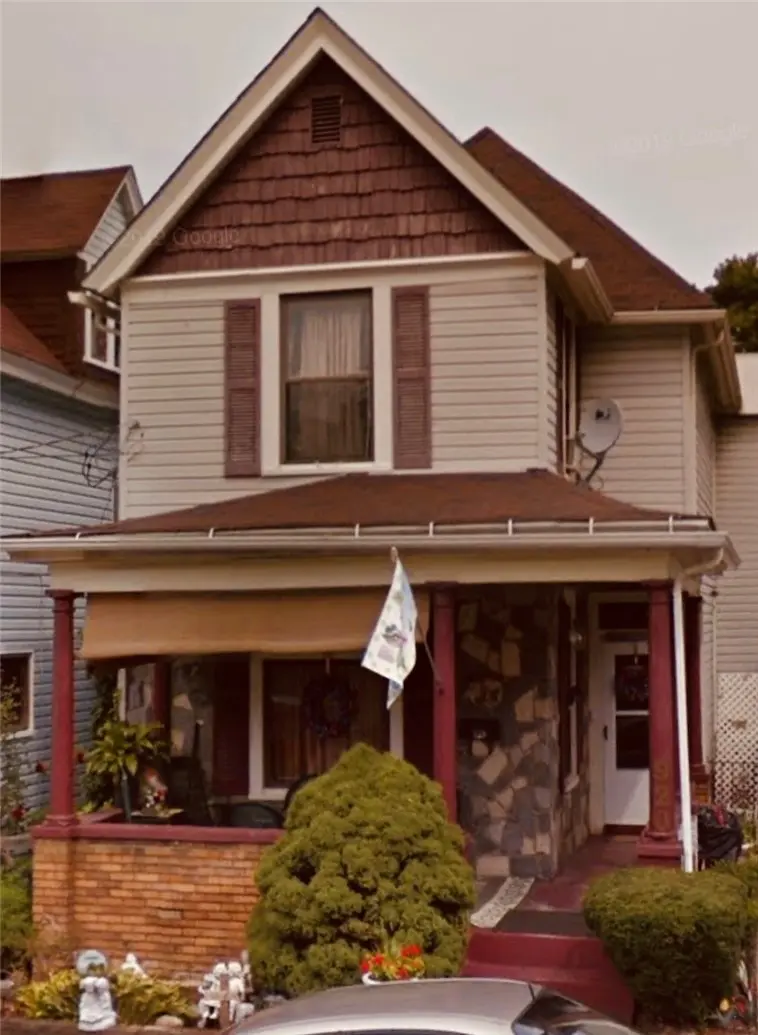
920 13th St · Beaver Falls, PA
Flood risk 1/10 · Minimal
- FEMA flood zone
- X (unshaded)
- Chance of flooding over 30 yrs
- 0.0%
- Est. flood insurance / yr
- $473 – $860
Fire risk 1/10 · Minimal
- Est. fire insurance / yr
- $511 – $949
Heat risk 4/10 · Minor
- Hot days now (above 97°F)
- 7 days/yr
- Hot days in 30 yrs
- 18 days/yr
Wind risk 2/10 · Minimal
- Chance of severe wind over 30 yrs
- 0.0%
Air-quality risk 3/10 · Minor
- Unhealthy air days now
- 2 days/yr
- Unhealthy air days in 30 yrs
- 4 days/yr
Risk factors via First Street. Map © Google.
Why this score? — see what drove the B- grade
The composite is a weighted blend of 9 inputs, each scored 0–100. Each bar is that input's sub-score; the figure is the points it added to the 100-point composite (weight × sub-score).
- Cash flow +28.3/30.0
- ARV discount +10.2/15.0
- DSCR +10.0/10.0
- 1% rule +7.9/10.0
- Livability +4.2/5.0
- Rent growth +3.3/5.0
- Condition / age +2.5/5.0
- Schools +2.2/10.0
- Appreciation +0.0/10.0
$95,000
🖨 Deal sheet (PDF) 📄 Offer letter ✓ Due diligence
Listing remarks MLS
SOLD AS IS. ADDENDUM TO ACCOMPANY ANY OFFER, QUIET STREET, FRONT PORCH, STONE CONSTRUCTION SELLER ANXIOUS TO SELL
Key facts
- Tenant in place
- Stable rental income
- Dining
Tags
Property features AI
Exterior
- Parking: On-street parking
- Utilities: Public water; Public sewer
- Home design: Resale property
- Construction: Asphalt roof
- Exterior features: Public water; Public sewer
Interior
- Bathrooms: 1 full bathroom
- Heating & cooling: Forced air heating (gas)
- Interior features: Has an unfinished interior-entry basement
Neighborhood map
What this means for you Summary
Snapshot
- This is a 2-bed/1.0-bath single-family listed at $95k.
Deal economics
- At list price, monthly cash flow is $304 ($4k/yr) — positive.
- The deal already cash-flows at list — no discount required.
- Meets the 1% rule at list price ($1k rent vs $95k).
Location & tenants
- Location reads 84/100 on livability (#93 in PA, #675 nationally) — a professional / high-income tenant draw. Strengths: commute A+, cost of living A+, housing A+; Watch: amenities F, employment F.
- Big Beaver Falls Area SD (suburban): math 16% / reading 37% proficiency, ranked #467 of 539 in PA (top 87%) — low school quality limits family demand, transient renter base, plan for 1-2y turnover; 66% free/reduced lunch — lower-income household profile, screen leases tightly.
- Market conditions: Rents rising (+3.1%/yr); 143 active listings in the ZIP; 4 comparable units currently listed for rent nearby; rentals at typical pace (median 15d on market — plan ~3-4 weeks tenant-placement turnaround); 272 units permitted in Beaver County in 2024 (80 in 5+ unit buildings).
Forward outlook
- Local home prices are declining (-3.0%/yr); year-one equity from $657 of loan paydown is wiped out by about $3k of value loss. Plan a longer hold.
- Beaver County population projected at -14% by 2050 — secular population decline; favor cash flow + early exit over multi-decade hold.
- At projected returns (-3.0% appreciation + 3.1% rent growth), your $27k cash investment doubles in ~9 years — after that, you're playing with house money.
Negotiation context
- Only 7 days on market — expect competitive offers; lowballing is unlikely to land.
- 2 sale attempts since 23y ago with the ask held roughly flat each time — persistent listings suggest the price (not the market) is what's stuck; bring a comps-based counter.
- Current owner paid $12k; list at $95k implies a 660% gain — meaningful room to come down on a strong offer.
Risks & watch-outs
- Watch-outs: built in 1910 — expect roof / HVAC / electrical / plumbing capex.
Questions for the listing agent
- Built in 1910 — when were the roof, HVAC, electrical panel, plumbing, and water heater last replaced?
- Is there a deadline driving the sale (1031 exchange, divorce, estate, relocation)? That informs how much negotiation room exists.
- Schools are B-rated — typically a magnet for longer-tenancy family renters. What's the average tenant stay here, and is there a school-zone premium baked into asking?
- What's the average days-on-market for RENTAL listings here right now (not sales)? A rising rental-DOM trend means longer vacancies and softer asking-rent achievability than the comps imply.
- What's the recent tenant-quality profile in this submarket — average credit score on applications, eviction rate, late-payment / NSF rate, and stable-employment percentage? A property-management company in the area should have these aggregated.
- How much new for-sale + rental construction is in the pipeline within 1–3 miles? Heavy new supply typically softens prices + rents 12–24 months out; constrained supply supports both.
Investment metrics
- 1% rule
- 1.29% ✓
- Cap rate
- 10.13%
- Cash-on-cash
- 13.70%
- DSCR
- 1.61
- GRM
- 6.4
CMA / ARV
- ARV (on-the-fly)
- $100,980
- Comps found
- 12
Show comp detail 12 sales within ~0.75 mi
| Address | Dist | Beds/Ba | Sqft | Sold | Price | $/sf | Match |
|---|---|---|---|---|---|---|---|
| 1608 6th Ave | 0.35mi | 3/1.0 (+1) | 1,560 (+2%) | 11mo | $64,000 | $41 | 66 |
| 1815 4th Ave | 0.51mi | 3/2.0 (+1) | 1,504 (-2%) | 7mo | $75,000 | $50 | 58 |
| 203 Short 10th St | 0.57mi | 3/1.0 (+1) | 1,594 (+4%) | 4mo | $30,000 | $19 | 58 |
| 812 2nd Ave | 0.55mi | 3/2.0 (+1) | 1,496 (-2%) | 6mo | $22,000 | $15 | 57 |
| 824 2nd | 0.55mi | 3/1.5 (+1) | 1,527 (-0%) | 13mo | $144,100 | $94 | 56 |
| 1210 2nd Ave | 0.55mi | 3/1.0 (+1) | 1,624 (+6%) | 9mo | $106,550 | $66 | 52 |
| 1319 5th Ave | 0.32mi | 3/2.0 (+1) | 1,717 (+12%) | 6mo | $80,000 | $47 | 50 |
| 2201 13th St | 0.75mi | 3/2.0 (+1) | 1,536 (+0%) | 6mo | $225,000 | $146 | 50 |
| 1321 24th St | 0.71mi | 3/1.5 (+1) | 1,488 (-3%) | 10mo | $240,000 | $161 | 47 |
| 516 17th St | 0.40mi | 3/3.0 (+1) | 1,332 (-13%) | 6mo | $35,000 | $26 | 42 |
| 1526 20th Ave | 0.64mi | 3/2.0 (+1) | 1,352 (-12%) | 13mo | $165,000 | $122 | 31 |
| 522 18th Ave | 0.71mi | 3/2.0 (+1) | 1,306 (-15%) | 5mo | $125,000 | $96 | 29 |
Match score weights: distance 35% · size 25% · config 20% · recency 20%. Top-matched comps best support the ARV.
Projected returns pro-forma
-3.0% appreciation · 3.07% rent growth · sell at horizon
- IRR
- 3.9%
- Equity multiple
- 1.15×
- Total profit
- $4,058
- Equity at exit
- $14,165
- IRR
- 13.5%
- Equity multiple
- 2.09×
- Total profit
- $28,894
- Equity at exit
- $8,214
Cash invested: $26,600 (down + closing). Projections, not guarantees.
Landlord ↔ Tenant lean methodology
- Overall (STATE)
- 62 Landlord-Friendly
- State Pennsylvania
- 62 Landlord-Friendly · EVEN
- County
- — inherits STATE
- City
- — inherits STATE
ZIP-level market 15010
- Home prices YoY
- -22.6%
- Rents YoY
- 3.1%
- Active inventory
- 143
- Price-to-rent
- 6.4×
Monthly cashflow live
- Estimated rent
- $1,228 medium interval (Pro) →
- Mortgage (P&I)
- −$498
- Tax from tax record
- −$129 /mo · $1,548/yr
- Insurance
- −$40
- HOA
- −$0
- Vacancy / Maint / Mgmt
- −$258
- Net cashflow
- $304
Break-even live
Sensitivity live
| Price | -10% $357 | -5% $331 | +0% $304 | +5% $277 | +10% $250 |
|---|---|---|---|---|---|
| Rent | -10% $207 | -5% $255 | +0% $304 | +5% $352 | +10% $401 |
| Rate | -1.0pp $352 | -0.5pp $328 | base $304 | +0.5pp $279 | +1.0pp $254 |
UW: 25.0% down · 7.5% · 30yr · 1.5% tax · 5.0% vac · 8.0% maint · 8.0% mgmt
Financing live
Cash to close
- Down payment
- $23,750
- Closing costs
- $2,850
- Reserves months
- —
- Total cash needed
- —
Loan-product check · same deal, 3 products live
Conventional
25% down · 7.5% · 30yr
- Down + closing
- —
- Monthly P&I
- —
- Monthly cashflow
- —
- DSCR
- —
- Eligible?
- —
Personal DTI + credit; lowest rate.
DSCR
20% down · 8.5% · 30yr
- Down + closing
- —
- Monthly P&I
- —
- Monthly cashflow
- —
- DSCR
- —
- Eligible?
- —
No personal income docs; deal must DSCR.
Hard money
10% down · 12.0% · 12mo
- Down + closing
- —
- Monthly P&I
- —
- Monthly cashflow
- —
- DSCR
- —
- Eligible?
- —
Short-term bridge; refi at stabilization.
Rent comps 4 comps
| Address | Beds | Baths | Sqft | Rent | $/sqft | DOM | Units | Dist |
|---|---|---|---|---|---|---|---|---|
| 1503 3rd Ave Beaver Falls, PA | 3.0 | 1.0 | 1200 | $1,350 | $1.12 | 2d | 1 | 0.48mi |
| 1459 4th St New Brighton, PA | 3.0 | 2.0 | 1312 | $1,625 | $1.24 | 15d | 1 | 1.01mi |
| 149 Colonial Oaks Beaver Falls, PA | 2.0–4.0 | 1.0–1.5 | 958 | $1,200 | $1.25 | 2d | 1 | 1.31mi |
| 904 Penn Ave Unit 1 New Brighton, PA | 2.0 | 1.0 | 1300 | $995 | $0.77 | 18d | 1 | 1.48mi |
Listing history 7 events
-
2026-06-18days on market $95,000 Active 7 DOM
-
2026-06-17days on market $95,000 Active 6 DOM
-
2026-06-16days on market $95,000 Active 5 DOM
-
2026-06-15days on market $95,000 Active 4 DOM
-
2026-06-13days on market $95,000 Active 2 DOM
-
2026-06-13remarks 405-char remark
-
2026-06-13$95,000 Active 1 DOM
ⓘ Source: listings_history table (triggers on properties + properties_extension) + one-shot
backfill from property_details.listing_events for pre-trigger history.
Tax reassessment forecast PA · Partial reset (capped growth)
- Current annual tax
- $1,548 · $129/mo
- Projected year-2 tax
- $1,548 · $129/mo
- Expected delta
- $0/yr ($0/mo · -0.0%)
ⓘ Screening estimate from a state-policy table — verify with the county assessor before closing.
Climate risk First Street
- Flood 1/10 Low FEMA zone X (unshaded) · 0% chance over 30 yrs
- Wildfire 1/10 Low
- Heat 4/10 Moderate 7 d/yr ≥97°F today · 18 d/yr by 30 yrs out
- Wind 2/10 Low 0% chance of damaging wind over 30 yrs
- Air quality 3/10 Moderate 2 unhealthy d/yr today · 4 by 30 yrs out
Nearby sold comps map
Loading sold comps map…
Walkable amenities ~0.75 mi
Loading nearby amenities…
Taxation est. · year 1
- Rental income
- $14,740
- − Mortgage interest
- −$5,321
- − Property taxes
- −$1,548
- − Insurance
- −$475
- − Repairs & maintenance
- −$1,179
- − Management
- −$1,179
- − Depreciation
- −$2,764
- Taxable income
- $2,274
- Est. tax owed @ 24.0%
- −$546
- After-tax cash flow
- $3,098/yr
For passive investors: Depreciation is non-cash, so a rental often shows a tax loss while cash-flowing — sheltering income. Rental losses are passive: they offset passive income freely, and up to $25,000/yr can offset ordinary (W-2) income if you actively participate and your MAGI is under $100k (phasing out to $0 by $150k); unused losses carry forward. On sale, claimed depreciation is recaptured at up to 25%, and gains may owe capital-gains tax (a 1031 exchange can defer both). Figures are a year-1 estimate at your 24.0% rate — not tax advice; consult a CPA.
Schools (NCES district)
- District
- Big Beaver Falls Area SD
- NCES district ID
- 4203630
- Math proficiency
- 16% ▼ -11.00%
- Reading proficiency
- 37% ▼ -15.00%
- Median HH income
- $35,686
- Composite
- 21.85/100
- National rank
- #8241
- State rank
- #467 of 539 in PA
Livability — Beaver Falls
- Score
- 84/100
- State rank
- #93
- US rank
- #675
Category grades
Schools grade is shown separately in the Schools card above.
Census & demographics
- Census place
- Beaver Falls, PA
- County
- Beaver County · 116,001 people
- City population
- 28,542
- Metro
- Pittsburgh, PA
- Population (ZIP)
- 28,542
- Household income
- $71,200
- Rent vs Own
- Severe rent burden
- 519.0
Population outlook (Beaver County) Hauer SSP2
- Today (2025)
- 164,976 people
- By 2030
- 161,449 · -2.1%
- By 2040
- 151,752 · -8.0%
- By 2050
- 141,155 · -14.4%
- By 2075
- 118,142 · -28.4%
- By 2100
- 91,740 · -44.4%
Race, ethnicity, and origin ACS 2023
- Neighborhood character
- Predominantly White (85%)
- Race & ethnicity
- White 85% Black 9% Two or more races 4% Hispanic / Latino 1%
- Common ancestry
- Romanian 5% Slovak 2% Iranian 1%
- Foreign-born
- 2% · Canada
- Languages at home
- 98% English-only · Spanish 1%
Political lean MEDSL · Beaver
- 2024 margin
- Strong R (+20.7) · D 39.2% · R 59.9%
- 2008→2024 swing
- -17.9pp toward R · 2008: -2.8pp · 2024: -20.7pp
- All cycles
- 2024: R+20.7 2020: R+17.7 2016: R+20.1 2012: R+6.6 2008: R+2.8
Not yet ingested
- Civics
- —
Market trends
- HPI YoY
- ▼ -76.25%
- Current HPI
- 261.2703
- Rent YoY
- ▲ 3.07%
- Metro
- Pittsburgh, PA
- State GDP YoY
- ▲ 1.68%
- F500 in state
- 34
Industry mix (Fortune 500 HQ in PA)
| Industry | F500 HQs | Revenue |
|---|---|---|
| Healthcare | 2 | $309B |
|
||
| Insurance | 2 | $27B |
|
||
| Telecommunications / Media | 1 | $124B |
|
||
| Industrial Distribution | 1 | $22B |
|
||
| Financial Services | 1 | $20B |
|
||
| Chemicals / Materials | 1 | $18B |
|
||
Price history
+138.1% since first listed5 events — show timeline
- 2026-05-29 Listed $95,000 West Penn MLS
- 2004-01-23 Sold (MLS) $12,500 West Penn MLS
- 2004-01-20 Sold (Public Records) $12,500 Public Records
- 2003-10-17 Listed $24,900 West Penn MLS
- 1993-07-01 Sold (Public Records) $39,900 Public Records
Property tax history
+0.9%/yrLatest (2026): $1,548 · +0.0% YoY. Source: county tax records.
Cash-flow waterfall
monthlySold comps — $/sqft
last 12 mo · ≤1 miLoading sold comps…