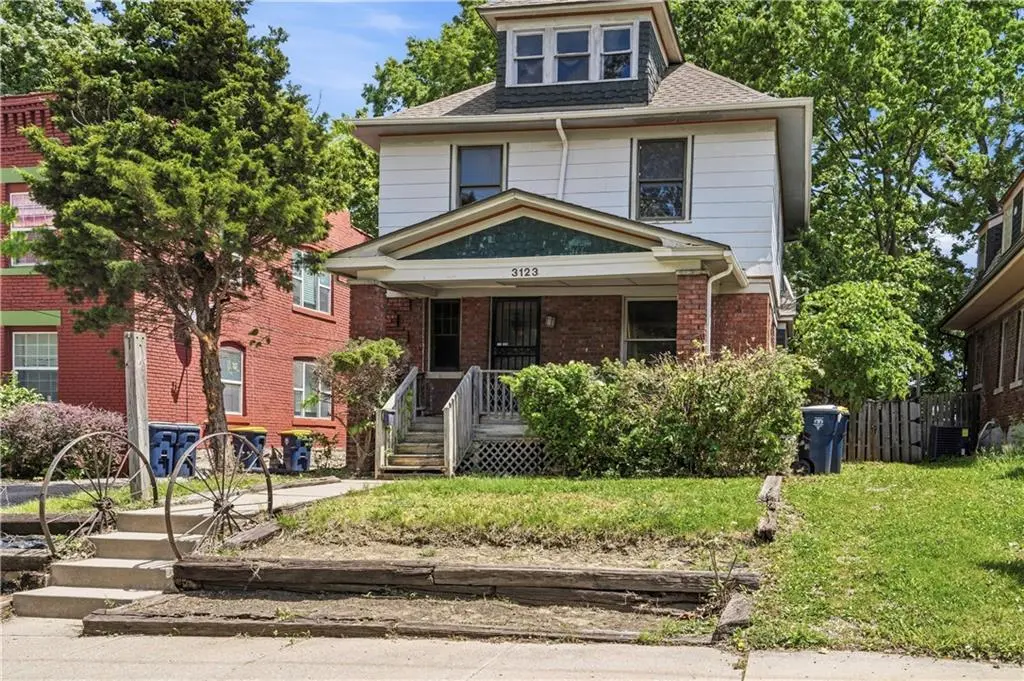
3123 Central St · Kansas City, MO
Flood risk 1/10 · Minimal
- FEMA flood zone
- X (unshaded)
- Chance of flooding over 30 yrs
- 0.0%
- Est. flood insurance / yr
- $473 – $860
Fire risk 1/10 · Minimal
- Est. fire insurance / yr
- $1,054 – $1,958
Heat risk 4/10 · Minor
- Hot days now (above 106°F)
- 7 days/yr
- Hot days in 30 yrs
- 17 days/yr
Wind risk 2/10 · Minimal
- Chance of severe wind over 30 yrs
- —
Air-quality risk 3/10 · Minor
- Unhealthy air days now
- 2 days/yr
- Unhealthy air days in 30 yrs
- 3 days/yr
Risk factors via First Street. Map © Google.
Why this score? — see what drove the C- grade
The composite is a weighted blend of 9 inputs, each scored 0–100. Each bar is that input's sub-score; the figure is the points it added to the 100-point composite (weight × sub-score).
- Cash flow +21.7/30.0
- ARV discount +7.5/15.0
- DSCR +6.9/10.0
- 1% rule +6.5/10.0
- Livability +3.9/5.0
- Rent growth +3.4/5.0
- Condition / age +2.5/5.0
- Schools +1.5/10.0
- Appreciation +0.0/10.0
$159,000
🖨 Deal sheet 📄 Offer letter ✓ Due diligence
Listing remarks MLS
Corporate Owned - Call for Addendums. Earnest Deposit must be Certified Funds. Pre-Approval or Proof Funds required.
Key facts
- 4,718 sq ft lot
- Built 1907
Property features AI
Finance
- Other: Above-grade finished area reported (value withheld per instructions)
- Financial info: Annual tax amount listed (amount withheld per instructions)
Exterior
- Parking: Off-street parking
- Security: Smoke detector(s)
- Utilities: Public water; Public sewer; High-speed internet available
- Home design: Single-family residence; Residential property; 2 stories; Approximately 101+ years old; Facing direction not provided
- Construction: Brick trim construction; Composition roof; Full basement (stone/rock)
- Exterior features: Deck; Porch; Metal and wood fencing; City lot; Property listed as fixer
Interior
- Kitchen: Gas range; Refrigerator
- Bedrooms: 3 bedrooms (all on second level); Bedroom sizes include 15' x 12', 10' x 9', and 13' x 12'
- Flooring: Vinyl; Wood
- Bathrooms: 1 full bath; 1 half bath
- Heating & cooling: Forced air heating; Electric cooling
- Interior features: Smart thermostat; Smoke detector(s); Fireplace; Full stone/rock basement
- Laundry & utility: Washer and dryer; Laundry located in basement
Neighborhood map
What this means for you Summary
Snapshot
- This is a 3-bed/1.0-bath single-family listed at $159k.
Deal economics
- At list price, monthly cash flow is $246 ($3k/yr) — positive.
- The deal already cash-flows at list — no discount required.
- Meets the 1% rule at list price ($2k rent vs $159k).
- Cap rate 8.1% vs local median 3.9% in Kansas City — top-decile yield for the area; either an underpriced asset or a hidden risk that comps aren't pricing in. Stress-test before assuming the spread holds.
Location & tenants
- Location reads 78/100 on livability (#28 in MO, #2,671 nationally) — a middle-class / working-renter tenant base. Strengths: amenities A+, commute A+, cost of living A+; Watch: schools C-, crime F.
- Kansas City 33 (urban): math 12% / reading 24% proficiency, ranked #308 of 324 in MO (top 95%) — low school quality limits family demand, transient renter base, plan for 1-2y turnover; 75% free/reduced lunch — lower-income household profile, screen leases tightly.
- Market conditions: Rents rising (+3.4%/yr); 162 active listings in the ZIP; 40 comparable units currently listed for rent nearby; rentals at typical pace (median 17d on market — plan ~3-4 weeks tenant-placement turnaround); 4,002 units permitted in Jackson County in 2024 (2,271 in 5+ unit buildings).
- This rent runs 36% of the median local income ($62k/yr) — at the standard rent-burdened threshold; future hikes will face affordability resistance.
Forward outlook
- Local home prices are declining (-3.0%/yr); year-one equity from $1k of loan paydown is wiped out by about $5k of value loss. Plan a longer hold.
- Jackson County population projected at +4% by 2050 — modest demand growth; plan on rents tracking national, not racing it.
Negotiation context
- Only 1 days on market — expect competitive offers; lowballing is unlikely to land.
- 2 sale attempts since 20y ago with the ask held roughly flat each time — persistent listings suggest the price (not the market) is what's stuck; bring a comps-based counter.
Risks & watch-outs
- Watch-outs: built in 1907 — expect roof / HVAC / electrical / plumbing capex.
Questions for the listing agent
- Built in 1907 — when were the roof, HVAC, electrical panel, plumbing, and water heater last replaced?
- Is there a deadline driving the sale (1031 exchange, divorce, estate, relocation)? That informs how much negotiation room exists.
- Crime grade is F in this area — have there been break-ins, vandalism, or insurance claims at this property in the last 3 years? What carrier currently insures it and at what premium?
- What's the average days-on-market for RENTAL listings here right now (not sales)? A rising rental-DOM trend means longer vacancies and softer asking-rent achievability than the comps imply.
- What's the recent tenant-quality profile in this submarket — average credit score on applications, eviction rate, late-payment / NSF rate, and stable-employment percentage? A property-management company in the area should have these aggregated.
- How much new for-sale + rental construction is in the pipeline within 1–3 miles? Heavy new supply typically softens prices + rents 12–24 months out; constrained supply supports both.
Investment metrics
- 1% rule
- 1.15% ✓
- Cap rate
- 8.15%
- Cash-on-cash
- 6.62%
- DSCR
- 1.29
- GRM
- 7.2
CMA / ARV
- ARV (median comp)
- $338,163
- List price
- $159,000
- Delta
- -52.98%
- Verdict
- UNDERPRICED
- Comps
- 20 within 1.0 mi
Show comp detail 12 sales within ~0.75 mi
| Address | Dist | Beds/Ba | Sqft | Sold | Price | $/sf | Match |
|---|---|---|---|---|---|---|---|
| 3123 Central St | 0.00mi | 3/1.5 | 1,406 (0%) | 1mo | $159,000 | $113 | 97 |
| 3129 Central St | 0.01mi | 3/1.5 | 1,453 (+3%) | 3mo | $175,000 | $120 | 90 |
| 3343 Baltimore Ave | 0.27mi | 3/1.5 | 1,452 (+3%) | 4mo | $175,000 | $121 | 76 |
| 3137 Mcgee St | 0.40mi | 3/1.0 | 1,379 (-2%) | 6mo | $329,900 | $239 | 72 |
| 3419 Central St | 0.36mi | 2/2.0 (-1) | 1,360 (-3%) | 5mo | $275,000 | $202 | 64 |
| 942 W 32nd Ter | 0.51mi | 3/1.5 | 1,398 (-1%) | 12mo | $389,000 | $278 | 63 |
| 3006 Jarboe St | 0.56mi | 3/2.0 | 1,440 (+2%) | 9mo | $163,900 | $114 | 58 |
| 940 W 34th St | 0.59mi | 3/1.0 | 1,330 (-5%) | 12mo | $280,000 | $211 | 53 |
| 1015 W 29th St | 0.58mi | 3/3.0 | 1,512 (+8%) | 2mo | $285,000 | $188 | 51 |
| 3405 Karnes Blvd | 0.50mi | 2/1.0 (-1) | 1,512 (+8%) | 12mo | $275,000 | $182 | 50 |
| 3409 Holmes St | 0.74mi | 3/1.5 | 1,349 (-4%) | 11mo | $285,000 | $211 | 47 |
| 948 W 32nd Ter | 0.54mi | 3/2.0 | 1,584 (+13%) | 8mo | $397,000 | $251 | 43 |
Match score weights: distance 35% · size 25% · config 20% · recency 20%. Top-matched comps best support the ARV.
Projected returns pro-forma
-3.0% appreciation · 3.42% rent growth · sell at horizon
- IRR
- -5.6%
- Equity multiple
- 0.79×
- Total profit
- $-9,252
- Equity at exit
- $23,707
- IRR
- 4.7%
- Equity multiple
- 1.35×
- Total profit
- $15,685
- Equity at exit
- $13,747
Cash invested: $44,520 (down + closing). Projections, not guarantees.
Landlord ↔ Tenant lean methodology
- Overall (STATE)
- 81 Strongly Landlord-Friendly
- State Missouri
- 81 Strongly Landlord-Friendly · R+10
- County
- — inherits STATE
- City
- — inherits STATE
ZIP-level market 64111
- Rents YoY
- 3.4%
- Active inventory
- 162
- Price-to-rent
- 7.2×
Monthly cashflow live
- Estimated rent
- $1,836 high interval (Pro) →
- Mortgage (P&I)
- −$834
- Tax from tax record
- −$304 /mo · $3,654/yr
- Insurance
- −$66
- HOA
- −$0
- Vacancy / Maint / Mgmt
- −$385
- Net cashflow
- $246
Break-even live
UW: 25.0% down · 7.5% · 30yr · 1.5% tax · 5.0% vac · 8.0% maint · 8.0% mgmt
Financing live
Cash to close
- Down payment
- $39,750
- Closing costs
- $4,770
- Reserves months
- —
- Total cash needed
- —
Loan-product check · same deal, 3 products live
Conventional
25% down · 7.5% · 30yr
- Down + closing
- —
- Monthly P&I
- —
- Monthly cashflow
- —
- DSCR
- —
- Eligible?
- —
Personal DTI + credit; lowest rate.
DSCR
20% down · 8.5% · 30yr
- Down + closing
- —
- Monthly P&I
- —
- Monthly cashflow
- —
- DSCR
- —
- Eligible?
- —
No personal income docs; deal must DSCR.
Hard money
10% down · 12.0% · 12mo
- Down + closing
- —
- Monthly P&I
- —
- Monthly cashflow
- —
- DSCR
- —
- Eligible?
- —
Short-term bridge; refi at stabilization.
Rent comps 40 comps
| Address | Beds | Baths | Sqft | Rent | $/sqft | DOM | Units | Dist |
|---|---|---|---|---|---|---|---|---|
| 3040 Baltimore Ave Kansas City, MO | 2.0 | 1.0–2.0 | 1363 | $5,999 | $4.40 | 2d | 75 | 0.17mi |
| 2980 Baltimore Ave Kansas City, MO | 2.0 | 2.0 | 1225 | $2,354 | $1.92 | 44d | 5 | 0.22mi |
| 218 W 34th St Kansas City, MO | 3.0 | 2.5 | 1300 | $1,859 | $1.43 | 14d | 1 | 0.28mi |
| 302 W 34th St Apt 1E Kansas City, MO | 2.0 | 1.0 | 950 | $1,195 | $1.26 | 7d | 1 | 0.28mi |
| 3420 Broadway Blvd Kansas City, MO | 1.0–3.0 | 1.0–2.0 | 1043 | $2,160 | $2.07 | 24d | 2 | 0.29mi |
| 118 W Armour Blvd Kansas City, MO | 1.0–3.0 | 1.0–2.0 | 934 | $2,110 | $2.26 | 14d | 5 | 0.41mi |
| 118 W Armour Blvd Kansas City, MO | 1.0–3.0 | 1.0–2.0 | 934 | $2,095 | $2.24 | 24d | 7 | 0.41mi |
| 3435 Main St Kansas City, MO | 2.0 | 1.0–2.0 | 659 | $1,695 | $2.57 | 2d | 12 | 0.43mi |
| 3435 Main St Kansas City, MO | 2.0 | 1.0–2.0 | 655 | $1,675 | $2.56 | 16d | 12 | 0.43mi |
| 211 W Armour Blvd Kansas City, MO | 2.0 | 1.0–2.0 | 816 | $2,050 | $2.51 | 2d | 20 | 0.44mi |
| 211 W Armour Blvd Kansas City, MO | 2.0 | 1.0–2.0 | 816 | $1,999 | $2.45 | 44d | 13 | 0.44mi |
| 128 E 29th St Kansas City, MO | 2.0 | 2.5 | 1375 | $2,749 | $2.00 | 44d | 1 | 0.45mi |
| 103 E 28 Ter Kansas City, MO | 2.0 | 2.0 | 980 | $1,979 | $2.02 | 44d | 1 | 0.46mi |
| 104 E 28 Ter Kansas City, MO | 1.0–2.0 | 1.0–2.5 | 1087 | $2,699 | $2.48 | 3d | 12 | 0.49mi |
| 310 E 34th St Kansas City, MO | 1.0–2.0 | 1.0 | 1009 | $1,375 | $1.36 | 44d | 1 | 0.52mi |
| 3560 Broadway Blvd Kansas City, MO | 2.0 | 1.0–2.0 | 680 | $1,560 | $2.29 | 16d | 26 | 0.52mi |
| 3560 Broadway Blvd Kansas City, MO | 2.0 | 1.0–2.0 | 727 | $1,880 | $2.59 | 2d | 35 | 0.52mi |
| 3100 Gillham Plz Kansas City, MO | 2.0 | 2.0 | 1141 | $1,195 | $1.05 | 4d | 1 | 0.53mi |
| 214 E Armour Blvd Kansas City, MO | 2.0 | 1.0–2.0 | 650 | $1,655 | $2.55 | 4d | 33 | 0.53mi |
| 214 E Armour Blvd Kansas City, MO | 2.0 | 1.0–2.0 | 688 | $1,655 | $2.40 | 16d | 30 | 0.53mi |
| 3408 Gillham Rd Kansas City, MO | 2.0 | 1.0 | 1180 | $1,499 | $1.27 | 44d | 1 | 0.53mi |
| 3130 Gillham Rd Unit 105 Kansas City, MO | 2.0 | 2.0 | 1141 | $1,195 | $1.05 | 7d | 1 | 0.58mi |
| 3436 Gillham Rd Kansas City, MO | 2.0 | 1.0 | 947 | $1,468 | $1.55 | 3d | 6 | 0.59mi |
| 3431 Gillham Rd Kansas City, MO | 2.0 | 1.0 | 947 | $1,464 | $1.55 | 44d | 6 | 0.60mi |
| 301 E Armour Blvd Kansas City, MO | 2.0 | 1.0–2.0 | 1023 | $2,050 | $2.00 | 2d | 9 | 0.60mi |
| 301 E Armour Blvd Kansas City, MO | 2.0 | 1.0–2.0 | 1023 | $2,105 | $2.06 | 44d | 8 | 0.60mi |
| 2903 Gillham Rd Kansas City, MO | 2.0 | 2.0 | 1159 | $1,695 | $1.46 | 44d | 1 | 0.63mi |
| 3333 Gillham Rd Kansas City, MO | 4.0 | 2.0 | 1500 | $2,000 | $1.33 | 14d | 1 | 0.63mi |
| 3616 Warwick Blvd Kansas City, MO | 2.0 | 1.0 | 950 | $1,312 | $1.38 | 3d | 1 | 0.67mi |
| 3724 Broadway Blvd Kansas City, MO | 2.0 | 1.0 | 727 | $1,580 | $2.17 | 21d | 1 | 0.68mi |
| 2915 Cherry St Kansas City, MO | 1.0–2.0 | 1.0–2.0 | 995 | $1,625 | $1.63 | 44d | 7 | 0.68mi |
| 227 E 27th St Kansas City, MO | 2.0 | 2.0 | 1172 | $1,960 | $1.67 | 44d | 1 | 0.68mi |
| 520 E Armour Blvd Kansas City, MO | 3.0 | 1.0–2.0 | 782 | $1,970 | $2.52 | 16d | 19 | 0.68mi |
| 520 E Armour Blvd Kansas City, MO | 3.0 | 1.0–2.0 | 882 | $2,630 | $2.98 | 2d | 22 | 0.68mi |
| 2645 Madison Ave Unit 6 Kansas City, MO | 3.0 | 2.0 | 1500 | $2,300 | $1.53 | 44d | 1 | 0.69mi |
| 3704 Wyandotte St Apt 7 Kansas City, MO | 2.0 | 1.0 | 950 | $1,195 | $1.26 | 44d | 1 | 0.69mi |
| 2705 McGee Trfy Kansas City, MO | 3.0 | 1.0–2.0 | 1000 | $2,881 | $2.88 | 2d | 13 | 0.69mi |
| 525 E Armour Blvd Kansas City, MO | 1.0–2.0 | 1.0–2.0 | 696 | $1,620 | $2.33 | 3d | 30 | 0.70mi |
| 525 E Armour Blvd Kansas City, MO | 2.0 | 1.0–2.0 | 696 | $1,650 | $2.37 | 16d | 38 | 0.70mi |
| 3633 Walnut St Kansas City, MO | 2.0 | 1.0 | 900 | $1,188 | $1.32 | 24d | 1 | 0.70mi |
Listing history 7 events
-
2026-05-10status Pending 608-char remark
-
2026-05-09$159,000 Active 608-char remark
-
2026-05-06historical $159,000 608-char remark
-
2006-10-17soldstatus 116-char remark
Show marketing remark (116 chars)
Corporate Owned - Call for Addendums. Earnest Deposit must be Certified Funds. Pre-Approval or Proof Funds required.
-
2006-10-13soldstatus
-
2006-08-17$129,900 116-char remark
Show marketing remark (116 chars)
Corporate Owned - Call for Addendums. Earnest Deposit must be Certified Funds. Pre-Approval or Proof Funds required.
-
1992-09-23soldstatus
ⓘ Source: listings_history table (triggers on properties + properties_extension) + one-shot
backfill from property_details.listing_events for pre-trigger history.
Tax reassessment forecast MO · Resets to sale price
- Current annual tax
- $3,654 · $304/mo
- Projected year-2 tax
- $3,654 · $304/mo
- Expected delta
- $0/yr ($0/mo · 0.0%)
ⓘ Screening estimate from a state-policy table — verify with the county assessor before closing.
Climate risk First Street
- Flood 1/10 Low FEMA zone X (unshaded) · 0% chance over 30 yrs
- Wildfire 1/10 Low
- Heat 4/10 Moderate 7 d/yr ≥106°F today · 17 d/yr by 30 yrs out
- Wind 2/10 Low
- Air quality 3/10 Moderate 2 unhealthy d/yr today · 3 by 30 yrs out
Nearby sold comps map
Loading sold comps map…
Walkable amenities ~0.75 mi
Loading nearby amenities…
Taxation est. · year 1
- Rental income
- $22,027
- − Mortgage interest
- −$8,906
- − Property taxes
- −$3,654
- − Insurance
- −$795
- − Repairs & maintenance
- −$1,762
- − Management
- −$1,762
- − Depreciation
- −$4,625
- Taxable income
- $522
- Est. tax owed @ 24.0%
- −$125
- After-tax cash flow
- $2,822/yr
For passive investors: Depreciation is non-cash, so a rental often shows a tax loss while cash-flowing — sheltering income. Rental losses are passive: they offset passive income freely, and up to $25,000/yr can offset ordinary (W-2) income if you actively participate and your MAGI is under $100k (phasing out to $0 by $150k); unused losses carry forward. On sale, claimed depreciation is recaptured at up to 25%, and gains may owe capital-gains tax (a 1031 exchange can defer both). Figures are a year-1 estimate at your 24.0% rate — not tax advice; consult a CPA.
Schools (NCES district)
- District
- Kansas City 33
- NCES district ID
- 2916400
- Math proficiency
- 12% ▼ -8.00%
- Reading proficiency
- 24% ▬ 0.00%
- Median HH income
- $35,227
- Composite
- 14.8/100
- National rank
- #9387
- State rank
- #308 of 324 in MO
Livability — Kansas City
- Score
- 78/100
- State rank
- #28
- US rank
- #2671
Category grades
Schools grade is shown separately in the Schools card above.
Census & demographics
- Census place
- Kansas City, MO
- County
- Jackson County · 687,798 people
- City population
- 439,467
- Metro
- Kansas City, MO-KS
- Population (ZIP)
- 16,887
- Household income
- $61,729
- Rent vs Own
- Severe rent burden
- 1606.0
Population outlook (Jackson County) Hauer SSP2
- Today (2025)
- 719,589 people
- By 2030
- 731,456 · +1.6%
- By 2040
- 746,689 · +3.8%
- By 2050
- 749,289 · +4.1%
- By 2075
- 736,227 · +2.3%
- By 2100
- 668,210 · -7.1%
Race, ethnicity, and origin ACS 2023
- Neighborhood character
- Predominantly White (70%)
- Race & ethnicity
- White 70% Hispanic / Latino 10% Black 10% Two or more races 9% Asian 3%
- Hispanic origin (detail)
- Mexican 8%
- Common ancestry
- Lithuanian 3% Slovak 2% Serbian 2%
- Foreign-born
- 6% · Canada, China
- Languages at home
- 90% English-only · Spanish 5% Other Asian/Pacific 1% Chinese 1%
Political lean MEDSL · Jackson
- 2024 margin
- D (+19.3) · D 58.9% · R 39.5% · Other 1.6%
- 2008→2024 swing
- -6.1pp toward R · 2008: 25.4pp · 2024: 19.3pp
- All cycles
- 2024: D+19.3 2020: D+22.0 2016: D+16.6 2012: D+19.0 2008: D+25.4
Not yet ingested
- Civics
- —
Market trends
- HPI YoY
- ▼ -341.84%
- Current HPI
- 282.068
- Rent YoY
- ▲ 3.42%
- Metro
- Kansas City, MO-KS
- State GDP YoY
- ▲ 1.84%
- F500 in state
- 20
Industry mix (Fortune 500 HQ in MO)
| Industry | F500 HQs | Revenue |
|---|---|---|
| Healthcare | 1 | $163B |
|
||
| Insurance | 1 | $21B |
|
||
| Industrial Technology | 1 | $17B |
|
||
| Retail | 1 | $16B |
|
||
| Industrial Distribution | 1 | $10B |
|
||
| Utilities | 1 | $9B |
|
||
Price history
+22.4% since first listed8 events — show timeline
- 2026-05-27 Sold (MLS) — Heartland MLS as Distributed by MLS Grid
- 2026-05-10 Pending — Heartland MLS as Distributed by MLS Grid
- 2026-05-09 Listed $159,000 Heartland MLS as Distributed by MLS Grid
- 2026-05-06 Coming Soon $159,000 Heartland MLS as Distributed by MLS Grid
- 2006-10-17 Sold (MLS) — Heartland MLS as Distributed by MLS Grid
- 2006-10-13 Sold (Public Records) — Public Records
- 2006-08-17 Listed $129,900 Heartland MLS as Distributed by MLS Grid
- 1992-09-23 Sold (Public Records) — Public Records
Property tax history
+7.2%/yrLatest (2025): $3,654 · +4.8% YoY. Source: county tax records.
Cash-flow waterfall
monthlySold comps — $/sqft
last 12 mo · ≤1 miLoading sold comps…