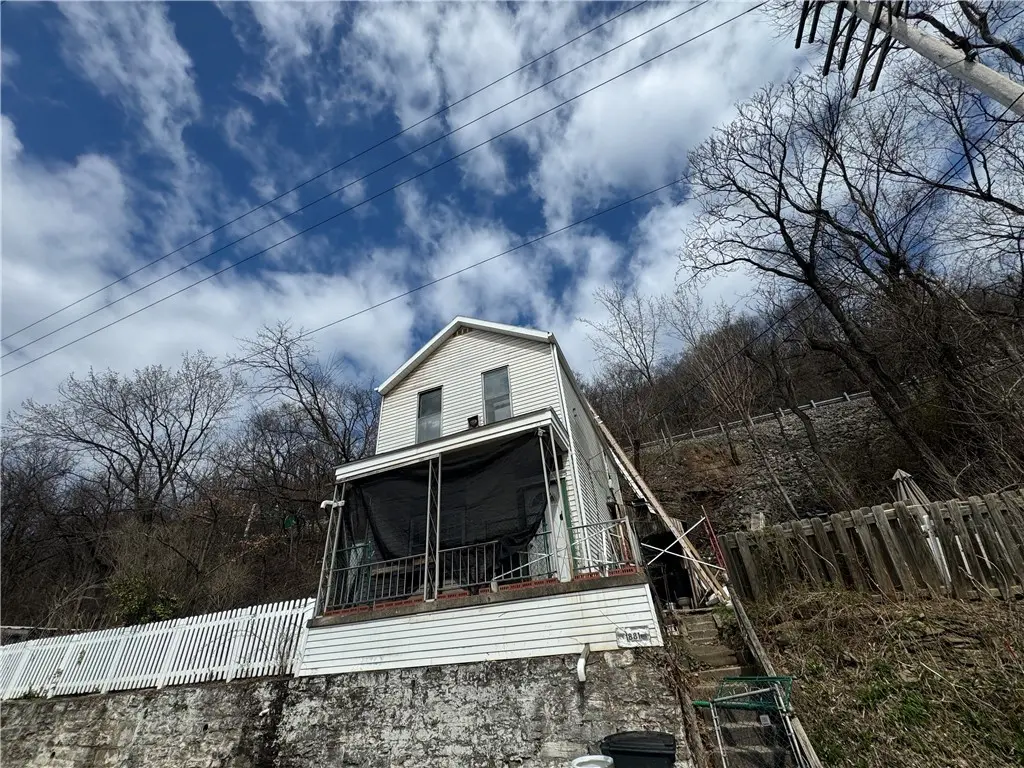
1881 Noble St · Sharpsburg, PA
Flood risk 6/10 · Moderate
- FEMA flood zone
- X (unshaded)
- Chance of flooding over 30 yrs
- 0.27%
- Est. flood insurance / yr
- $473 – $860
Fire risk 1/10 · Minimal
- Est. fire insurance / yr
- $511 – $949
Heat risk 4/10 · Minor
- Hot days now (above 98°F)
- 7 days/yr
- Hot days in 30 yrs
- 18 days/yr
Wind risk 2/10 · Minimal
- Chance of severe wind over 30 yrs
- —
Air-quality risk 4/10 · Minor
- Unhealthy air days now
- 5 days/yr
- Unhealthy air days in 30 yrs
- 7 days/yr
Risk factors via First Street. Map © Google.
Why this score? — see what drove the B grade
The composite is a weighted blend of 9 inputs, each scored 0–100. Each bar is that input's sub-score; the figure is the points it added to the 100-point composite (weight × sub-score).
- Cash flow +30.0/30.0
- 1% rule +10.0/10.0
- DSCR +10.0/10.0
- ARV discount +7.5/15.0
- Schools +6.9/10.0
- Livability +4.0/5.0
- Rent growth +3.8/5.0
- Condition / age +2.5/5.0
- Appreciation +0.0/10.0
$39,900
🖨 Deal sheet 📄 Offer letter ✓ Due diligence
Listing remarks MLS
This house needs some TLC. Large yard and detached garage. Great opportunity for someone who wants a fixer upper or rental property.
Key facts
- Nice size yard
- Great location
- Full rehab
Tags
Neighborhood map
What this means for you Summary
Snapshot
- This is a 2-bed/1.0-bath single-family listed at $40k.
Deal economics
- At list price, monthly cash flow is $681 ($8k/yr) — positive.
- The deal already cash-flows at list — no discount required.
- Meets the 1% rule at list price ($1k rent vs $40k).
- Recommended offer: $39k (1.5% below list) — sets the bar for market timing.
- Cap rate 26.8% vs local median 9.5% in Sharpsburg — top-decile yield for the area; either an underpriced asset or a hidden risk that comps aren't pricing in. Stress-test before assuming the spread holds.
Location & tenants
- Location reads 79/100 on livability (#248 in PA, #2,145 nationally) — a middle-class / working-renter tenant base. Strengths: commute A+, cost of living A+, housing A+; Watch: amenities D, schools D-, employment D-.
- Fox Chapel Area SD (suburban): math 73% / reading 85% proficiency, ranked #7 of 539 in PA (top 1%) — strong family-tenant draw, lease renewals of 3-5y typical; only 16% free/reduced lunch — higher-income household profile.
- Market conditions: Rents rising fast (+5.2%/yr); 56 active listings in the ZIP; 14 comparable units currently listed for rent nearby; rentals at typical pace (median 24d on market — plan ~3-4 weeks tenant-placement turnaround); solid renter incomes; 2,996 units permitted in Allegheny County in 2024 (1,588 in 5+ unit buildings).
- This rent is only 16% of the median local income ($99k/yr) — well below the 30% rent-burden line; pricing power to push rent on renewal without tenant pushback.
Forward outlook
- Local home prices are declining (-3.0%/yr); year-one equity from $276 of loan paydown is wiped out by about $1k of value loss. Plan a longer hold.
- At projected returns (-3.0% appreciation + 5.2% rent growth), your $11k cash investment doubles in ~2 years — after that, you're playing with house money.
Negotiation context
- It's been on market 23 days — a 2% lower offer ($39k) is reasonable based on typical stale-listing flexibility.
- 5 sale attempts since 22y ago; this cycle's ask has dropped $10k (20%) from the opening price — seller is motivated, your offer sets the floor, not the list.
- Current owner paid $12k; list at $40k implies a 233% gain — meaningful room to come down on a strong offer.
Risks & watch-outs
- Watch-outs: property tax is 4.2% of price; built in 1900 — expect roof / HVAC / electrical / plumbing capex.
- Climate carrying-cost: major flood risk — expect insurance premiums to compound above CPI over the hold.
Questions for the listing agent
- Built in 1900 — when were the roof, HVAC, electrical panel, plumbing, and water heater last replaced?
- Property tax is high relative to price — has the assessment been appealed recently, and will the sale trigger a re-assessment?
- Is there a deadline driving the sale (1031 exchange, divorce, estate, relocation)? That informs how much negotiation room exists.
- Schools are D-rated, which usually means shorter tenancies and higher turnover. Who's the typical renter profile here, and what's been the actual vacancy rate?
- What's the average days-on-market for RENTAL listings here right now (not sales)? A rising rental-DOM trend means longer vacancies and softer asking-rent achievability than the comps imply.
- What's the recent tenant-quality profile in this submarket — average credit score on applications, eviction rate, late-payment / NSF rate, and stable-employment percentage? A property-management company in the area should have these aggregated.
- How much new for-sale + rental construction is in the pipeline within 1–3 miles? Heavy new supply typically softens prices + rents 12–24 months out; constrained supply supports both.
Investment metrics
- 1% rule
- 3.32% ✓
- Cap rate
- 26.77%
- Cash-on-cash
- 73.14%
- DSCR
- 4.25
- GRM
- 2.5
CMA / ARV
- ARV (on-the-fly)
- $233,792
- Comps found
- 2
Show comp detail 2 sales within ~0.75 mi
| Address | Dist | Beds/Ba | Sqft | Sold | Price | $/sf | Match |
|---|---|---|---|---|---|---|---|
| 1815 S Canal St | 0.16mi | 2/1.0 | 868 (+4%) | 24mo | $160,000 | $184 | 66 |
| 242 Kittanning Pike | 0.70mi | 2/2.0 | 871 (+5%) | 2mo | $245,000 | $281 | 53 |
Match score weights: distance 35% · size 25% · config 20% · recency 20%. Top-matched comps best support the ARV.
Projected returns pro-forma
-3.0% appreciation · 5.24% rent growth · sell at horizon
- IRR
- 75.7%
- Equity multiple
- 4.58×
- Total profit
- $40,028
- Equity at exit
- $5,949
- IRR
- 80.1%
- Equity multiple
- 10.32×
- Total profit
- $104,114
- Equity at exit
- $3,450
Cash invested: $11,172 (down + closing). Projections, not guarantees.
Landlord ↔ Tenant lean methodology
- Overall (STATE)
- 62 Landlord-Friendly
- State Pennsylvania
- 62 Landlord-Friendly · EVEN
- County
- — inherits STATE
- City
- — inherits STATE
ZIP-level market 15215
- Rents YoY
- 5.2%
- Active inventory
- 56
- Price-to-rent
- 2.5×
Monthly cashflow live
- Estimated rent
- $1,325 high interval (Pro) →
- Mortgage (P&I)
- −$209
- Tax from tax record
- −$140 /mo · $1,676/yr
- Insurance
- −$17
- HOA
- −$0
- Vacancy / Maint / Mgmt
- −$278
- Net cashflow
- $681
Break-even live
UW: 25.0% down · 7.5% · 30yr · 1.5% tax · 5.0% vac · 8.0% maint · 8.0% mgmt
Financing live
Cash to close
- Down payment
- $9,975
- Closing costs
- $1,197
- Reserves months
- —
- Total cash needed
- —
Loan-product check · same deal, 3 products live
Conventional
25% down · 7.5% · 30yr
- Down + closing
- —
- Monthly P&I
- —
- Monthly cashflow
- —
- DSCR
- —
- Eligible?
- —
Personal DTI + credit; lowest rate.
DSCR
20% down · 8.5% · 30yr
- Down + closing
- —
- Monthly P&I
- —
- Monthly cashflow
- —
- DSCR
- —
- Eligible?
- —
No personal income docs; deal must DSCR.
Hard money
10% down · 12.0% · 12mo
- Down + closing
- —
- Monthly P&I
- —
- Monthly cashflow
- —
- DSCR
- —
- Eligible?
- —
Short-term bridge; refi at stabilization.
Rent comps 14 comps
| Address | Beds | Baths | Sqft | Rent | $/sqft | DOM | Units | Dist |
|---|---|---|---|---|---|---|---|---|
| 209 Mary St Sharpsburg, PA | 3.0 | 1.0 | 1100 | $1,395 | $1.27 | 23d | 1 | 0.44mi |
| 207 Mary St Sharpsburg, PA | 3.0 | 1.0 | 1100 | $1,395 | $1.27 | 23d | 1 | 0.44mi |
| 112 5th St Unit 2 Aspinwall, PA | 2.0 | 1.0 | 700 | $950 | $1.36 | 23d | 1 | 0.70mi |
| 124 1st St Unit 2 Aspinwall, PA | 1.0 | 1.0 | 750 | $950 | $1.27 | 43d | 1 | 0.75mi |
| 133 2nd St Unit 1 Aspinwall, PA | 2.0 | 1.0 | 875 | $1,300 | $1.49 | 43d | 1 | 0.76mi |
| 212 Church St Apt 3 Pittsburgh, PA | 1.0 | 1.0 | 800 | $850 | $1.06 | 7d | 1 | 0.80mi |
| 212 Church St Apt 3 Pittsburgh, PA | 1.0 | 1.0 | 800 | $850 | $1.06 | 4d | 1 | 0.80mi |
| 514 Guyasuta Rd Unit 2 Pittsburgh, PA | 2.0 | 1.0 | 875 | $1,050 | $1.20 | 23d | 1 | 0.84mi |
| 553 Foundry St Pittsburgh, PA | 2.0 | 2.0 | 1025 | $1,650 | $1.61 | 21d | 1 | 1.12mi |
| 14 Bethany Dr Unit A Pittsburgh, PA | 2.0 | 1.5 | 1032 | $1,650 | $1.60 | 43d | 1 | 1.22mi |
| 5700 Bunkerhill St Pittsburgh, PA | 1.0–3.0 | 1.0–2.0 | 1258 | $2,608 | $2.07 | 1d | 17 | 1.23mi |
| 38 Walnut St Etna, PA | 1.0 | 1.0 | 874 | $1,075 | $1.23 | 4d | 1 | 1.48mi |
| 1115 N Negley Ave Pittsburgh, PA | 1.0–2.0 | 1.0–2.0 | 968 | $2,390 | $2.47 | 1d | 2 | 1.49mi |
| 39 Prospect St Pittsburgh, PA | 2.0 | 1.0 | 1056 | $1,200 | $1.14 | 7d | 1 | 1.50mi |
Listing history 14 events
-
2026-04-15status Pending
-
2026-03-30price $39,900
-
2026-03-30price $40,000
-
2026-03-23$49,999 Active
-
2023-07-10price $13,000
-
2023-06-26price $19,000
-
2023-06-10price $29,000
-
2023-06-06$34,000 Active
-
2015-06-16historical 132-char remark
Show marketing remark (132 chars)
This house needs some TLC. Large yard and detached garage. Great opportunity for someone who wants a fixer upper or rental property.
-
2015-04-10$19,500 Active 132-char remark
Show marketing remark (132 chars)
This house needs some TLC. Large yard and detached garage. Great opportunity for someone who wants a fixer upper or rental property.
-
2013-12-08$22,500
-
2004-12-03soldstatus $12,000
-
2004-11-29soldstatus $12,000
-
2004-06-29$23,000
ⓘ Source: listings_history table (triggers on properties + properties_extension) + one-shot
backfill from property_details.listing_events for pre-trigger history.
Tax reassessment forecast PA · Partial reset (capped growth)
- Current annual tax
- $1,676 · $140/mo
- Projected year-2 tax
- $1,676 · $140/mo
- Expected delta
- $0/yr ($0/mo · 0.0%)
ⓘ Screening estimate from a state-policy table — verify with the county assessor before closing.
Climate risk First Street
- Flood 6/10 Major FEMA zone X (unshaded) · 27% chance over 30 yrs
- Wildfire 1/10 Low
- Heat 4/10 Moderate 7 d/yr ≥98°F today · 18 d/yr by 30 yrs out
- Wind 2/10 Low
- Air quality 4/10 Moderate 5 unhealthy d/yr today · 7 by 30 yrs out
Nearby sold comps map
Loading sold comps map…
Walkable amenities ~0.75 mi
Loading nearby amenities…
Taxation est. · year 1
- Rental income
- $15,896
- − Mortgage interest
- −$2,235
- − Property taxes
- −$1,676
- − Insurance
- −$200
- − Repairs & maintenance
- −$1,272
- − Management
- −$1,272
- − Depreciation
- −$1,161
- Taxable income
- $8,081
- Est. tax owed @ 24.0%
- −$1,939
- After-tax cash flow
- $6,231/yr
For passive investors: Depreciation is non-cash, so a rental often shows a tax loss while cash-flowing — sheltering income. Rental losses are passive: they offset passive income freely, and up to $25,000/yr can offset ordinary (W-2) income if you actively participate and your MAGI is under $100k (phasing out to $0 by $150k); unused losses carry forward. On sale, claimed depreciation is recaptured at up to 25%, and gains may owe capital-gains tax (a 1031 exchange can defer both). Figures are a year-1 estimate at your 24.0% rate — not tax advice; consult a CPA.
Schools (NCES district)
- District
- Fox Chapel Area SD
- NCES district ID
- 4210070
- Math proficiency
- 73% ▼ -5.00%
- Reading proficiency
- 85% ▼ -2.00%
- Median HH income
- $73,326
- Composite
- 69.02/100
- National rank
- #324
- State rank
- #7 of 539 in PA
Livability — Sharpsburg
- Score
- 79/100
- State rank
- #248
- US rank
- #2145
Category grades
Schools grade is shown separately in the Schools card above.
Census & demographics
- Census place
- Sharpsburg, PA
- County
- Allegheny County · 1,022,028 people
- Metro
- Pittsburgh, PA
- Population (ZIP)
- 11,907
- Household income
- $99,071
- Rent vs Own
- Severe rent burden
- 311.0
Population outlook (Allegheny County) Hauer SSP2
- Today (2025)
- 1,250,282 people
- By 2030
- 1,256,482 · +0.5%
- By 2040
- 1,256,318 · +0.5%
- By 2050
- 1,244,169 · -0.5%
- By 2075
- 1,197,693 · -4.2%
- By 2100
- 1,093,187 · -12.6%
Race, ethnicity, and origin ACS 2023
- Neighborhood character
- Predominantly White (86%)
- Race & ethnicity
- White 86% Asian 5% Two or more races 4% Black 4% Hispanic / Latino 3%
- Common ancestry
- Romanian 9% Lithuanian 3% Scotch-Irish 2%
- Foreign-born
- 7% · China, South Korea, Canada
- Languages at home
- 91% English-only · Spanish 2% Chinese 2% Other Indo-European 2%
Political lean MEDSL · Allegheny
- 2024 margin
- Strong D (+20.3) · D 59.7% · R 39.4%
- 2008→2024 swing
- +4.8pp toward D · 2008: 15.5pp · 2024: 20.3pp
- All cycles
- 2024: D+20.3 2020: D+20.4 2016: D+16.4 2012: D+14.4 2008: D+15.5
Not yet ingested
- Civics
- —
Market trends
- HPI YoY
- ▼ -171.68%
- Current HPI
- 284.7359
- Rent YoY
- ▲ 5.24%
- Metro
- Pittsburgh, PA
- State GDP YoY
- ▲ 1.68%
- F500 in state
- 34
Industry mix (Fortune 500 HQ in PA)
| Industry | F500 HQs | Revenue |
|---|---|---|
| Healthcare | 2 | $309B |
|
||
| Insurance | 2 | $27B |
|
||
| Telecommunications / Media | 1 | $124B |
|
||
| Industrial Distribution | 1 | $22B |
|
||
| Financial Services | 1 | $20B |
|
||
| Chemicals / Materials | 1 | $18B |
|
||
Price history
+73.5% since first listed14 events — show timeline
- 2026-04-15 Pending — West Penn MLS
- 2026-03-30 Price Changed $39,900 West Penn MLS
- 2026-03-30 Price Changed $40,000 West Penn MLS
- 2026-03-23 Listed $49,999 West Penn MLS
- 2023-07-10 Price Changed $13,000 West Penn MLS
- 2023-06-26 Price Changed $19,000 West Penn MLS
- 2023-06-10 Price Changed $29,000 West Penn MLS
- 2023-06-06 Listed $34,000 West Penn MLS
- 2015-06-16 Delisted — West Penn MLS
- 2015-04-10 Listed $19,500 West Penn MLS
- 2013-12-08 Listed $22,500 West Penn MLS
- 2004-12-03 Sold (Public Records) $12,000 Public Records
- 2004-11-29 Sold (MLS) $12,000 West Penn MLS
- 2004-06-29 Listed $23,000 West Penn MLS
Property tax history
+2.1%/yrLatest (2026): $1,676 · +1.3% YoY. Source: county tax records.
Cash-flow waterfall
monthlySold comps — $/sqft
last 12 mo · ≤1 miLoading sold comps…