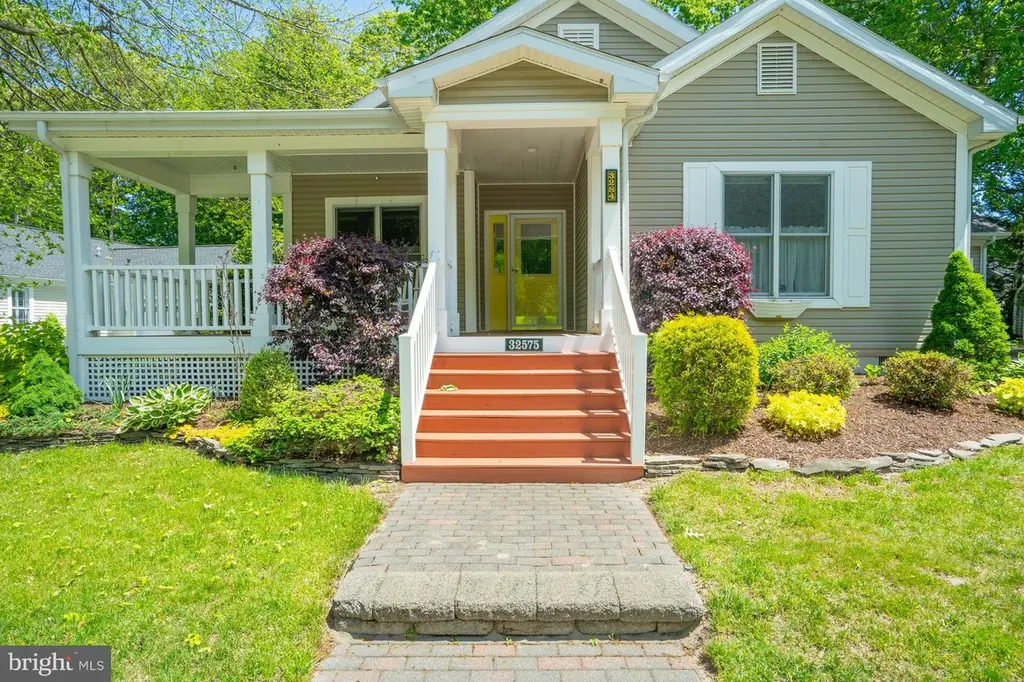
32575 Long Spoon Way · Long Neck, DE
Flood risk 1/10 · Minimal
- FEMA flood zone
- X (unshaded)
- Chance of flooding over 30 yrs
- 0.0%
- Est. flood insurance / yr
- $473 – $860
Fire risk 1/10 · Minimal
- Est. fire insurance / yr
- $476 – $884
Heat risk 8/10 · Major
- Hot days now (above 101°F)
- 7 days/yr
- Hot days in 30 yrs
- 18 days/yr
Wind risk 8/10 · Major
- Chance of severe wind over 30 yrs
- 80.0%
Air-quality risk 2/10 · Minimal
- Unhealthy air days now
- 1 days/yr
- Unhealthy air days in 30 yrs
- 1 days/yr
Risk factors via First Street. Map © Google.
Why this score? — see what drove the C grade
The composite is a weighted blend of 9 inputs, each scored 0–100. Each bar is that input's sub-score; the figure is the points it added to the 100-point composite (weight × sub-score).
- Cash flow +20.5/30.0
- ARV discount +15.0/15.0
- DSCR +6.5/10.0
- 1% rule +5.4/10.0
- Livability +3.5/5.0
- Schools +2.9/10.0
- Rent growth +2.5/5.0
- Condition / age +2.5/5.0
- Appreciation +0.0/10.0
$289,000
🖨 Deal sheet 📄 Offer letter ✓ Due diligence
Listing remarks
Welcome home to your golf community home with amenity rich offerings. This 3-bedroom, 2 bath, and 2 car garage home offers a fenced in rear yard with new carpet and fresh paint. Sit on your front porch and enjoy morning coffee before you enter into your coastal ranch style home. The living area with gas fireplace and hardwood flooring allows room for relaxing. The bright kitchen with tile floor and eat-in area that flows to the screened porch allows room for entertaining. Owners suit with new carpet, walk in closet, and with a standup shower and garden tub. Additional guest bedrooms provide room for your loved ones. The fenced in rear yard which expands from side to side and is shaded with
Key facts
- Hardwood flooring
- Tile floor
- Coastal ranch style
Tags
Property features AI
Finance
- Other: Ownership is land lease
- Financial info: Annual land lease/ground rent payment applies
- HOA & community: Community amenities include beach access, boat slip and ramp, clubhouse, community center, dog park, exercise room, golf course, outdoor pool, tennis courts, playgrounds/tot lots, and water/lake privileges; Ground rent / land lease in place with annual payment (ground rent/land lease years remaining: 16)
Exterior
- Parking: Attached front-entry garage with 2 garage spaces (2 total parking spaces)
- Utilities: Public water and public sewer; Electric hot water; Electric cooling; Propane (leased) for heating
- Home design: Detached modular/manufactured home; Architectural shingle roof; Block foundation; Single-level living with main-floor bedrooms; Not in a federal flood zone
- Construction: Modular/Manufactured construction; Block foundation; Architectural shingle roof; Estimated year built
- Exterior features: Screened outdoor living area; Rear fencing; Street lights; Backs to trees; Community in-ground pool
Interior
- Kitchen: Built-in microwave; Dishwasher; Electric oven/range (single) and range hood; Refrigerator
- Bedrooms: Three bedrooms on the main level
- Flooring: Carpet, hardwood, and tile/brick flooring
- Bathrooms: Two full bathrooms on the main level
- Heating & cooling: Forced air heating (propane - leased); Central air conditioning; 200+ amp electrical service
- Interior features: Soaking tub and tub/shower; Breakfast area, dining area, and combination kitchen/dining; Ceiling fans and recessed lighting; Floor plan is traditional with an entry-level bedroom; Kitchen island and eat-in kitchen; Walk-in closets; Drywall walls and ceilings
- Laundry & utility: Washer and dryer located on the main floor; Electric hot water
Neighborhood map
What this means for you Summary
Snapshot
- This is a 3-bed/3.0-bath single-family listed at $289k.
Deal economics
- At list price, monthly cash flow is $379 ($5k/yr) — positive.
- The deal already cash-flows at list — no discount required.
- Meets the 1% rule at list price ($3k rent vs $289k).
- Recommended offer: $280k (3.0% below list) — sets the bar for market timing.
- Cap rate 7.9% vs local median 3.2% in Long Neck — top-decile yield for the area; either an underpriced asset or a hidden risk that comps aren't pricing in. Stress-test before assuming the spread holds.
Location & tenants
- Location reads 69/100 on livability (#30 in DE) — a middle-class / working-renter tenant base. Strengths: cost of living A+, housing A+, crime A-; Watch: employment D+, amenities F, commute F.
- Indian River School District (rural): math 25% / reading 41% proficiency, ranked #14 of 26 in DE (top 54%) — families likely to look elsewhere, expect single-tenant / working-renter base with shorter leases.
- Zoned schools: Long Neck Elementary School (math 22% / reading 35%, grade F, #57 of 105 statewide, top 55%, 693 students, 0% FRL); Sussex Central High School (math 23% / reading 42%, grade F, #24 of 40 statewide, top 59%, 2,039 students, 0% FRL) — zoned schools average 0% FRL vs 49% district-wide (49 pts lower); this property's tenant base skews higher-income than the district average.
- Market conditions: 865 active listings in the ZIP; 2 comparable units currently listed for rent nearby; solid renter incomes; 4,354 units permitted in Sussex County in 2024 (344 in 5+ unit buildings).
- At $3,008/mo this rent would consume 46% of the median local household income ($78k/yr) (locally 464% of renters already pay >50% of income on rent) — very limited rent-growth headroom before tenants either downsize or default.
Forward outlook
- Local home prices are declining (-3.0%/yr); year-one equity from $2k of loan paydown is wiped out by about $9k of value loss. Plan a longer hold.
- Sussex County population projected at +25% by 2050 — long-run rental-demand tailwind backs the buy-and-hold thesis.
Negotiation context
- It's been on market 33 days — a 3% lower offer ($280k) is reasonable based on typical stale-listing flexibility.
Risks & watch-outs
- Climate carrying-cost: severe wind risk, 80% chance of damaging wind over 30y; extreme-heat days projected 7→18/yr by 2055 (HVAC capex compounding) — expect insurance premiums to compound above CPI over the hold.
Questions for the listing agent
- It's been on market 33 days. Have you received any prior offers? Is the seller open to a 3% concession, seller financing, or rate buy-down credit?
- Is there a deadline driving the sale (1031 exchange, divorce, estate, relocation)? That informs how much negotiation room exists.
- Schools are F-rated, which usually means shorter tenancies and higher turnover. Who's the typical renter profile here, and what's been the actual vacancy rate?
- What's the average days-on-market for RENTAL listings here right now (not sales)? A rising rental-DOM trend means longer vacancies and softer asking-rent achievability than the comps imply.
- What's the recent tenant-quality profile in this submarket — average credit score on applications, eviction rate, late-payment / NSF rate, and stable-employment percentage? A property-management company in the area should have these aggregated.
- How much new for-sale + rental construction is in the pipeline within 1–3 miles? Heavy new supply typically softens prices + rents 12–24 months out; constrained supply supports both.
Investment metrics
- 1% rule
- 1.04% ✓
- Cap rate
- 7.87%
- Cash-on-cash
- 5.63%
- DSCR
- 1.25
- GRM
- 8.0
CMA / ARV
- ARV (on-the-fly)
- $385,220
- Comps found
- 12
Show comp detail 12 sales within ~0.75 mi
| Address | Dist | Beds/Ba | Sqft | Sold | Price | $/sf | Match |
|---|---|---|---|---|---|---|---|
| 33754 Caddies Way | 0.13mi | 3/2.0 | 1,865 (-0%) | 0mo | $330,000 | $177 | 89 |
| 32554 Long Spoon Way #3141 | 0.12mi | 3/2.0 | 1,860 (-0%) | 4mo | $343,000 | $184 | 86 |
| 32519 Putters Dell #3268 | 0.07mi | 3/2.0 | 1,935 (+4%) | 9mo | $295,000 | $152 | 79 |
| 32373 Bayshore Dr | 0.51mi | 3/2.0 | 1,892 (+1%) | 3mo | $395,000 | $209 | 68 |
| 205 Long Neck Cir | 0.22mi | 3/2.0 | 1,674 (-10%) | 1mo | $309,900 | $185 | 68 |
| 31517 Hook Way | 0.45mi | 3/2.0 | 1,854 (-1%) | 8mo | $374,503 | $202 | 67 |
| 32524 Putters Dell Dr #3274 | 0.10mi | 3/2.0 | 2,060 (+10%) | 10mo | $415,000 | $201 | 67 |
| 32585 Long Spoon Way #3280 | 0.08mi | 3/2.0 | 1,618 (-14%) | 4mo | $380,000 | $235 | 66 |
| 25043 Dogleg Way | 0.40mi | 3/2.0 | 2,004 (+7%) | 10mo | $444,753 | $222 | 58 |
| 32253 Bayshore Dr | 0.52mi | 3/2.0 | 1,695 (-9%) | 10mo | $425,000 | $251 | 48 |
| 26366 Timbercreek Ln | 0.74mi | 4/2.0 (+1) | 1,900 (+2%) | 8mo | $439,000 | $231 | 48 |
| 26383 Timbercreek Ln | 0.75mi | 4/3.0 (+1) | 2,100 (+12%) | 7mo | $432,000 | $206 | 34 |
Match score weights: distance 35% · size 25% · config 20% · recency 20%. Top-matched comps best support the ARV.
Projected returns pro-forma
-3.0% appreciation · 3.0% rent growth · sell at horizon
- IRR
- -7.6%
- Equity multiple
- 0.72×
- Total profit
- $-22,622
- Equity at exit
- $43,091
- IRR
- 2.0%
- Equity multiple
- 1.14×
- Total profit
- $11,599
- Equity at exit
- $24,987
Cash invested: $80,920 (down + closing). Projections, not guarantees.
Landlord ↔ Tenant lean methodology
- Overall (STATE)
- 70 Landlord-Friendly
- State Delaware
- 70 Landlord-Friendly · D+7
- County
- — inherits STATE
- City
- — inherits STATE
ZIP-level market 19966
- Home prices YoY
- -6.4%
- Active inventory
- 865
- Price-to-rent
- 8.0×
Monthly cashflow live
- Estimated rent
- $3,008 medium interval (Pro) →
- Mortgage (P&I)
- −$1,516
- Tax est. 1.5%
- −$361 /mo · $4,335/yr
- Insurance
- −$120
- HOA
- −$0
- Vacancy / Maint / Mgmt
- −$632
- Net cashflow
- $379
Break-even live
UW: 25.0% down · 7.5% · 30yr · 1.5% tax · 5.0% vac · 8.0% maint · 8.0% mgmt
Financing live
Cash to close
- Down payment
- $72,250
- Closing costs
- $8,670
- Reserves months
- —
- Total cash needed
- —
Loan-product check · same deal, 3 products live
Conventional
25% down · 7.5% · 30yr
- Down + closing
- —
- Monthly P&I
- —
- Monthly cashflow
- —
- DSCR
- —
- Eligible?
- —
Personal DTI + credit; lowest rate.
DSCR
20% down · 8.5% · 30yr
- Down + closing
- —
- Monthly P&I
- —
- Monthly cashflow
- —
- DSCR
- —
- Eligible?
- —
No personal income docs; deal must DSCR.
Hard money
10% down · 12.0% · 12mo
- Down + closing
- —
- Monthly P&I
- —
- Monthly cashflow
- —
- DSCR
- —
- Eligible?
- —
Short-term bridge; refi at stabilization.
Rent comps 2 comps
| Address | Beds | Baths | Sqft | Rent | $/sqft | DOM | Units | Dist |
|---|---|---|---|---|---|---|---|---|
| 34011 Harvard Ave Millsboro, DE | 1.0–3.0 | 1.0–2.0 | 1048 | $4,516 | $4.31 | 13d | 1 | 0.68mi |
| 23567 Devonshire Rd Millsboro, DE | 3.0 | 2.5 | 2166 | $2,000 | $0.92 | 21d | 1 | 1.14mi |
Listing history 16 events
-
2026-06-18days on market $289,000 Active 33 DOM
-
2026-06-17pricedays on market $289,000 Active 32 DOM
-
2026-06-16days on market $299,000 Active 31 DOM
-
2026-06-15days on market $299,000 Active 30 DOM
-
2026-06-14days on market $299,000 Active 28 DOM
-
2026-06-13days on market $299,000 Active 27 DOM
-
2026-06-10days on market $299,000 Active 25 DOM
-
2026-06-09days on market $299,000 Active 24 DOM
-
2026-06-08days on market $299,000 Active 23 DOM
-
2026-06-07days on market $299,000 Active 22 DOM
-
2026-06-02days on market $299,000 Active 17 DOM
-
2026-06-01days on market $299,000 Active 16 DOM
-
2026-05-31days on market $299,000 Active 15 DOM
-
2026-05-30days on market $299,000 Active 14 DOM
-
2026-05-16$309,000 Active
-
2005-03-23soldstatus $264,900
ⓘ Source: listings_history table (triggers on properties + properties_extension) + one-shot
backfill from property_details.listing_events for pre-trigger history.
Climate risk First Street
- Flood 1/10 Low FEMA zone X (unshaded) · 0% chance over 30 yrs
- Wildfire 1/10 Low
- Heat 8/10 Severe 7 d/yr ≥101°F today · 18 d/yr by 30 yrs out
- Wind 8/10 Severe 80% chance of damaging wind over 30 yrs
- Air quality 2/10 Low 1 unhealthy d/yr today · 1 by 30 yrs out
Nearby sold comps map
Loading sold comps map…
Walkable amenities ~0.75 mi
Loading nearby amenities…
Taxation est. · year 1
- Rental income
- $36,100
- − Mortgage interest
- −$16,188
- − Property taxes
- −$4,335
- − Insurance
- −$1,445
- − Repairs & maintenance
- −$2,888
- − Management
- −$2,888
- − Depreciation
- −$8,407
- Taxable loss
- −$52
- Est. tax savings @ 24.0%
- +$12
- After-tax cash flow
- $4,565/yr
For passive investors: Depreciation is non-cash, so a rental often shows a tax loss while cash-flowing — sheltering income. Rental losses are passive: they offset passive income freely, and up to $25,000/yr can offset ordinary (W-2) income if you actively participate and your MAGI is under $100k (phasing out to $0 by $150k); unused losses carry forward. On sale, claimed depreciation is recaptured at up to 25%, and gains may owe capital-gains tax (a 1031 exchange can defer both). Figures are a year-1 estimate at your 24.0% rate — not tax advice; consult a CPA.
Schools (NCES district)
- District
- Indian River School District
- NCES district ID
- 1000680
- Math proficiency
- 25% ▼ -27.00%
- Reading proficiency
- 41% ▼ -17.00%
- Median HH income
- $53,838
- Composite
- 28.99/100
- National rank
- #6620
- State rank
- #14 of 26 in DE
Livability — Long Neck
- Score
- 69/100
- State rank
- #30
- US rank
- #8720
Category grades
Schools grade is shown separately in the Schools card above.
Census & demographics
- County
- Sussex County · 82,708 people
- Metro
- Salisbury, MD-DE
- Population (ZIP)
- 35,884
- Household income
- $78,305
- Rent vs Own
- Severe rent burden
- 464.0
Population outlook (Sussex County) Hauer SSP2
- Today (2025)
- 248,853 people
- By 2030
- 264,464 · +6.3%
- By 2040
- 290,980 · +16.9%
- By 2050
- 311,259 · +25.1%
- By 2075
- 352,488 · +41.6%
- By 2100
- 367,406 · +47.6%
Race, ethnicity, and origin ACS 2023
- Neighborhood character
- Predominantly White (74%)
- Race & ethnicity
- White 74% Hispanic / Latino 11% Black 8% Two or more races 7% Native American 3% Asian 1%
- Hispanic origin (detail)
- Mexican 3%
- Common ancestry
- Romanian 4% Slovak 2% Serbian 1%
- Foreign-born
- 8% · Canada, China
- Languages at home
- 88% English-only · Spanish 9% Other Indo-European 1%
Political lean MEDSL · Sussex
- 2024 margin
- R (+11.0) · D 43.9% · R 54.9% · Other 1.2%
- 2008→2024 swing
- -2.4pp toward R · 2008: -8.6pp · 2024: -11.0pp
- All cycles
- 2024: R+11.0 2020: R+11.2 2016: R+22.0 2012: R+13.0 2008: R+8.6
Not yet ingested
- Civics
- —
Market trends
- HPI YoY
- ▼ -18.26%
- Current HPI
- 268.5609
- Rent YoY
- —
- Metro
- Salisbury, MD-DE
- State GDP YoY
- —
- F500 in state
- 0
Price history
+16.6% since first listed2 events — show timeline
- 2026-05-16 Listed $309,000 BRIGHT MLS
- 2005-03-23 Sold (Public Records) $264,900 Public Records
Property tax history
-0.5%/yrLatest (2025): $445 · -23.5% YoY. Source: county tax records.
Cash-flow waterfall
monthlySold comps — $/sqft
last 12 mo · ≤1 miLoading sold comps…