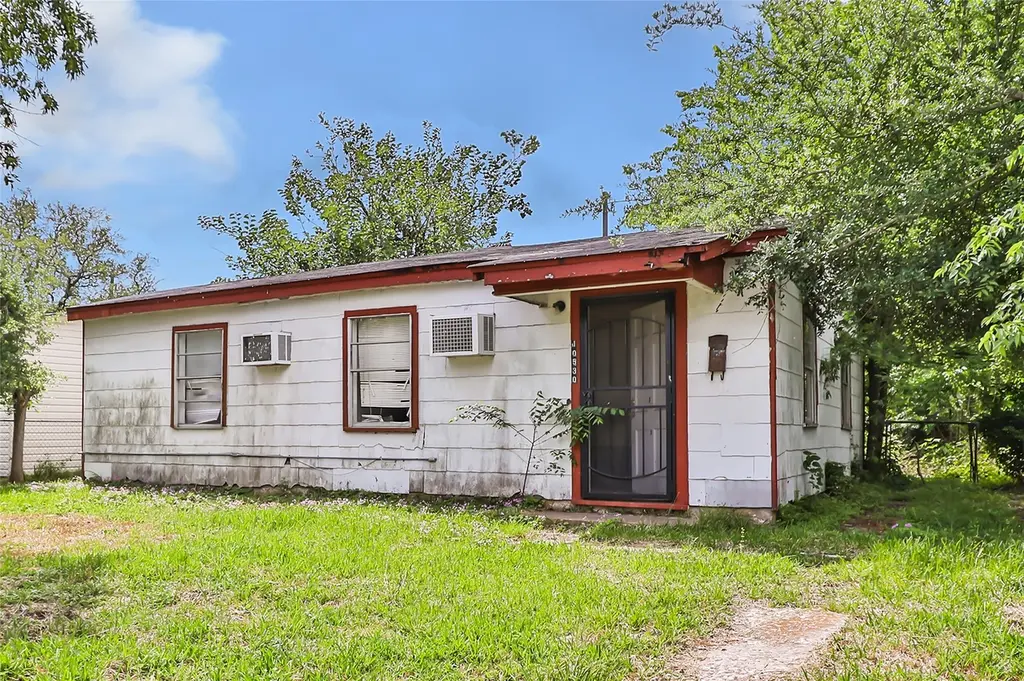
10530 Chadwick St · Jacinto City, TX
Flood risk 8/10 · Major
- FEMA flood zone
- X (unshaded)
- Chance of flooding over 30 yrs
- 0.99%
- Est. flood insurance / yr
- $507 – $1,088
Fire risk 3/10 · Minor
- Est. fire insurance / yr
- $1,222 – $2,270
Heat risk 9/10 · Severe
- Hot days now (above 109°F)
- 7 days/yr
- Hot days in 30 yrs
- 24 days/yr
Wind risk 9/10 · Severe
- Chance of severe wind over 30 yrs
- 99.0%
Air-quality risk 2/10 · Minimal
- Unhealthy air days now
- 2 days/yr
- Unhealthy air days in 30 yrs
- 2 days/yr
Risk factors via First Street. Map © Google.
Why this score? — see what drove the B+ grade
The composite is a weighted blend of 9 inputs, each scored 0–100. Each bar is that input's sub-score; the figure is the points it added to the 100-point composite (weight × sub-score).
- Cash flow +24.4/30.0
- ARV discount +15.0/15.0
- Appreciation +10.0/10.0
- DSCR +7.9/10.0
- 1% rule +7.8/10.0
- Livability +3.5/5.0
- Schools +2.8/10.0
- Rent growth +2.5/5.0
- Condition / age +2.5/5.0
$85,265
🖨 Deal sheet 📄 Offer letter ✓ Due diligence
Listing remarks
DO NOT ENTER THE BUILDING. DRIVE BY SHOWINGS ONLY. A SHOWING WILL AVAILABLE DURING OPTION PERIOD
Key facts
- 5,000 sq ft lot
- Built 1948
- Listed 2 days
Neighborhood map
What this means for you Summary
Snapshot
- This is a 2-bed/1.0-bath single-family listed at $85k.
Deal economics
- At list price, monthly cash flow is $107 ($1k/yr) — positive.
- The deal already cash-flows at list — no discount required.
- Meets the 1% rule at list price ($1k rent vs $85k).
Location & tenants
- Location reads 70/100 on livability (#384 in TX) — a middle-class / working-renter tenant base. Strengths: cost of living A+, housing A+, health & safety A-; Watch: amenities F, commute F, employment F.
- Galena Park ISD (suburban): math 32% / reading 33% proficiency, ranked #578 of 826 in TX (top 70%) — families likely to look elsewhere, expect single-tenant / working-renter base with shorter leases; 74% free/reduced lunch — lower-income household profile, screen leases tightly.
- Zoned schools: Jacinto City El (math 31% / reading 32%, grade F, #2,396 of 4,322 statewide, top 56%, 714 students, 89% FRL); Galena Park Middle (math 28% / reading 31%, grade F, #1,077 of 1,662 statewide, top 66%, 943 students, 88% FRL); Galena Park H S (math 37% / reading 36%, grade F, #924 of 1,632 statewide, top 57%, 1,914 students, 87% FRL).
- Market conditions: 153 active listings in the ZIP; 25 comparable units currently listed for rent nearby; rentals at typical pace (median 15d on market — plan ~3-4 weeks tenant-placement turnaround); 29,883 units permitted in Harris County in 2024 (8,621 in 5+ unit buildings).
Forward outlook
- In year one you build about $9k of equity ($590 loan paydown + $9k appreciation (10.0% local appreciation)).
- Harris County population projected at +47% by 2050 — long-run rental-demand tailwind backs the buy-and-hold thesis.
- At projected returns (10.0% appreciation + 3.0% rent growth), your $24k cash investment doubles in ~3 years — after that, you're playing with house money.
- By year 4, paydown + projected appreciation supports a ~$32k cash-out refi (75% LTV) — recoverable capital for the next deal without selling this one.
Negotiation context
- Only 2 days on market — expect competitive offers; lowballing is unlikely to land.
Risks & watch-outs
- Watch-outs: property tax is 3.0% of price; flood insurance adds $66/mo; built in 1948 — expect roof / HVAC / electrical / plumbing capex.
- Climate carrying-cost: severe flood risk; severe wind risk, 99% chance of damaging wind over 30y; extreme-heat days projected 7→24/yr by 2055 (HVAC capex compounding) — expect insurance premiums to compound above CPI over the hold.
Questions for the listing agent
- Built in 1948 — when were the roof, HVAC, electrical panel, plumbing, and water heater last replaced?
- Property tax is high relative to price — has the assessment been appealed recently, and will the sale trigger a re-assessment?
- What's the actual annual flood-insurance premium (NFIP or private), and is the property in a SFHA with mandatory coverage?
- Is there a deadline driving the sale (1031 exchange, divorce, estate, relocation)? That informs how much negotiation room exists.
- Schools are F-rated, which usually means shorter tenancies and higher turnover. Who's the typical renter profile here, and what's been the actual vacancy rate?
- What's the average days-on-market for RENTAL listings here right now (not sales)? A rising rental-DOM trend means longer vacancies and softer asking-rent achievability than the comps imply.
- What's the recent tenant-quality profile in this submarket — average credit score on applications, eviction rate, late-payment / NSF rate, and stable-employment percentage? A property-management company in the area should have these aggregated.
- How much new for-sale + rental construction is in the pipeline within 1–3 miles? Heavy new supply typically softens prices + rents 12–24 months out; constrained supply supports both.
Investment metrics
- 1% rule
- 1.28% ✓
- Cap rate
- 8.73%
- Cash-on-cash
- 8.70%
- DSCR
- 1.39
- GRM
- 6.5
CMA / ARV
- ARV (on-the-fly)
- $121,600
- Comps found
- 9
Show comp detail 9 sales within ~0.75 mi
| Address | Dist | Beds/Ba | Sqft | Sold | Price | $/sf | Match |
|---|---|---|---|---|---|---|---|
| 10530 Chadwick St | 0.00mi | 2/1.0 | 800 (0%) | 1mo | $85,265 | $107 | 99 |
| 10314 Chadwick St | 0.26mi | 2/1.0 | 800 (0%) | 2mo | $139,000 | $174 | 86 |
| 10629 Flaxman St | 0.10mi | 2/1.0 | 788 (-2%) | 10mo | $119,900 | $152 | 85 |
| 10429 Pillot St | 0.16mi | 2/1.0 | 792 (-1%) | 10mo | $119,000 | $150 | 83 |
| 10601 Munn St | 0.08mi | 2/1.0 | 780 (-2%) | 12mo | $145,000 | $186 | 82 |
| 10338 Norvic St | 0.28mi | 2/2.0 | 800 (0%) | 3mo | $160,000 | $200 | 80 |
| 10605 Lane St | 0.14mi | 2/1.0 | 702 (-12%) | 0mo | $82,500 | $118 | 73 |
| 10617 Burman St | 0.19mi | 2/1.0 | 828 (+4%) | 20mo | $225,000 | $272 | 68 |
| 1314 Sheryl St | 0.69mi | 2/1.0 | 768 (-4%) | 19mo | $117,000 | $152 | 45 |
Match score weights: distance 35% · size 25% · config 20% · recency 20%. Top-matched comps best support the ARV.
Projected returns pro-forma
10.0% appreciation · 3.0% rent growth · sell at horizon
- IRR
- 28.2%
- Equity multiple
- 3.23×
- Total profit
- $53,355
- Equity at exit
- $76,813
- IRR
- 24.6%
- Equity multiple
- 7.37×
- Total profit
- $152,016
- Equity at exit
- $165,651
Cash invested: $23,874 (down + closing). Projections, not guarantees.
Landlord ↔ Tenant lean methodology
- Overall (STATE)
- 87 Strongly Landlord-Friendly
- State Texas
- 87 Strongly Landlord-Friendly · R+5
- County
- — inherits STATE
- City
- — inherits STATE
ZIP-level market 77029
- Home prices YoY
- 7.2%
- Active inventory
- 153
- Price-to-rent
- 6.5×
Monthly cashflow live
- Estimated rent
- $1,096 high interval (Pro) →
- Mortgage (P&I)
- −$447
- Tax from tax record
- −$210 /mo · $2,516/yr
- Insurance
- −$36
- Flood insurance flood zone
- −$66 /mo · $798/yr
- HOA
- −$0
- Vacancy / Maint / Mgmt
- −$230
- Net cashflow
- $107
Break-even live
UW: 25.0% down · 7.5% · 30yr · 1.5% tax · 5.0% vac · 8.0% maint · 8.0% mgmt
Financing live
Cash to close
- Down payment
- $21,316
- Closing costs
- $2,558
- Reserves months
- —
- Total cash needed
- —
Loan-product check · same deal, 3 products live
Conventional
25% down · 7.5% · 30yr
- Down + closing
- —
- Monthly P&I
- —
- Monthly cashflow
- —
- DSCR
- —
- Eligible?
- —
Personal DTI + credit; lowest rate.
DSCR
20% down · 8.5% · 30yr
- Down + closing
- —
- Monthly P&I
- —
- Monthly cashflow
- —
- DSCR
- —
- Eligible?
- —
No personal income docs; deal must DSCR.
Hard money
10% down · 12.0% · 12mo
- Down + closing
- —
- Monthly P&I
- —
- Monthly cashflow
- —
- DSCR
- —
- Eligible?
- —
Short-term bridge; refi at stabilization.
Rent comps 25 comps
| Address | Beds | Baths | Sqft | Rent | $/sqft | DOM | Units | Dist |
|---|---|---|---|---|---|---|---|---|
| 1726 Switzer St Unit 4 Houston, TX | 1.0 | 1.0 | 620 | $500 | $0.81 | 19d | 1 | 0.48mi |
| 1726 Switzer St Houston, TX | 1.0 | 1.0 | 620 | $500 | $0.81 | 15d | 1 | 0.48mi |
| 10208 Challenger 7 Dr Jacinto City, TX | 2.0 | 1.0 | 900 | $1,190 | $1.32 | 43d | 1 | 0.66mi |
| 10202 Challenger 7 Dr Unit 10253 Jacinto City, TX | 1.0 | 1.0 | 705 | $1,004 | $1.42 | 43d | 1 | 0.69mi |
| 10202 Challenger 7 Dr Unit 10259 Jacinto City, TX | 2.0 | 2.0 | 900 | $1,107 | $1.23 | 3d | 1 | 0.69mi |
| 10202 Challenger 7 Dr Unit 10223 Jacinto City, TX | 1.0 | 1.0 | 615 | $831 | $1.35 | 3d | 1 | 0.69mi |
| 10202 Challenger 7 Dr Unit 10223 Jacinto City, TX | 1.0 | 1.0 | 705 | $1,009 | $1.43 | 13d | 1 | 0.69mi |
| 10202 Challenger 7 Dr Apt 321 Jacinto City, TX | 1.0 | 1.0 | 615 | $834 | $1.36 | 7d | 1 | 0.69mi |
| 10202 Challenger 7 Dr Unit 1162 Jacinto City, TX | 1.0 | 1.0 | 615 | $834 | $1.36 | 5d | 1 | 0.69mi |
| 10202 Challenger 7 Dr Unit 424 Jacinto City, TX | 2.0 | 2.0 | 900 | $1,115 | $1.24 | 5d | 1 | 0.69mi |
| 10202 Challenger 7 Dr Unit 422 Jacinto City, TX | 2.0 | 2.0 | 900 | $1,115 | $1.24 | 7d | 1 | 0.69mi |
| 10202 Challenger 7 Dr Jacinto City, TX | 1.0 | 1.0 | 615 | $823 | $1.34 | 12d | 1 | 0.70mi |
| 10202 Challenger 7 Dr Unit 1047 Jacinto City, TX | 1.0 | 1.0 | 705 | $971 | $1.38 | 18d | 1 | 0.70mi |
| 10202 Challenger 7 Dr Unit 2047 Jacinto City, TX | 2.0 | 2.0 | 900 | $1,150 | $1.28 | 11d | 1 | 0.70mi |
| 9907 Lanewell St Unit a Houston, TX | 3.0 | 2.0 | 872 | $1,154 | $1.32 | 22d | 1 | 0.70mi |
| 9806 Fillmore St Houston, TX | 2.0 | 2.0 | 850 | $1,850 | $2.18 | 43d | 1 | 0.85mi |
| 9701 Market St Houston, TX | 1.0–2.0 | 1.0 | 798 | $1,309 | $1.64 | 7d | 1 | 1.06mi |
| 9713 Stedman St Unit b Houston, TX | 3.0 | 2.0 | 872 | $1,095 | $1.26 | 43d | 1 | 1.11mi |
| 9743 Veyblum St Unit B Houston, TX | 3.0 | 2.0 | 872 | $1,145 | $1.31 | 5d | 1 | 1.17mi |
| 12200 Fleming Dr Houston, TX | 1.0–3.0 | 1.0–2.0 | 842 | $1,022 | $1.21 | 1d | 25 | 1.43mi |
| 768 Coolwood Dr Houston, TX | 2.0 | 1.0 | 1102 | $1,295 | $1.18 | 43d | 1 | 1.45mi |
| 778 Coolwood Dr Houston, TX | 2.0 | 1.0 | 1000 | $1,295 | $1.29 | 43d | 1 | 1.48mi |
| 12006 Fleming Dr Houston, TX | 1.0 | 1.0 | 561 | $860 | $1.53 | 18d | 1 | 1.48mi |
| 12006 Fleming Dr Houston, TX | 1.0 | 1.0 | 561 | $860 | $1.53 | 43d | 1 | 1.48mi |
| 12006 Fleming Dr Houston, TX | 2.0 | 1.0 | 816 | $1,025 | $1.26 | 24d | 1 | 1.48mi |
Listing history 3 events
-
2026-04-23status Pending
-
2026-04-21$85,265 Active
-
1988-01-02soldstatus
ⓘ Source: listings_history table (triggers on properties + properties_extension) + one-shot
backfill from property_details.listing_events for pre-trigger history.
Tax reassessment forecast TX · Resets to sale price
- Current annual tax
- $2,516 · $210/mo
- Projected year-2 tax
- $2,516 · $210/mo
- Expected delta
- $0/yr ($0/mo · 0.0%)
ⓘ Screening estimate from a state-policy table — verify with the county assessor before closing.
Climate risk First Street
- Flood 8/10 Severe FEMA zone X (unshaded) · 99% chance over 30 yrs
- Wildfire 3/10 Moderate
- Heat 9/10 Extreme 7 d/yr ≥109°F today · 24 d/yr by 30 yrs out
- Wind 9/10 Extreme 99% chance of damaging wind over 30 yrs
- Air quality 2/10 Low 2 unhealthy d/yr today · 2 by 30 yrs out
Nearby sold comps map
Loading sold comps map…
Walkable amenities ~0.75 mi
Loading nearby amenities…
Taxation est. · year 1
- Rental income
- $13,147
- − Mortgage interest
- −$4,776
- − Property taxes
- −$2,516
- − Insurance
- −$1,224
- − Repairs & maintenance
- −$1,052
- − Management
- −$1,052
- − Depreciation
- −$2,480
- Taxable income
- $47
- Est. tax owed @ 24.0%
- −$11
- After-tax cash flow
- $1,269/yr
For passive investors: Depreciation is non-cash, so a rental often shows a tax loss while cash-flowing — sheltering income. Rental losses are passive: they offset passive income freely, and up to $25,000/yr can offset ordinary (W-2) income if you actively participate and your MAGI is under $100k (phasing out to $0 by $150k); unused losses carry forward. On sale, claimed depreciation is recaptured at up to 25%, and gains may owe capital-gains tax (a 1031 exchange can defer both). Figures are a year-1 estimate at your 24.0% rate — not tax advice; consult a CPA.
Schools (NCES district)
- District
- Galena Park ISD
- NCES district ID
- 4820250
- Math proficiency
- 32% ▼ -20.00%
- Reading proficiency
- 33% ▼ -7.00%
- Median HH income
- $43,158
- Composite
- 27.62/100
- National rank
- #6927
- State rank
- #578 of 826 in TX
Livability — Jacinto City
- Score
- 70/100
- State rank
- #384
- US rank
- #8027
Category grades
Schools grade is shown separately in the Schools card above.
Census & demographics
- Census place
- Jacinto City, TX
- County
- Harris County · 4,702,590 people
- City population
- 16,154
- Metro
- Houston-The Woodlands-Sugar Land, TX
- Population (ZIP)
- 16,154
- Household income
- $48,279
- Rent vs Own
- Severe rent burden
- 457.0
Population outlook (Harris County) Hauer SSP2
- Today (2025)
- 5,571,493 people
- By 2030
- 6,089,821 · +9.3%
- By 2040
- 7,142,806 · +28.2%
- By 2050
- 8,185,864 · +46.9%
- By 2075
- 10,574,329 · +89.8%
- By 2100
- 12,109,958 · +117.4%
Race, ethnicity, and origin ACS 2023
- Neighborhood character
- Predominantly Hispanic (72%)
- Race & ethnicity
- Hispanic / Latino 72% Two or more races 32% Black 22% White 5%
- Hispanic origin (detail)
- Mexican 66%
- Foreign-born
- 31% · Canada
- Languages at home
- 39% English-only · Spanish 61%
Political lean MEDSL · Harris
- 2024 margin
- Lean D (+5.5) · D 52.0% · R 46.4% · Other 1.6%
- 2008→2024 swing
- +3.9pp toward D · 2008: 1.6pp · 2024: 5.5pp
- All cycles
- 2024: D+5.5 2020: D+13.3 2016: D+12.4 2012: D+0.1 2008: D+1.6
Not yet ingested
- Civics
- —
Market trends
- HPI YoY
- ▲ 18.53%
- Current HPI
- 276.1811
- Rent YoY
- —
- Metro
- Houston-The Woodlands-Sugar Land, TX
- State GDP YoY
- ▲ 3.95%
- F500 in state
- 110
Industry mix (Fortune 500 HQ in TX)
| Industry | F500 HQs | Revenue |
|---|---|---|
| Energy | 16 | $1,198B |
|
||
| Technology | 5 | $198B |
|
||
| Engineering / Construction | 4 | $72B |
|
||
| Energy Services | 3 | $60B |
|
||
| Utilities | 3 | $41B |
|
||
| Healthcare | 2 | $330B |
|
||
Price history
3 events — show timeline
- 2026-04-23 Pending — HARMLS
- 2026-04-21 Listed $85,265 HARMLS
- 1988-01-02 Sold (Public Records) — Public Records
Property tax history
+11.7%/yrLatest (2025): $2,516 · +1.1% YoY. Source: county tax records.
Cash-flow waterfall
monthlySold comps — $/sqft
last 12 mo · ≤1 miLoading sold comps…